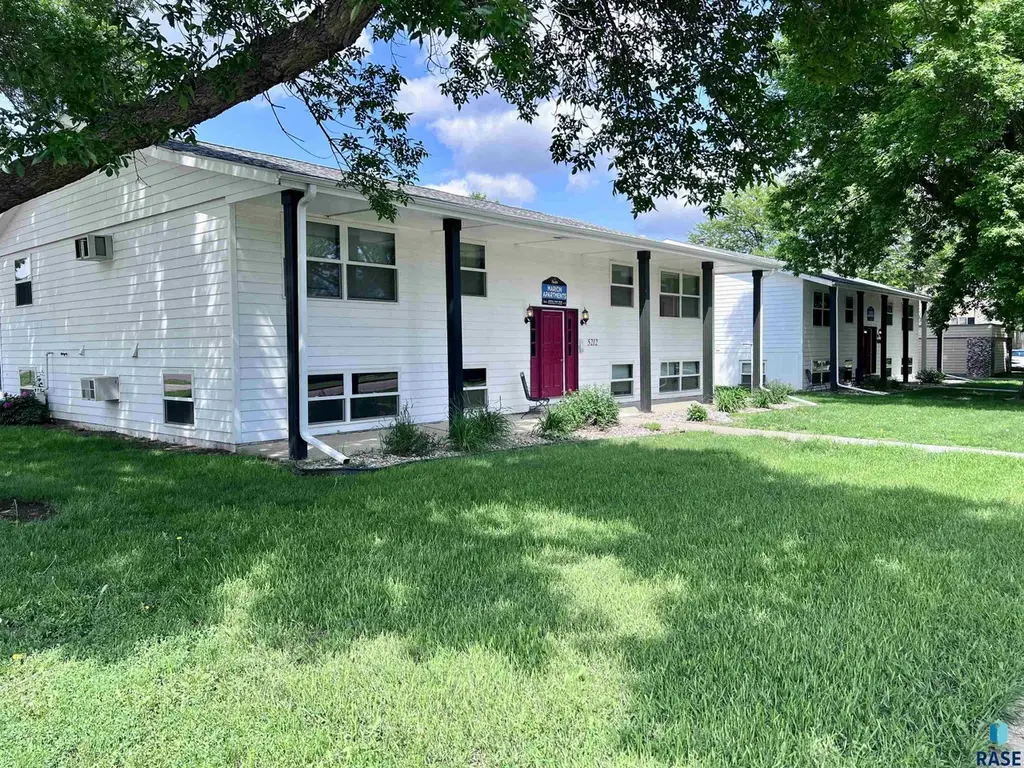
 Duplex
5212 W 47th St St · Sioux Falls, SD
Flood risk 1/10 · Minimal
- FEMA flood zone
- X (unshaded)
- Chance of flooding over 30 yrs
- 0.0%
- Est. flood insurance / yr
- $507 – $1,088
Fire risk 1/10 · Minimal
- Est. fire insurance / yr
- $1,342 – $2,492
Heat risk 2/10 · Minimal
- Hot days now (above 99°F)
- 7 days/yr
- Hot days in 30 yrs
- 14 days/yr
Wind risk 2/10 · Minimal
- Chance of severe wind over 30 yrs
- —
Air-quality risk 2/10 · Minimal
- Unhealthy air days now
- 1 days/yr
- Unhealthy air days in 30 yrs
- 1 days/yr
Risk factors via First Street. Map © Google.
Why this score? — see what drove the F grade
The composite is a weighted blend of 9 inputs, each scored 0–100. Each bar is that input's sub-score; the figure is the points it added to the 100-point composite (weight × sub-score).
- ARV discount +14.4/15.0
- Cash flow +5.4/30.0
- Livability +4.2/5.0
- Schools +3.7/10.0
- Rent growth +3.0/5.0
- Condition / age +2.5/5.0
- 1% rule +0.6/10.0
- DSCR +0.0/10.0
- Appreciation +0.0/10.0
$400,000
🖨 Deal sheet 📄 Offer letter ✓ Due diligence
Multi-family units
County records classify this as Multi-Family (5+ Unit). Listing-text estimate: 2 units. estimate disagrees with records
5+ unit building — per-unit beds/baths from public records are typically unavailable; the breakdown below (if shown) is an estimate from the listing text.
Listing remarks MLS
Discover an exceptional investment in these side-by-side 4-plexes boasting a stellar rental history and strong cash flow potential. Each building features three spacious 2-bedroom, 1-bath units and one efficient 1-bedroom, 1-bath unit, with room for rent increases. Enjoy great layouts, wall AC, boiler heat, individually metered electric, and common area coin-op laundry. Utilities including water/sewer, gas, and trash are passed through to tenants. Ample rear parking plus a 4-stall garage for one building. Only one vacant unit, ideal for showings. Prime location ensures super rentability and low vacancies. Total asking price for both fourplexes is 800k.
Key facts
- Boiler heat
- Wall ac
- 0.25 acre lot
Tags
Neighborhood map
What this means for you Summary
Snapshot
- This is a 2 × 1-bed/?-bath units multifamily listed at $400k.
Deal economics
- At list price, monthly cash flow is $-864 ($-10k/yr) — negative. Per door: $-432/mo.
- To cash-flow at today's rent, offer at most $247k (38.2% below list).
- To meet the 1% rule (rent ≥ 1% of price), the offer needs to be $226k (43.5% below list).
- Recommended offer: $226k (43.5% below list) — sets the bar for 1% rule.
- Cap rate 3.7% vs local median 2.6% in Sioux Falls — top-decile yield for the area; either an underpriced asset or a hidden risk that comps aren't pricing in. Stress-test before assuming the spread holds.
Location & tenants
- Location reads 85/100 on livability (#3 in SD, #610 nationally) — a professional / high-income tenant draw. Strengths: amenities A+, commute A+, cost of living A+; Watch: crime F.
- Sioux Falls School District 49-5 (urban): math 39% / reading 48% proficiency, ranked #45 of 59 in SD (top 76%) — families likely to look elsewhere, expect single-tenant / working-renter base with shorter leases.
- Market conditions: Rents rising (+2.2%/yr); 393 active listings in the ZIP; solid renter incomes; 2,425 units permitted in Minnehaha County in 2024 (1,367 in 5+ unit buildings).
- This rent runs 35% of the median local income ($78k/yr) — at the standard rent-burdened threshold; future hikes will face affordability resistance.
Forward outlook
- Local home prices are declining (-3.0%/yr); year-one equity from $3k of loan paydown is wiped out by about $12k of value loss. Plan a longer hold.
- Minnehaha County population projected at +46% by 2050 — long-run rental-demand tailwind backs the buy-and-hold thesis.
Negotiation context
- It's been on market 272 days — a 12% lower offer ($352k) is reasonable based on typical stale-listing flexibility.
- 5 sale attempts since 2y ago; this cycle's ask is 53736% above the opening price — seller raised mid-cycle; expect resistance to lowballs.
Questions for the listing agent
- What do current leases actually rent for vs. the listed asking? Can we see a recent rent roll and the last 12 months of T-12 income?
- It's been on market 272 days. Have you received any prior offers? Is the seller open to a 44% concession, seller financing, or rate buy-down credit?
- Can we see the unit-by-unit rent roll, current vacancy, and any below-market leases? What's the average tenancy length?
- What capital expenditures (roof, boiler, parking lot, exteriors) have been made in the last 5 years, and what's planned in the next 2?
- Built in 1973 — when were the roof, HVAC, electrical panel, plumbing, and water heater last replaced?
- Why hasn't it sold? Are there any deal-killer items the seller is aware of (foundation, flood, title, zoning, code violations)?
- Is there a deadline driving the sale (1031 exchange, divorce, estate, relocation)? That informs how much negotiation room exists.
- Schools are B-rated — typically a magnet for longer-tenancy family renters. What's the average tenant stay here, and is there a school-zone premium baked into asking?
- Crime grade is F in this area — have there been break-ins, vandalism, or insurance claims at this property in the last 3 years? What carrier currently insures it and at what premium?
- The area grade is low — what's the realistic commute time and amenity access for the typical tenant pool here? Any planned neighborhood developments (good or bad) we should know about?
- What's the average days-on-market for RENTAL listings here right now (not sales)? A rising rental-DOM trend means longer vacancies and softer asking-rent achievability than the comps imply.
- What's the recent tenant-quality profile in this submarket — average credit score on applications, eviction rate, late-payment / NSF rate, and stable-employment percentage? A property-management company in the area should have these aggregated.
- How much new apartment / multifamily construction is in the pipeline within 1–3 miles? Heavy new supply (>2% of stock underway) typically softens rents 12–24 months out; light construction supports rent growth.
Investment metrics
- 1% rule
- 0.56% ✗
- Cap rate
- 3.70%
- Cash-on-cash
- -9.26%
- DSCR
- 0.59
- GRM
- 14.7
CMA / ARV
- ARV (median comp)
- $472,257
- List price
- $400,000
- Delta
- -15.30%
- Verdict
- UNDERPRICED
- Comps
- 8 within 1.0 mi
Projected returns pro-forma
-3.0% appreciation · 2.18% rent growth · sell at horizon
- IRR
- -33.7%
- Equity multiple
- -0.09×
- Total profit
- $-121,739
- Equity at exit
- $59,641
- IRR
- -46.8%
- Equity multiple
- -0.65×
- Total profit
- $-184,489
- Equity at exit
- $34,585
Cash invested: $112,000 (down + closing). Projections, not guarantees.
Landlord ↔ Tenant lean methodology
- Overall (STATE)
- 83 Strongly Landlord-Friendly
- State South Dakota
- 83 Strongly Landlord-Friendly · R+16
- County
- — inherits STATE
- City
- — inherits STATE
ZIP-level market 57106
- Rents YoY
- 2.2%
- Active inventory
- 393
- Price-to-rent
- 29.5×
Monthly cashflow live
- Estimated rent
- $2,260 high interval (Pro) →
- Mortgage (P&I)
- −$2,098
- Tax from tax record
- −$385 /mo · $4,622/yr
- Insurance
- −$167
- HOA
- −$0
- Vacancy / Maint / Mgmt
- −$475
- Net cashflow
- $-864
Break-even live
2-unit breakdown (identical units grouped — click to expand)
| Units | Beds | Baths | Est. rent |
|---|---|---|---|
| 2× units | 1 | — | $2,260 |
| #1 | 1 | — | $1,130 |
| #2 | 1 | — | $1,130 |
| Total (2 units) | $2,260 | ||
UW: 25.0% down · 7.5% · 30yr · 1.5% tax · 5.0% vac · 8.0% maint · 8.0% mgmt
Financing live
Cash to close
- Down payment
- $100,000
- Closing costs
- $12,000
- Reserves months
- —
- Total cash needed
- —
Loan-product check · same deal, 3 products live
Conventional
25% down · 7.5% · 30yr
- Down + closing
- —
- Monthly P&I
- —
- Monthly cashflow
- —
- DSCR
- —
- Eligible?
- —
Personal DTI + credit; lowest rate.
DSCR
20% down · 8.5% · 30yr
- Down + closing
- —
- Monthly P&I
- —
- Monthly cashflow
- —
- DSCR
- —
- Eligible?
- —
No personal income docs; deal must DSCR.
Hard money
10% down · 12.0% · 12mo
- Down + closing
- —
- Monthly P&I
- —
- Monthly cashflow
- —
- DSCR
- —
- Eligible?
- —
Short-term bridge; refi at stabilization.
Listing history 28 events
-
2026-06-18days on market $400,000 Active 272 DOM
-
2026-06-17days on market $400,000 Active 271 DOM
-
2026-06-16days on market $400,000 Active 270 DOM
-
2026-06-15days on market $400,000 Active 269 DOM
-
2026-06-14days on market $400,000 Active 267 DOM
-
2026-06-13days on market $400,000 Active 266 DOM
-
2026-06-10days on market $400,000 Active 264 DOM
-
2026-06-09days on market $400,000 Active 263 DOM
-
2026-06-08days on market $400,000 Active 262 DOM
-
2026-06-07days on market $400,000 Active 261 DOM
-
2026-06-05days on market $400,000 Active 258 DOM
-
2026-06-03days on market $400,000 Active 257 DOM
-
2026-06-02days on market $400,000 Active 256 DOM
-
2026-06-01days on market $400,000 Active 255 DOM
-
2026-05-31days on market $400,000 Active 254 DOM
-
2026-05-30days on market $400,000 Active 253 DOM
-
2026-05-16historical $743
-
2026-04-18$743
-
2025-10-29status Active 660-char remark
Show marketing remark (660 chars)
Discover an exceptional investment in these side-by-side 4-plexes boasting a stellar rental history and strong cash flow potential. Each building features three spacious 2-bedroom, 1-bath units and one efficient 1-bedroom, 1-bath unit, with room for rent increases. Enjoy great layouts, wall AC, boiler heat, individually metered electric, and common area coin-op laundry. Utilities including water/sewer, gas, and trash are passed through to tenants. Ample rear parking plus a 4-stall garage for one building. Only one vacant unit, ideal for showings. Prime location ensures super rentability and low vacancies. Total asking price for both fourplexes is 800k.
-
2025-09-02historical 660-char remark
Show marketing remark (660 chars)
Discover an exceptional investment in these side-by-side 4-plexes boasting a stellar rental history and strong cash flow potential. Each building features three spacious 2-bedroom, 1-bath units and one efficient 1-bedroom, 1-bath unit, with room for rent increases. Enjoy great layouts, wall AC, boiler heat, individually metered electric, and common area coin-op laundry. Utilities including water/sewer, gas, and trash are passed through to tenants. Ample rear parking plus a 4-stall garage for one building. Only one vacant unit, ideal for showings. Prime location ensures super rentability and low vacancies. Total asking price for both fourplexes is 800k.
-
2025-08-01price $400,000 660-char remark
Show marketing remark (660 chars)
Discover an exceptional investment in these side-by-side 4-plexes boasting a stellar rental history and strong cash flow potential. Each building features three spacious 2-bedroom, 1-bath units and one efficient 1-bedroom, 1-bath unit, with room for rent increases. Enjoy great layouts, wall AC, boiler heat, individually metered electric, and common area coin-op laundry. Utilities including water/sewer, gas, and trash are passed through to tenants. Ample rear parking plus a 4-stall garage for one building. Only one vacant unit, ideal for showings. Prime location ensures super rentability and low vacancies. Total asking price for both fourplexes is 800k.
-
2025-07-24$435,000 Active 660-char remark
Show marketing remark (660 chars)
Discover an exceptional investment in these side-by-side 4-plexes boasting a stellar rental history and strong cash flow potential. Each building features three spacious 2-bedroom, 1-bath units and one efficient 1-bedroom, 1-bath unit, with room for rent increases. Enjoy great layouts, wall AC, boiler heat, individually metered electric, and common area coin-op laundry. Utilities including water/sewer, gas, and trash are passed through to tenants. Ample rear parking plus a 4-stall garage for one building. Only one vacant unit, ideal for showings. Prime location ensures super rentability and low vacancies. Total asking price for both fourplexes is 800k.
-
2024-07-10historical $743
-
2024-06-11$743
-
2024-06-06historical $743
-
2024-04-23$743
-
2018-10-11soldstatus $480,000
-
2004-12-23soldstatus $152,000
ⓘ Source: listings_history table (triggers on properties + properties_extension) + one-shot
backfill from property_details.listing_events for pre-trigger history.
Tax reassessment forecast SD · Resets to sale price
- Current annual tax
- $4,622 · $385/mo
- Projected year-2 tax
- $5,240 · $437/mo
- Expected delta
- +$618/yr (+$51/mo · 13.4%)
ⓘ Screening estimate from a state-policy table — verify with the county assessor before closing.
Climate risk First Street
- Flood 1/10 Low FEMA zone X (unshaded) · 0% chance over 30 yrs
- Wildfire 1/10 Low
- Heat 2/10 Low 7 d/yr ≥99°F today · 14 d/yr by 30 yrs out
- Wind 2/10 Low
- Air quality 2/10 Low 1 unhealthy d/yr today · 1 by 30 yrs out
Nearby sold comps map
Loading sold comps map…
Walkable amenities ~0.75 mi
Loading nearby amenities…
Taxation est. · year 1
- Rental income
- $27,120
- − Mortgage interest
- −$22,406
- − Property taxes
- −$4,622
- − Insurance
- −$2,000
- − Repairs & maintenance
- −$2,170
- − Management
- −$2,170
- − Depreciation
- −$11,636
- Taxable loss
- −$17,884
- Est. tax savings @ 24.0%
- +$4,292
- After-tax cash flow
- $-6,077/yr
For passive investors: Depreciation is non-cash, so a rental often shows a tax loss while cash-flowing — sheltering income. Rental losses are passive: they offset passive income freely, and up to $25,000/yr can offset ordinary (W-2) income if you actively participate and your MAGI is under $100k (phasing out to $0 by $150k); unused losses carry forward. On sale, claimed depreciation is recaptured at up to 25%, and gains may owe capital-gains tax (a 1031 exchange can defer both). Figures are a year-1 estimate at your 24.0% rate — not tax advice; consult a CPA.
Schools (NCES district)
- District
- Sioux Falls School District 49-5
- NCES district ID
- 4666270
- Math proficiency
- 39% ▼ -4.00%
- Reading proficiency
- 48% ▼ -2.00%
- Median HH income
- $51,093
- Composite
- 37.47/100
- National rank
- #4407
- State rank
- #45 of 59 in SD
Livability — Sioux Falls
- Score
- 85/100
- State rank
- #3
- US rank
- #610
Category grades
Schools grade is shown separately in the Schools card above.
Census & demographics
- Census place
- Sioux Falls, SD
- County
- Minnehaha County · 191,523 people
- City population
- 207,623
- Metro
- Sioux Falls, SD
- Population (ZIP)
- 51,907
- Household income
- $77,580
- Rent vs Own
- Severe rent burden
- 1500.0
Population outlook (Minnehaha County) Hauer SSP2
- Today (2025)
- 222,323 people
- By 2030
- 241,430 · +8.6%
- By 2040
- 281,643 · +26.7%
- By 2050
- 325,574 · +46.4%
- By 2075
- 469,313 · +111.1%
- By 2100
- 664,763 · +199.0%
Race, ethnicity, and origin ACS 2023
- Neighborhood character
- Predominantly White (81%)
- Race & ethnicity
- White 81% Hispanic / Latino 7% Two or more races 7% Black 5% Asian 1% Native American 1%
- Hispanic origin (detail)
- Mexican 2%
- Common ancestry
- Portuguese 12% Iranian 7% Lithuanian 2%
- Foreign-born
- 7% · Canada
- Languages at home
- 91% English-only · Spanish 5% Russian/Polish/Slavic 1% Other Indo-European 1%
Political lean MEDSL · Minnehaha
- 2024 margin
- R (+12.7) · D 42.5% · R 55.2% · Other 2.4%
- 2008→2024 swing
- -13.4pp toward R · 2008: 0.7pp · 2024: -12.7pp
- All cycles
- 2024: R+12.7 2020: R+9.5 2016: R+14.6 2012: R+7.4 2008: D+0.7
Not yet ingested
- Civics
- —
Market trends
- HPI YoY
- ▼ -138.17%
- Current HPI
- 214.9065
- Rent YoY
- ▲ 2.18%
- Metro
- Sioux Falls, SD
- State GDP YoY
- ▲ 0.70%
- F500 in state
- 2
Industry mix (Fortune 500 HQ in SD)
| Industry | F500 HQs | Revenue |
|---|---|---|
| Utilities | 1 | $1B |
|
||
Price history
+163.2% since first listed12 events — show timeline
- 2026-05-16 Rental Removed $743 APPFOLIO
- 2026-04-18 Listed for Rent $743 APPFOLIO
- 2025-10-29 Relisted — REALTOR® Association of the Sioux Empire
- 2025-09-02 Listing Removed — REALTOR® Association of the Sioux Empire
- 2025-08-01 Price Changed $400,000 REALTOR® Association of the Sioux Empire
- 2025-07-24 Listed $435,000 REALTOR® Association of the Sioux Empire
- 2024-07-10 Rental Removed $743 APPFOLIO
- 2024-06-11 Listed for Rent $743 APPFOLIO
- 2024-06-06 Rental Removed $743 APPFOLIO
- 2024-04-23 Listed for Rent $743 APPFOLIO
- 2018-10-11 Sold (Public Records) $480,000 Public Records
- 2004-12-23 Sold (Public Records) $152,000 Public Records
Property tax history
+2.0%/yrLatest (2024): $4,622 · +2.1% YoY. Source: county tax records.
Cash-flow waterfall
monthlySold comps — $/sqft
last 12 mo · ≤1 miLoading sold comps…