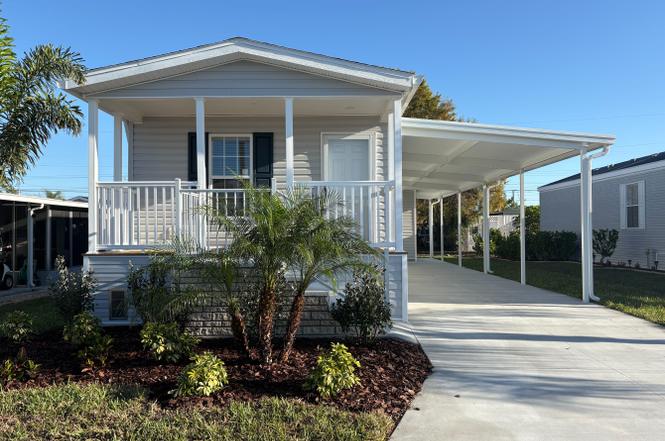
263 DISCOVERY LANE Plan · North Fort Myers, FL
Flood risk No data
- FEMA flood zone
- —
- Chance of flooding over 30 yrs
- —
- Est. flood insurance / yr
- —
Fire risk No data
- Est. fire insurance / yr
- —
Heat risk No data
- Hot days now (above threshold)
- —
- Hot days in 30 yrs
- —
Wind risk No data
- Chance of severe wind over 30 yrs
- —
Air-quality risk No data
- Unhealthy air days now
- —
- Unhealthy air days in 30 yrs
- —
Risk factors via First Street. Map © Google.
Why this score? — see what drove the C- grade
The composite is a weighted blend of 9 inputs, each scored 0–100. Each bar is that input's sub-score; the figure is the points it added to the 100-point composite (weight × sub-score).
- Cash flow +25.5/30.0
- DSCR +8.4/10.0
- 1% rule +6.7/10.0
- Schools +4.1/10.0
- Livability +3.7/5.0
- Condition / age +2.5/5.0
- Rent growth +2.0/5.0
- ARV discount +0.6/15.0
- Appreciation +0.0/10.0
$134,995
🖨 Deal sheet 📄 Offer letter ✓ Due diligence
Listing remarks
Experience refined, low-maintenance living in this beautifully appointed new 2 bedroom, 2 bath open-concept home, designed with the 55+ lifestyle in mind. The kitchen showcases elegant track lighting and a complete appliance package, blending style with everyday functionality. The spacious main suite features a private en-suite with a walk-in shower, while the guest bath offers a tub/shower combination ideal for both comfort and relaxation. A private storage shed provides ample space for your extras, and the covered carport adds convenience while enhancing your outdoor living experience
Key facts
- Open-concept home
- Covered carport
- Private en-suite
Tags
Property features AI
Finance
- Other: Address: 8791 Littleton Rd, North Fort Myers FL 33903; Status: Active; Last modified: 2026-04-28T16:08:08.419Z
- Financial info: List price $134,995
Exterior
- Home design: Plan: 263 DISCOVERY LANE
Interior
- Bedrooms: 2 bedrooms
- Bathrooms: 2 bathrooms
- Interior features: Living area of 900
Neighborhood map
What this means for you Summary
Snapshot
- This is a 2-bed/2.0-bath manufactured listed at $135k.
Deal economics
- At list price, monthly cash flow is $314 ($4k/yr) — positive.
- The deal already cash-flows at list — no discount required.
- Meets the 1% rule at list price ($2k rent vs $135k).
- Recommended offer: $119k (12.0% below list) — sets the bar for market timing.
- Cap rate 9.1% vs local median 3.6% in North Fort Myers — top-decile yield for the area; either an underpriced asset or a hidden risk that comps aren't pricing in. Stress-test before assuming the spread holds.
Location & tenants
- Location reads 74/100 on livability (#269 in FL, #4,409 nationally) — a middle-class / working-renter tenant base. Strengths: cost of living A+, housing A+, health & safety A+; Watch: employment C-, amenities F, commute F.
- Lee (suburban): math 47% / reading 50% proficiency, ranked #42 of 73 in FL (top 58%) — families likely to look elsewhere, expect single-tenant / working-renter base with shorter leases.
- Market conditions: Rents soft (-1.9%/yr); 472 active listings in the ZIP; 18 comparable units currently listed for rent nearby; rentals at typical pace (median 24d on market — plan ~3-4 weeks tenant-placement turnaround); 15,411 units permitted in Lee County in 2024 (4,686 in 5+ unit buildings).
- This rent runs 33% of the median local income ($57k/yr) — at the standard rent-burdened threshold; future hikes will face affordability resistance.
Forward outlook
- Local home prices are declining (-3.0%/yr); year-one equity from $933 of loan paydown is wiped out by about $4k of value loss. Plan a longer hold.
- Lee County population projected at +44% by 2050 — long-run rental-demand tailwind backs the buy-and-hold thesis.
Negotiation context
- It's been on market 163 days — a 12% lower offer ($119k) is reasonable based on typical stale-listing flexibility.
Questions for the listing agent
- It's been on market 163 days. Have you received any prior offers? Is the seller open to a 12% concession, seller financing, or rate buy-down credit?
- Why hasn't it sold? Are there any deal-killer items the seller is aware of (foundation, flood, title, zoning, code violations)?
- Is there a deadline driving the sale (1031 exchange, divorce, estate, relocation)? That informs how much negotiation room exists.
- What's the average days-on-market for RENTAL listings here right now (not sales)? A rising rental-DOM trend means longer vacancies and softer asking-rent achievability than the comps imply.
- What's the recent tenant-quality profile in this submarket — average credit score on applications, eviction rate, late-payment / NSF rate, and stable-employment percentage? A property-management company in the area should have these aggregated.
- How much new for-sale + rental construction is in the pipeline within 1–3 miles? Heavy new supply typically softens prices + rents 12–24 months out; constrained supply supports both.
Investment metrics
- 1% rule
- 1.17% ✓
- Cap rate
- 9.09%
- Cash-on-cash
- 9.98%
- DSCR
- 1.44
- GRM
- 7.1
CMA / ARV
- ARV (on-the-fly)
- $117,000
- Comps found
- 4
Show comp detail 4 sales within ~0.75 mi
| Address | Dist | Beds/Ba | Sqft | Sold | Price | $/sf | Match |
|---|---|---|---|---|---|---|---|
| 3541 Celestial Way | 0.57mi | 2/2.0 | 864 (-4%) | 7mo | $50,000 | $58 | 61 |
| 16034 Citron Way | 0.66mi | 2/2.0 | 960 (+7%) | 7mo | $125,000 | $130 | 52 |
| 16041 Citron Way | 0.69mi | 2/2.0 | 960 (+7%) | 6mo | $92,000 | $96 | 51 |
| 564 Hogan Dr | 0.44mi | 2/2.0 | 1,018 (+13%) | 12mo | $144,900 | $142 | 48 |
Match score weights: distance 35% · size 25% · config 20% · recency 20%. Top-matched comps best support the ARV.
Projected returns pro-forma
-3.0% appreciation · 0.0% rent growth · sell at horizon
- IRR
- -4.7%
- Equity multiple
- 0.83×
- Total profit
- $-6,454
- Equity at exit
- $20,128
- IRR
- 1.0%
- Equity multiple
- 1.06×
- Total profit
- $2,380
- Equity at exit
- $11,672
Cash invested: $37,799 (down + closing). Projections, not guarantees.
Landlord ↔ Tenant lean methodology
- Overall (STATE)
- 87 Strongly Landlord-Friendly
- State Florida
- 87 Strongly Landlord-Friendly · R+3
- County
- — inherits STATE
- City
- — inherits STATE
ZIP-level market 33903
- Rents YoY
- -1.9%
- Active inventory
- 472
- Price-to-rent
- 7.1×
Monthly cashflow live
- Estimated rent
- $1,579 high interval (Pro) →
- Mortgage (P&I)
- −$708
- Tax est. 1.5%
- −$169 /mo · $2,025/yr
- Insurance
- −$56
- HOA
- −$0
- Vacancy / Maint / Mgmt
- −$332
- Net cashflow
- $314
Break-even live
UW: 25.0% down · 7.5% · 30yr · 1.5% tax · 5.0% vac · 8.0% maint · 8.0% mgmt
Financing live
Cash to close
- Down payment
- $33,749
- Closing costs
- $4,050
- Reserves months
- —
- Total cash needed
- —
Loan-product check · same deal, 3 products live
Conventional
25% down · 7.5% · 30yr
- Down + closing
- —
- Monthly P&I
- —
- Monthly cashflow
- —
- DSCR
- —
- Eligible?
- —
Personal DTI + credit; lowest rate.
DSCR
20% down · 8.5% · 30yr
- Down + closing
- —
- Monthly P&I
- —
- Monthly cashflow
- —
- DSCR
- —
- Eligible?
- —
No personal income docs; deal must DSCR.
Hard money
10% down · 12.0% · 12mo
- Down + closing
- —
- Monthly P&I
- —
- Monthly cashflow
- —
- DSCR
- —
- Eligible?
- —
Short-term bridge; refi at stabilization.
Rent comps 18 comps
| Address | Beds | Baths | Sqft | Rent | $/sqft | DOM | Units | Dist |
|---|---|---|---|---|---|---|---|---|
| 8791 Littleton Rd North Fort Myers, FL | 2.0 | 2.0 | 1074 | $1,549 | $1.44 | 23d | 1 | 0.14mi |
| 28 Nyborg Ave North Fort Myers, FL | 3.0 | 2.0 | 1042 | $1,299 | $1.25 | 14d | 1 | 0.18mi |
| 3404 Rainbow Ln North Fort Myers, FL | 2.0 | 2.0 | 1056 | $1,800 | $1.70 | 3d | 1 | 0.57mi |
| 3260 Stockton St North Fort Myers, FL | 3.0 | 1.0–2.0 | 976 | $2,371 | $2.43 | 1d | 27 | 0.61mi |
| 571 Sunrise Ln North Fort Myers, FL | 2.0 | 2.0 | 1004 | $1,400 | $1.39 | 23d | 1 | 0.70mi |
| 538 State St North Fort Myers, FL | 3.0 | 1.5 | 1000 | $1,199 | $1.20 | 23d | 1 | 0.78mi |
| 2700 Diplomat Pkwy E Cape Coral, FL | 1.0–3.0 | 1.0–2.0 | 1116 | $2,382 | $2.13 | 3d | 41 | 0.82mi |
| 260 Stockton St North Fort Myers, FL | 2.0 | 2.0 | 924 | $1,200 | $1.30 | 3d | 1 | 0.92mi |
| 248 Stockton St North Fort Myers, FL | 3.0 | 2.0 | 924 | $1,300 | $1.41 | 23d | 1 | 0.93mi |
| 247 Stockton St North Fort Myers, FL | 3.0 | 2.0 | 924 | $1,325 | $1.43 | 23d | 1 | 0.95mi |
| 446 San Bernardino St North Fort Myers, FL | 2.0 | 1.0 | 1104 | $1,590 | $1.44 | 10d | 1 | 0.95mi |
| 2774 Wedgewood Dr North Fort Myers, FL | 2.0 | 2.0 | 880 | $1,300 | $1.48 | 23d | 1 | 1.00mi |
| 3050 Steeple Cir Cape Coral, FL | 1.0–3.0 | 1.0–2.0 | 1003 | $1,668 | $1.66 | 2d | 27 | 1.05mi |
| 4120 Pine Drop Ln North Fort Myers, FL | 3.0 | 2.0 | 957 | $1,895 | $1.98 | 23d | 1 | 1.17mi |
| 16363 Teresa Ln North Fort Myers, FL | 2.0 | 1.0 | 1000 | $1,000 | $1.00 | 23d | 1 | 1.38mi |
| 240 W Mariana Ave Apt B North Fort Myers, FL | 1.0 | 1.0 | 600 | $1,295 | $2.16 | 23d | 1 | 1.38mi |
| 2095 Eloise Cir North Fort Myers, FL | 2.0 | 1.0 | 840 | $1,295 | $1.54 | 23d | 1 | 1.43mi |
| 2027 Eloise Cir North Fort Myers, FL | 2.0 | 1.0 | 822 | $1,300 | $1.58 | 3d | 1 | 1.44mi |
Listing history 8 events
-
2026-06-17days on market $134,995 Active 163 DOM
-
2026-06-16days on market $134,995 Active 162 DOM
-
2026-06-16days on market $134,995 Active 161 DOM
-
2026-06-13days on market $134,995 Active 159 DOM
-
2026-06-09days on market $134,995 Active 155 DOM
-
2026-06-07days on market $134,995 Active 153 DOM
-
2026-06-01days on market $134,995 Active 147 DOM
-
2026-06-01days on market $134,995 Active 146 DOM
ⓘ Source: listings_history table (triggers on properties + properties_extension) + one-shot
backfill from property_details.listing_events for pre-trigger history.
Nearby sold comps map
Loading sold comps map…
Walkable amenities ~0.75 mi
Loading nearby amenities…
Taxation est. · year 1
- Rental income
- $18,947
- − Mortgage interest
- −$7,562
- − Property taxes
- −$2,025
- − Insurance
- −$675
- − Repairs & maintenance
- −$1,516
- − Management
- −$1,516
- − Depreciation
- −$3,927
- Taxable income
- $1,726
- Est. tax owed @ 24.0%
- −$414
- After-tax cash flow
- $3,359/yr
For passive investors: Depreciation is non-cash, so a rental often shows a tax loss while cash-flowing — sheltering income. Rental losses are passive: they offset passive income freely, and up to $25,000/yr can offset ordinary (W-2) income if you actively participate and your MAGI is under $100k (phasing out to $0 by $150k); unused losses carry forward. On sale, claimed depreciation is recaptured at up to 25%, and gains may owe capital-gains tax (a 1031 exchange can defer both). Figures are a year-1 estimate at your 24.0% rate — not tax advice; consult a CPA.
Schools (NCES district)
- District
- Lee
- NCES district ID
- 1201080
- Math proficiency
- 47% ▼ -11.00%
- Reading proficiency
- 50% ▼ -4.00%
- Median HH income
- $49,518
- Composite
- 41.49/100
- National rank
- #3458
- State rank
- #42 of 73 in FL
Livability — North Fort Myers
- Score
- 74/100
- State rank
- #269
- US rank
- #4409
Category grades
Schools grade is shown separately in the Schools card above.
Census & demographics
- Census place
- North Fort Myers, FL
- County
- Lee County · 788,662 people
- City population
- 57,035
- Metro
- Cape Coral-Fort Myers, FL
- Population (ZIP)
- 23,655
- Household income
- $56,993
- Rent vs Own
- Severe rent burden
- 468.0
Population outlook (Lee County) Hauer SSP2
- Today (2025)
- 871,946 people
- By 2030
- 955,468 · +9.6%
- By 2040
- 1,113,587 · +27.7%
- By 2050
- 1,256,891 · +44.1%
- By 2075
- 1,560,270 · +78.9%
- By 2100
- 1,726,848 · +98.0%
Race, ethnicity, and origin ACS 2023
- Neighborhood character
- Predominantly White (81%)
- Race & ethnicity
- White 81% Hispanic / Latino 14% Two or more races 8% Black 2%
- Hispanic origin (detail)
- Mexican 3% Puerto Rican 3% Cuban 3%
- Common ancestry
- Lithuanian 4% Romanian 4% Italian 3%
- Foreign-born
- 11% · Canada
- Languages at home
- 88% English-only · Spanish 9% Other Indo-European 1%
Political lean MEDSL · Lee
- 2024 margin
- Strong R (+28.4) · D 35.5% · R 63.9%
- 2008→2024 swing
- -18.0pp toward R · 2008: -10.4pp · 2024: -28.4pp
- All cycles
- 2024: R+28.4 2020: R+19.2 2016: R+20.4 2012: R+16.6 2008: R+10.4
Not yet ingested
- Civics
- —
Market trends
- HPI YoY
- ▼ -172.26%
- Current HPI
- 256.773
- Rent YoY
- ▼ -1.94%
- Metro
- Cape Coral-Fort Myers, FL
- State GDP YoY
- ▲ 3.28%
- F500 in state
- 36
Industry mix (Fortune 500 HQ in FL)
| Industry | F500 HQs | Revenue |
|---|---|---|
| Industrial Technology | 2 | $29B |
|
||
| Insurance | 2 | $17B |
|
||
| Retail | 1 | $60B |
|
||
| Technology Distribution | 1 | $58B |
|
||
| Homebuilding | 1 | $35B |
|
||
| Technology Manufacturing | 1 | $35B |
|
||
Cash-flow waterfall
monthlySold comps — $/sqft
last 12 mo · ≤1 miLoading sold comps…