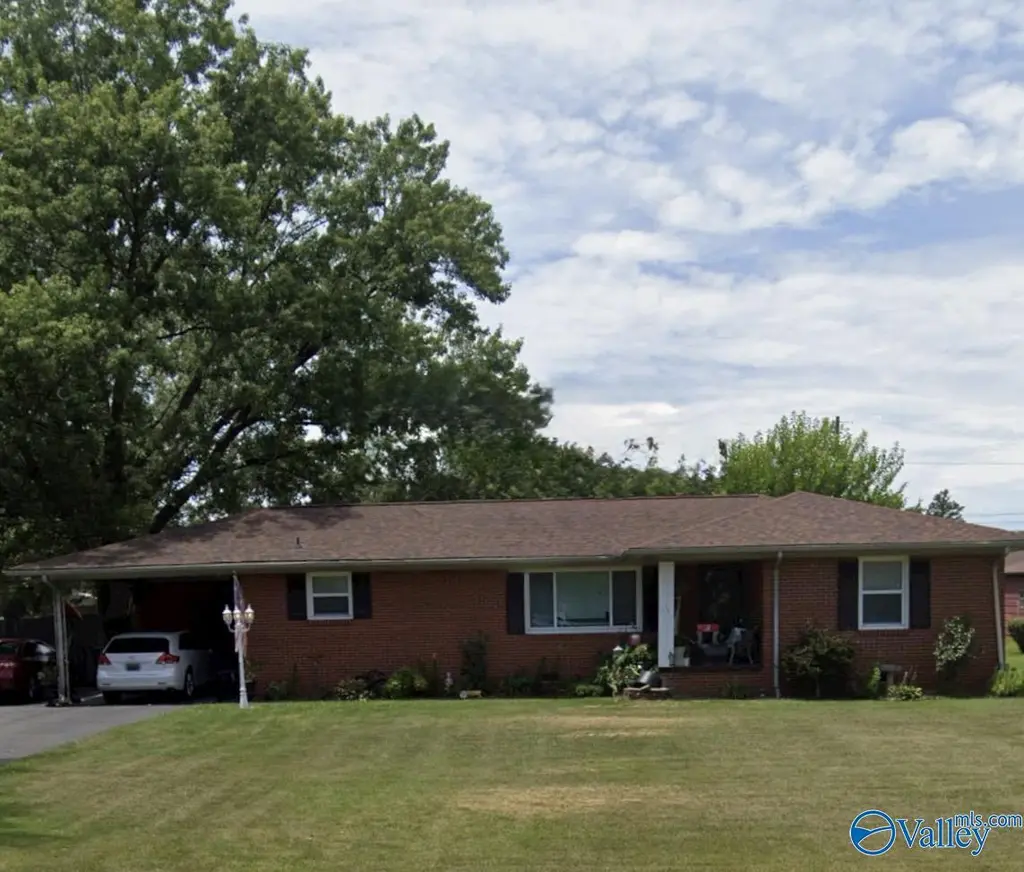
1713 Cagle Ave SW · Decatur, AL
Flood risk 1/10 · Minimal
- FEMA flood zone
- X (unshaded)
- Chance of flooding over 30 yrs
- 0.0%
- Est. flood insurance / yr
- $507 – $1,088
Fire risk 2/10 · Minimal
- Est. fire insurance / yr
- $916 – $1,700
Heat risk 6/10 · Moderate
- Hot days now (above 106°F)
- 7 days/yr
- Hot days in 30 yrs
- 19 days/yr
Wind risk 4/10 · Minor
- Chance of severe wind over 30 yrs
- 22.0%
Air-quality risk 2/10 · Minimal
- Unhealthy air days now
- 1 days/yr
- Unhealthy air days in 30 yrs
- 1 days/yr
Risk factors via First Street. Map © Google.
Why this score? — see what drove the C- grade
The composite is a weighted blend of 9 inputs, each scored 0–100. Each bar is that input's sub-score; the figure is the points it added to the 100-point composite (weight × sub-score).
- Cash flow +18.0/30.0
- ARV discount +14.2/15.0
- DSCR +5.6/10.0
- Rent growth +3.7/5.0
- Livability +3.6/5.0
- 1% rule +3.5/10.0
- Schools +2.6/10.0
- Condition / age +2.5/5.0
- Appreciation +0.0/10.0
$165,000
🖨 Deal sheet 📄 Offer letter ✓ Due diligence
Listing remarks
Home needs TLC. Would make a great rental or make it your own.
Key facts
- Built 1962
- Listed 14 days
Property features AI
Finance
- Other: Living area about 1,625 square feet
- HOA & community: No homeowners association; Subdivision: Greenacres
Exterior
- Parking: Concrete driveway
- Utilities: Public water service; Public sewer
- Home design: Single-family residence; One-story home; Built in 1962; Brick construction
- Construction: Brick exterior; Built in 1962
- Exterior features: Public water; Public sewer; Lot dimensions approximately 100 x 189 x 118 x 194
Interior
- Bathrooms: 1 full bathroom; 1 half bathroom
- Heating & cooling: Central heating; Central air conditioning
- Interior features: Crawl space foundation
Neighborhood map
What this means for you Summary
Snapshot
- This is a 3-bed/1.0-bath single-family listed at $165k.
Deal economics
- At list price, monthly cash flow is $141 ($2k/yr) — positive.
- The deal already cash-flows at list — no discount required.
- To meet the 1% rule (rent ≥ 1% of price), the offer needs to be $141k (14.6% below list).
- Recommended offer: $141k (14.6% below list) — sets the bar for 1% rule.
- Cap rate 7.3% vs local median 4.0% in Decatur — top-decile yield for the area; either an underpriced asset or a hidden risk that comps aren't pricing in. Stress-test before assuming the spread holds.
Location & tenants
- Location reads 72/100 on livability (#28 in AL) — a middle-class / working-renter tenant base. Strengths: cost of living A+, housing A+, health & safety A+; Watch: employment D+, crime F, amenities F.
- Decatur City (urban): math 22% / reading 40% proficiency, ranked #66 of 129 in AL (top 51%) — families likely to look elsewhere, expect single-tenant / working-renter base with shorter leases.
- Zoned schools: West Decatur Elementary School (math 8% / reading 17%, grade F, #536 of 627 statewide, top 88%, 346 students, 89% FRL); Austin Middle School (math 18% / reading 39%, grade F, #138 of 257 statewide, top 54%, 714 students, 77% FRL); Austin High School (math 20% / reading 24%, grade F, #142 of 305 statewide, top 51%, 1,025 students, 66% FRL) — zoned schools average 77% FRL vs 57% district-wide (21 pts higher); higher-poverty schools than district average — tighter screening recommended.
- Market conditions: Rents rising fast (+4.7%/yr); 223 active listings in the ZIP; 19 comparable units currently listed for rent nearby; rentals lingering (median 44d on market — plan ~5-8 weeks vacancy on turnover, expect pricing pressure); 84% of comp listings sitting > 30 days — soft ceiling on asking rent; 231 units permitted in Morgan County in 2024 (0 in 5+ unit buildings).
- This rent runs 33% of the median local income ($51k/yr) — at the standard rent-burdened threshold; future hikes will face affordability resistance.
Forward outlook
- Local home prices are declining (-3.0%/yr); year-one equity from $1k of loan paydown is wiped out by about $5k of value loss. Plan a longer hold.
- Morgan County population projected at -11% by 2050 — secular population decline; favor cash flow + early exit over multi-decade hold.
Negotiation context
- Only 14 days on market — expect competitive offers; lowballing is unlikely to land.
- Current owner paid $74k; list at $165k implies a 123% gain — meaningful room to come down on a strong offer.
Risks & watch-outs
- Climate carrying-cost: extreme-heat days projected 7→19/yr by 2055 (HVAC capex compounding) — expect insurance premiums to compound above CPI over the hold.
Questions for the listing agent
- Built in 1962 — when were the roof, HVAC, electrical panel, plumbing, and water heater last replaced?
- Is there a deadline driving the sale (1031 exchange, divorce, estate, relocation)? That informs how much negotiation room exists.
- Crime grade is F in this area — have there been break-ins, vandalism, or insurance claims at this property in the last 3 years? What carrier currently insures it and at what premium?
- What's the average days-on-market for RENTAL listings here right now (not sales)? A rising rental-DOM trend means longer vacancies and softer asking-rent achievability than the comps imply.
- What's the recent tenant-quality profile in this submarket — average credit score on applications, eviction rate, late-payment / NSF rate, and stable-employment percentage? A property-management company in the area should have these aggregated.
- How much new for-sale + rental construction is in the pipeline within 1–3 miles? Heavy new supply typically softens prices + rents 12–24 months out; constrained supply supports both.
Investment metrics
- 1% rule
- 0.85% ✗
- Cap rate
- 7.32%
- Cash-on-cash
- 3.67%
- DSCR
- 1.16
- GRM
- 9.8
CMA / ARV
- ARV (on-the-fly)
- $193,908
- Comps found
- 12
Show comp detail 12 sales within ~0.75 mi
| Address | Dist | Beds/Ba | Sqft | Sold | Price | $/sf | Match |
|---|---|---|---|---|---|---|---|
| 1626 Danville Rd SW | 0.07mi | 3/1.0 | 1,326 (-10%) | 3mo | $125,000 | $94 | 78 |
| 1704 Betty St SW | 0.42mi | 4/2.0 (+1) | 1,466 (-0%) | 3mo | $220,000 | $150 | 69 |
| 1615 7th Ave SW | 0.33mi | 3/2.0 | 1,329 (-10%) | 0mo | $176,000 | $132 | 64 |
| 1820 Runnymead Ave SW | 0.64mi | 3/2.0 | 1,508 (+3%) | 3mo | $215,000 | $143 | 59 |
| 1312 SW Cloverdale Ave | 0.53mi | 3/1.5 | 1,350 (-8%) | 1mo | $204,000 | $151 | 59 |
| 416 Everett Dr SW | 0.72mi | 3/2.0 | 1,440 (-2%) | 4mo | $182,619 | $127 | 56 |
| 2261 Graham Ave SW | 0.70mi | 2/1.0 (-1) | 1,412 (-4%) | 2mo | $99,900 | $71 | 54 |
| 946 Tracey Ln SW | 0.65mi | 3/2.0 | 1,583 (+8%) | 1mo | $239,900 | $152 | 52 |
| 1712 Vinca St SW | 0.50mi | 3/2.5 | 1,650 (+12%) | 3mo | $215,000 | $130 | 48 |
| 936 Tracey Ln SW | 0.64mi | 3/2.0 | 1,636 (+11%) | 3mo | $240,000 | $147 | 45 |
| 905 Cedar St SW | 0.66mi | 2/1.0 (-1) | 1,281 (-13%) | 4mo | $145,000 | $113 | 40 |
| 304 Albert St SW | 0.68mi | 4/3.0 (+1) | 1,676 (+14%) | 1mo | $183,000 | $109 | 31 |
Match score weights: distance 35% · size 25% · config 20% · recency 20%. Top-matched comps best support the ARV.
Projected returns pro-forma
-3.0% appreciation · 4.67% rent growth · sell at horizon
- IRR
- -9.0%
- Equity multiple
- 0.67×
- Total profit
- $-15,414
- Equity at exit
- $24,602
- IRR
- 2.3%
- Equity multiple
- 1.17×
- Total profit
- $8,051
- Equity at exit
- $14,266
Cash invested: $46,200 (down + closing). Projections, not guarantees.
Landlord ↔ Tenant lean methodology
- Overall (STATE)
- 90 Strongly Landlord-Friendly
- State Alabama
- 90 Strongly Landlord-Friendly · R+15
- County
- — inherits STATE
- City
- — inherits STATE
ZIP-level market 35601
- Home prices YoY
- -26.5%
- Rents YoY
- 4.7%
- Active inventory
- 223
- Price-to-rent
- 9.8×
Monthly cashflow live
- Estimated rent
- $1,409 high interval (Pro) →
- Mortgage (P&I)
- −$865
- Tax from tax record
- −$38 /mo · $456/yr
- Insurance
- −$69
- HOA
- −$0
- Vacancy / Maint / Mgmt
- −$296
- Net cashflow
- $141
Break-even live
UW: 25.0% down · 7.5% · 30yr · 1.5% tax · 5.0% vac · 8.0% maint · 8.0% mgmt
Financing live
Cash to close
- Down payment
- $41,250
- Closing costs
- $4,950
- Reserves months
- —
- Total cash needed
- —
Loan-product check · same deal, 3 products live
Conventional
25% down · 7.5% · 30yr
- Down + closing
- —
- Monthly P&I
- —
- Monthly cashflow
- —
- DSCR
- —
- Eligible?
- —
Personal DTI + credit; lowest rate.
DSCR
20% down · 8.5% · 30yr
- Down + closing
- —
- Monthly P&I
- —
- Monthly cashflow
- —
- DSCR
- —
- Eligible?
- —
No personal income docs; deal must DSCR.
Hard money
10% down · 12.0% · 12mo
- Down + closing
- —
- Monthly P&I
- —
- Monthly cashflow
- —
- DSCR
- —
- Eligible?
- —
Short-term bridge; refi at stabilization.
Rent comps 19 comps
| Address | Beds | Baths | Sqft | Rent | $/sqft | DOM | Units | Dist |
|---|---|---|---|---|---|---|---|---|
| 1518 15th Ave SW Decatur, AL | 3.0 | 2.0 | 1440 | $1,600 | $1.11 | 43d | 1 | 0.30mi |
| 1805 8th Ave SW Decatur, AL | 3.0 | 2.0 | 1725 | $1,750 | $1.01 | 43d | 1 | 0.31mi |
| 2019 Morgan Ave SW Decatur, AL | 4.0 | 2.0 | 1064 | $1,650 | $1.55 | 43d | 1 | 0.45mi |
| 1806 Runnymead Ave SW Decatur, AL | 2.0 | 2.0 | 900 | $999 | $1.11 | 13d | 2 | 0.60mi |
| 1602 Brookridge Dr SW Decatur, AL | 1.0–2.0 | 1.0–2.0 | 797 | $1,174 | $1.47 | 43d | 13 | 0.82mi |
| 1321 Towerview St SW Decatur, AL | 1.0–2.0 | 1.0 | 762 | $964 | $1.26 | 23d | 3 | 0.94mi |
| 1504 Faye St SW Decatur, AL | 3.0 | 2.0 | 1200 | $1,450 | $1.21 | 43d | 1 | 0.96mi |
| 2500 Spring Ave SW Decatur, AL | 1.0–2.0 | 1.0–2.0 | 825 | $987 | $1.20 | 43d | 7 | 0.97mi |
| 315 Hillside Rd SW Decatur, AL | 3.0 | 1.5 | 1344 | $1,400 | $1.04 | 43d | 1 | 1.03mi |
| 1242 Beltline Rd SW Decatur, AL | 1.0–3.0 | 1.0–2.0 | 1118 | $1,150 | $1.03 | 43d | 5 | 1.05mi |
| 2131 Westmead Dr SW Decatur, AL | 2.0 | 1.5 | 1100 | $1,100 | $1.00 | 43d | 1 | 1.07mi |
| 2151 Westmead Dr SW Decatur, AL | 2.0 | 2.5 | 1300 | $1,445 | $1.11 | 43d | 1 | 1.11mi |
| 2151 Westmead Dr SW Unit na Decatur, AL | 2.0 | 1.5 | 1300 | $1,445 | $1.11 | 44d | 1 | 1.11mi |
| 2115 Central Pkwy SW Decatur, AL | 1.0–3.0 | 1.0 | 821 | $950 | $1.16 | 43d | 1 | 1.15mi |
| 1607 Glenn St SW Apt 2 Decatur, AL | 2.0 | 1.5 | 950 | $1,100 | $1.16 | 43d | 1 | 1.17mi |
| 206 Larkwood Dr SW Decatur, AL | 4.0 | 2.0 | 1630 | $1,500 | $0.92 | 43d | 1 | 1.22mi |
| 201 Bluebird Ln SW Decatur, AL | 2.0 | 1.0 | 950 | $898 | $0.94 | 43d | 11 | 1.26mi |
| 2025 Danville Park Dr SW Decatur, AL | 1.0–2.0 | 1.0–2.0 | 938 | $1,325 | $1.41 | 23d | 8 | 1.29mi |
| 609 7th Ave SW Decatur, AL | 4.0 | 2.0 | 1380 | $1,425 | $1.03 | 43d | 1 | 1.48mi |
Listing history 13 events
-
2026-06-15status $165,000 Pending 14 DOM
-
2026-06-15days on market $165,000 Active 14 DOM
-
2026-06-14days on market $165,000 Active 12 DOM
-
2026-06-13days on market $165,000 Active 11 DOM
-
2026-06-10days on market $165,000 Active 9 DOM
-
2026-06-09days on market $165,000 Active 8 DOM
-
2026-06-08days on market $165,000 Active 7 DOM
-
2026-06-07days on market $165,000 Active 6 DOM
-
2026-06-05days on market $165,000 Active 3 DOM
-
2026-06-03days on market $165,000 Active 2 DOM
-
2026-06-03remarks 62-char remark
-
2026-06-02remarks 42-char remark
-
2026-06-02$165,000 Active 1 DOM
ⓘ Source: listings_history table (triggers on properties + properties_extension) + one-shot
backfill from property_details.listing_events for pre-trigger history.
Tax reassessment forecast AL · Resets to sale price
- Current annual tax
- $456 · $38/mo
- Projected year-2 tax
- $677 · $56/mo
- Expected delta
- +$221/yr (+$18/mo · 48.4%)
ⓘ Screening estimate from a state-policy table — verify with the county assessor before closing.
Climate risk First Street
- Flood 1/10 Low FEMA zone X (unshaded) · 0% chance over 30 yrs
- Wildfire 2/10 Low
- Heat 6/10 Major 7 d/yr ≥106°F today · 19 d/yr by 30 yrs out
- Wind 4/10 Moderate 22% chance of damaging wind over 30 yrs
- Air quality 2/10 Low 1 unhealthy d/yr today · 1 by 30 yrs out
Nearby sold comps map
Loading sold comps map…
Walkable amenities ~0.75 mi
Loading nearby amenities…
Taxation est. · year 1
- Rental income
- $16,911
- − Mortgage interest
- −$9,243
- − Property taxes
- −$456
- − Insurance
- −$825
- − Repairs & maintenance
- −$1,353
- − Management
- −$1,353
- − Depreciation
- −$4,800
- Taxable loss
- −$1,118
- Est. tax savings @ 24.0%
- +$268
- After-tax cash flow
- $1,964/yr
For passive investors: Depreciation is non-cash, so a rental often shows a tax loss while cash-flowing — sheltering income. Rental losses are passive: they offset passive income freely, and up to $25,000/yr can offset ordinary (W-2) income if you actively participate and your MAGI is under $100k (phasing out to $0 by $150k); unused losses carry forward. On sale, claimed depreciation is recaptured at up to 25%, and gains may owe capital-gains tax (a 1031 exchange can defer both). Figures are a year-1 estimate at your 24.0% rate — not tax advice; consult a CPA.
Schools (NCES district)
- District
- Decatur City
- NCES district ID
- 0101170
- Math proficiency
- 22% ▼ -27.00%
- Reading proficiency
- 40% ▼ -1.00%
- Median HH income
- $42,170
- Composite
- 26.21/100
- National rank
- #7261
- State rank
- #66 of 129 in AL
Livability — Decatur
- Score
- 72/100
- State rank
- #28
- US rank
- #5989
Category grades
Schools grade is shown separately in the Schools card above.
Census & demographics
- Census place
- Decatur, AL
- County
- Morgan County · 67,628 people
- City population
- 67,628
- Metro
- Decatur, AL
- Population (ZIP)
- 35,449
- Household income
- $51,429
- Rent vs Own
- Severe rent burden
- 1386.0
Population outlook (Morgan County) Hauer SSP2
- Today (2025)
- 118,775 people
- By 2030
- 116,979 · -1.5%
- By 2040
- 111,800 · -5.9%
- By 2050
- 105,181 · -11.4%
- By 2075
- 87,736 · -26.1%
- By 2100
- 67,624 · -43.1%
Race, ethnicity, and origin ACS 2023
- Neighborhood character
- Diverse neighborhood (Simpson 0.66)
- Race & ethnicity
- White 47% Hispanic / Latino 24% Black 24% Two or more races 10% Native American 2%
- Hispanic origin (detail)
- Mexican 15% Puerto Rican 2%
- Common ancestry
- Slovak 1% Italian 1% Lithuanian 1%
- Foreign-born
- 10% · Canada
- Languages at home
- 81% English-only · Spanish 18%
Political lean MEDSL · Morgan
- 2024 margin
- Solid R (+52.6) · D 23.2% · R 75.8%
- 2008→2024 swing
- -8.8pp toward R · 2008: -43.8pp · 2024: -52.6pp
- All cycles
- 2024: R+52.6 2020: R+49.2 2016: R+52.4 2012: R+44.5 2008: R+43.8
Not yet ingested
- Civics
- —
Market trends
- HPI YoY
- ▼ -89.26%
- Current HPI
- 247.8437
- Rent YoY
- ▲ 4.67%
- Metro
- Decatur, AL
- State GDP YoY
- ▲ 2.94%
- F500 in state
- 4
Industry mix (Fortune 500 HQ in AL)
| Industry | F500 HQs | Revenue |
|---|---|---|
| Financial Services | 1 | $8B |
|
||
| Healthcare | 1 | $5B |
|
||
Price history
+122.5% since first listed2 events — show timeline
- 2026-06-01 Listed $165,000 VMLS
- 2003-09-02 Sold (Public Records) $74,150 Public Records
Property tax history
+2.9%/yrLatest (2025): $456 · +11.7% YoY. Source: county tax records.
Cash-flow waterfall
monthlySold comps — $/sqft
last 12 mo · ≤1 miLoading sold comps…