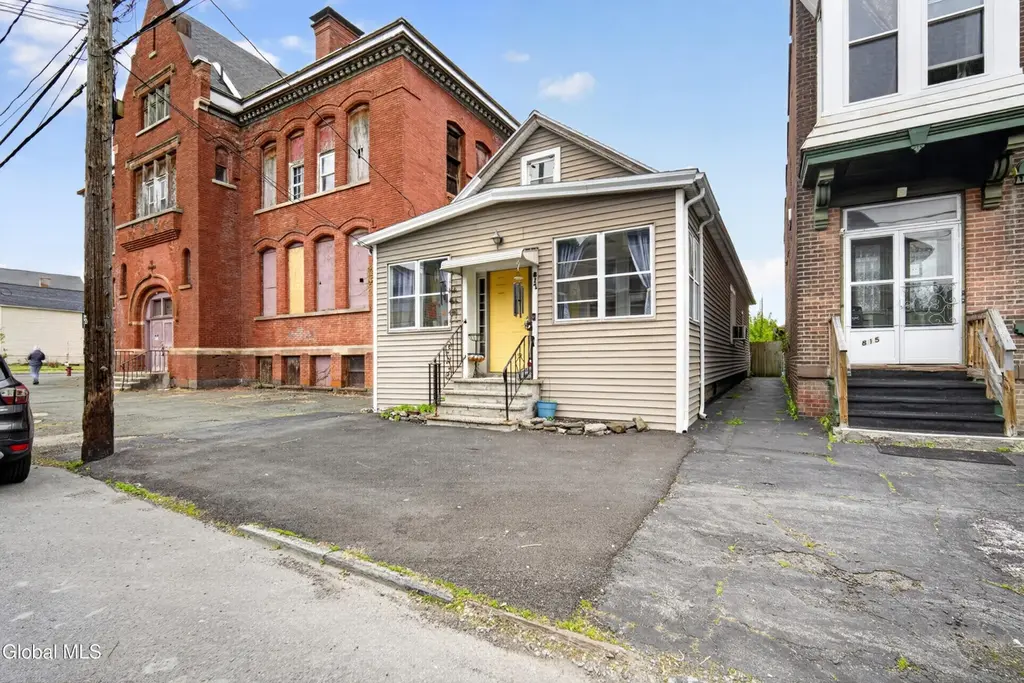
817 24th St · Watervliet, NY
Flood risk 1/10 · Minimal
- FEMA flood zone
- X (unshaded)
- Chance of flooding over 30 yrs
- 0.0%
- Est. flood insurance / yr
- $473 – $860
Fire risk 1/10 · Minimal
- Est. fire insurance / yr
- $691 – $1,283
Heat risk 4/10 · Minor
- Hot days now (above 98°F)
- 7 days/yr
- Hot days in 30 yrs
- 17 days/yr
Wind risk 3/10 · Minor
- Chance of severe wind over 30 yrs
- 6.0%
Air-quality risk 2/10 · Minimal
- Unhealthy air days now
- 0 days/yr
- Unhealthy air days in 30 yrs
- 1 days/yr
Risk factors via First Street. Map © Google.
Why this score? — see what drove the C+ grade
The composite is a weighted blend of 9 inputs, each scored 0–100. Each bar is that input's sub-score; the figure is the points it added to the 100-point composite (weight × sub-score).
- Cash flow +21.5/30.0
- ARV discount +15.0/15.0
- DSCR +6.9/10.0
- 1% rule +5.5/10.0
- Rent growth +4.2/5.0
- Livability +4.2/5.0
- Schools +3.4/10.0
- Condition / age +2.5/5.0
- Appreciation +0.0/10.0
$174,900
🖨 Deal sheet 📄 Offer letter ✓ Due diligence
Listing remarks MLS
-- Good Condition
Key facts
- Flexible space
- Walk-up attic access
- Laundry room
Tags
Property features AI
Exterior
- Utilities: Public water; Public sewer
- Home design: Single-family residence; Two-story with main living on the first floor
- Construction: Vinyl siding; Shingle (asphalt) roof; Unfinished basement
- Exterior features: Front porch; Enclosed porch; Back yard fencing; Level, cleared lot
Interior
- Kitchen: Range; Microwave; Refrigerator
- Bedrooms: Three first-floor bedrooms
- Flooring: Hardwood; Laminate; Linoleum
- Bathrooms: One full bathroom on the first floor
- Heating & cooling: Baseboard hot water heating (natural gas); Window air conditioning units
- Interior features: Enclosed front porch (3-seasons room); Living room; Dining room; Bonus room (second level); Attic
- Laundry & utility: Main-level laundry room; Washer included
Neighborhood map
What this means for you Summary
Snapshot
- This is a 3-bed/1.0-bath single-family listed at $175k.
Deal economics
- At list price, monthly cash flow is $263 ($3k/yr) — positive.
- The deal already cash-flows at list — no discount required.
- Meets the 1% rule at list price ($2k rent vs $175k).
- Recommended offer: $172k (1.5% below list) — sets the bar for market timing.
- Cap rate 8.1% vs local median 5.9% in Watervliet — top-decile yield for the area; either an underpriced asset or a hidden risk that comps aren't pricing in. Stress-test before assuming the spread holds.
Location & tenants
- Location reads 84/100 on livability (#51 in NY, #786 nationally) — a professional / high-income tenant draw. Strengths: amenities A+, housing A+, health & safety A+; Watch: crime D+, schools D.
- Watervliet City School District (suburban): math 36% / reading 45% proficiency, ranked #524 of 590 in NY (top 89%) — families likely to look elsewhere, expect single-tenant / working-renter base with shorter leases.
- Market conditions: Rents rising fast (+6.6%/yr); 72 active listings in the ZIP; 40 comparable units currently listed for rent nearby; rentals at typical pace (median 19d on market — plan ~3-4 weeks tenant-placement turnaround); 675 units permitted in Albany County in 2024 (451 in 5+ unit buildings).
- This rent runs 34% of the median local income ($65k/yr) — at the standard rent-burdened threshold; future hikes will face affordability resistance.
Forward outlook
- Local home prices are declining (-3.0%/yr); year-one equity from $1k of loan paydown is wiped out by about $5k of value loss. Plan a longer hold.
- Albany County population projected at +9% by 2050 — modest demand growth; plan on rents tracking national, not racing it.
- At projected returns (-3.0% appreciation + 6.6% rent growth), your $49k cash investment doubles in ~10 years — after that, you're playing with house money.
Negotiation context
- It's been on market 18 days — a 2% lower offer ($172k) is reasonable based on typical stale-listing flexibility.
- 2 sale attempts since 26y ago with the ask held roughly flat each time — persistent listings suggest the price (not the market) is what's stuck; bring a comps-based counter.
Risks & watch-outs
- Watch-outs: built in 1910 — expect roof / HVAC / electrical / plumbing capex.
Questions for the listing agent
- Built in 1910 — when were the roof, HVAC, electrical panel, plumbing, and water heater last replaced?
- Is there a deadline driving the sale (1031 exchange, divorce, estate, relocation)? That informs how much negotiation room exists.
- Schools are D-rated, which usually means shorter tenancies and higher turnover. Who's the typical renter profile here, and what's been the actual vacancy rate?
- Crime grade is D in this area — have there been break-ins, vandalism, or insurance claims at this property in the last 3 years? What carrier currently insures it and at what premium?
- What's the average days-on-market for RENTAL listings here right now (not sales)? A rising rental-DOM trend means longer vacancies and softer asking-rent achievability than the comps imply.
- What's the recent tenant-quality profile in this submarket — average credit score on applications, eviction rate, late-payment / NSF rate, and stable-employment percentage? A property-management company in the area should have these aggregated.
- How much new for-sale + rental construction is in the pipeline within 1–3 miles? Heavy new supply typically softens prices + rents 12–24 months out; constrained supply supports both.
Investment metrics
- 1% rule
- 1.05% ✓
- Cap rate
- 8.10%
- Cash-on-cash
- 6.46%
- DSCR
- 1.29
- GRM
- 7.9
CMA / ARV
- ARV (median comp)
- $256,068
- List price
- $174,900
- Delta
- -31.70%
- Verdict
- UNDERPRICED
- Comps
- 20 within 1.0 mi
Show comp detail 12 sales within ~0.75 mi
| Address | Dist | Beds/Ba | Sqft | Sold | Price | $/sf | Match |
|---|---|---|---|---|---|---|---|
| 2422 9th Ave | 0.04mi | 3/1.5 | 1,260 (-3%) | 9mo | $248,000 | $197 | 84 |
| 1925 8th Ave | 0.15mi | 3/1.5 | 1,432 (+10%) | 1mo | $208,050 | $145 | 73 |
| 2314 Broadway | 0.46mi | 3/1.5 | 1,324 (+2%) | 3mo | $260,000 | $196 | 71 |
| 2321 10th Ave | 0.13mi | 2/2.0 (-1) | 1,136 (-12%) | 2mo | $235,000 | $207 | 63 |
| 1621 12th Ave | 0.41mi | 3/1.0 | 1,420 (+9%) | 10mo | $335,000 | $236 | 57 |
| 1408 10th Ave | 0.55mi | 3/1.0 | 1,412 (+9%) | 7mo | $127,000 | $90 | 54 |
| 3 Lafayette St | 0.75mi | 3/1.0 | 1,406 (+8%) | 0mo | $240,000 | $171 | 51 |
| 1503 4th Ave | 0.60mi | 2/1.0 (-1) | 1,262 (-3%) | 13mo | $155,000 | $123 | 51 |
| 20 Eastern Ave | 0.67mi | 3/1.0 | 1,382 (+6%) | 9mo | $289,000 | $209 | 51 |
| 1321 6th Ave | 0.68mi | 2/1.0 (-1) | 1,224 (-6%) | 7mo | $220,000 | $180 | 48 |
| 201 15th St | 0.65mi | 3/2.0 | 1,116 (-14%) | 3mo | $225,000 | $202 | 39 |
| 11 Western Ave | 0.69mi | 3/1.0 | 1,116 (-14%) | 11mo | $270,000 | $242 | 35 |
Match score weights: distance 35% · size 25% · config 20% · recency 20%. Top-matched comps best support the ARV.
Projected returns pro-forma
-3.0% appreciation · 6.61% rent growth · sell at horizon
- IRR
- -2.4%
- Equity multiple
- 0.91×
- Total profit
- $-4,620
- Equity at exit
- $26,078
- IRR
- 10.8%
- Equity multiple
- 1.99×
- Total profit
- $48,263
- Equity at exit
- $15,122
Cash invested: $48,972 (down + closing). Projections, not guarantees.
Landlord ↔ Tenant lean methodology
- Overall (STATE)
- 15 Strongly Tenant-Friendly
- State New York
- 15 Strongly Tenant-Friendly · D+10
- County
- — inherits STATE
- City
- — inherits STATE
ZIP-level market 12189
- Home prices YoY
- -28.7%
- Rents YoY
- 6.6%
- Active inventory
- 72
- Price-to-rent
- 7.9×
Monthly cashflow live
- Estimated rent
- $1,840 high interval (Pro) →
- Mortgage (P&I)
- −$917
- Tax from tax record
- −$200 /mo · $2,402/yr
- Insurance
- −$73
- HOA
- −$0
- Vacancy / Maint / Mgmt
- −$386
- Net cashflow
- $263
Break-even live
UW: 25.0% down · 7.5% · 30yr · 1.5% tax · 5.0% vac · 8.0% maint · 8.0% mgmt
Financing live
Cash to close
- Down payment
- $43,725
- Closing costs
- $5,247
- Reserves months
- —
- Total cash needed
- —
Loan-product check · same deal, 3 products live
Conventional
25% down · 7.5% · 30yr
- Down + closing
- —
- Monthly P&I
- —
- Monthly cashflow
- —
- DSCR
- —
- Eligible?
- —
Personal DTI + credit; lowest rate.
DSCR
20% down · 8.5% · 30yr
- Down + closing
- —
- Monthly P&I
- —
- Monthly cashflow
- —
- DSCR
- —
- Eligible?
- —
No personal income docs; deal must DSCR.
Hard money
10% down · 12.0% · 12mo
- Down + closing
- —
- Monthly P&I
- —
- Monthly cashflow
- —
- DSCR
- —
- Eligible?
- —
Short-term bridge; refi at stabilization.
Rent comps 40 comps
| Address | Beds | Baths | Sqft | Rent | $/sqft | DOM | Units | Dist |
|---|---|---|---|---|---|---|---|---|
| 2413 6th Ave Unit 1 Watervliet, NY | 2.0 | 1.0 | 900 | $1,550 | $1.72 | 43d | 1 | 0.15mi |
| 2327 12th Ave Unit 1 Watervliet, NY | 2.0 | 1.0 | 1000 | $1,500 | $1.50 | 43d | 1 | 0.25mi |
| 13 Fenimore Trace Apartments Watervliet, NY | 1.0–2.0 | 1.0–2.0 | 827 | $1,785 | $2.16 | 14d | 1 | 0.42mi |
| 5 Alden St Watervliet, NY | 2.0 | 1.0 | 1000 | $1,299 | $1.30 | 18d | 1 | 0.48mi |
| 5 Alden St Unit b Watervliet, NY | 2.0 | 1.0 | 1100 | $1,299 | $1.18 | 43d | 1 | 0.48mi |
| 1534 5th Ave #1 Watervliet, NY | 3.0 | 1.0 | 1200 | $1,595 | $1.33 | 43d | 1 | 0.55mi |
| 1417 7th Ave Unit 2 Watervliet, NY | 2.0 | 1.0 | 1000 | $2,200 | $2.20 | 14d | 1 | 0.59mi |
| 1513 5th Ave Unit 2 Watervliet, NY | 3.0 | 1.0 | 1200 | $1,550 | $1.29 | 14d | 1 | 0.59mi |
| 155 River St Unit 3C Troy, NY | 2.0 | 1.0 | 1100 | $2,000 | $1.82 | 14d | 1 | 0.78mi |
| 155 River St Unit 5D Troy, NY | 2.0 | 1.0 | 900 | $2,000 | $2.22 | 43d | 1 | 0.78mi |
| 209 13th St Watervliet, NY | 4.0 | 1.0 | 1100 | $1,700 | $1.55 | 43d | 1 | 0.81mi |
| 17 State St Troy, NY | 4.0 | 1.0–1.5 | 1810 | $2,996 | $1.66 | 14d | 7 | 0.88mi |
| 22 13th St Watervliet, NY | 2.0 | 1.5 | 900 | $1,600 | $1.78 | 43d | 1 | 0.89mi |
| 53-55 Congress St Troy, NY | 2.0 | 1.0 | 1500 | $1,700 | $1.13 | 23d | 1 | 0.93mi |
| 65 3rd St Troy, NY | 2.0 | 2.0 | 1185 | $2,995 | $2.53 | 23d | 1 | 0.95mi |
| 2 River St Troy, NY | 2.0 | 1.0–2.5 | 945 | $2,650 | $2.80 | 14d | 6 | 1.00mi |
| 104 4th St Unit 2 Troy, NY | 3.0 | 1.0 | 950 | $1,800 | $1.89 | 14d | 1 | 1.03mi |
| 151 4th St Troy, NY | 4.0 | 1.0 | 1000 | $1,400 | $1.40 | 23d | 1 | 1.04mi |
| 2001 5th Ave Troy, NY | 2.0 | 1.0–2.0 | 865 | $2,650 | $3.06 | 14d | 10 | 1.06mi |
| 2002 Federal St Troy, NY | 2.0 | 1.0–2.0 | 830 | $3,450 | $4.16 | 14d | 51 | 1.08mi |
| 23 Lake Shore Dr Watervliet, NY | 1.0–3.0 | 1.0–2.0 | 911 | $2,280 | $2.50 | 14d | 17 | 1.13mi |
| 1611 6th Ave Troy, NY | 1.0–2.0 | 1.0–2.0 | 976 | $3,000 | $3.07 | 14d | 28 | 1.14mi |
| 1520 6th Ave Troy, NY | 2.0–4.0 | 2.0–4.0 | 1209 | $1,224 | $1.01 | 23d | 8 | 1.18mi |
| 124 Ferry St Troy, NY | 1.0–3.0 | 1.0–2.0 | 814 | $2,799 | $3.44 | 14d | 10 | 1.18mi |
| 306 3rd St Troy, NY | 3.0 | 1.0 | 1100 | $1,700 | $1.55 | 23d | 1 | 1.27mi |
| 323 2nd St #1 Troy, NY | 2.0 | 1.0 | 1150 | $1,950 | $1.70 | 23d | 1 | 1.30mi |
| 238 8th St Troy, NY | 3.0 | 2.0 | 1200 | $2,200 | $1.83 | 23d | 1 | 1.31mi |
| 334 4th St Troy, NY | 2.0 | 1.0 | 1200 | $1,550 | $1.29 | 23d | 1 | 1.31mi |
| 904 Peoples Ave Troy, NY | 4.0 | 1.0 | 1800 | $645 | $0.36 | 18d | 1 | 1.34mi |
| 355 4th St Troy, NY | 3.0 | 2.0 | 1203 | $1,750 | $1.45 | 23d | 1 | 1.35mi |
| 136 9th St Unit 3 Troy, NY | 4.0 | 1.0 | 1500 | $595 | $0.40 | 18d | 1 | 1.35mi |
| 809 Broadway #2 Watervliet, NY | 3.0 | 1.0 | 1100 | $1,625 | $1.48 | 43d | 1 | 1.35mi |
| 136 9th St Unit 2 Troy, NY | 3.0 | 1.0 | 1500 | $600 | $0.40 | 18d | 1 | 1.35mi |
| 136 9th St Unit 1 Troy, NY | 3.0 | 1.0 | 1500 | $595 | $0.40 | 18d | 1 | 1.35mi |
| 164 9th St Unit 1 Troy, NY | 4.0 | 2.0 | 1400 | $1,800 | $1.29 | 23d | 1 | 1.37mi |
| 195 9th St Troy, NY | 3.0 | 2.0 | 1500 | $750 | $0.50 | 18d | 1 | 1.38mi |
| 356 3rd St Unit 2 Troy, NY | 3.0 | 1.0 | 1000 | $1,950 | $1.95 | 14d | 1 | 1.39mi |
| 196 10th St Troy, NY | 3.0 | 1.0 | 1200 | $695 | $0.58 | 18d | 1 | 1.40mi |
| 363 1st St Troy, NY | 3.0 | 2.5 | 1408 | $2,100 | $1.49 | 14d | 1 | 1.40mi |
| 363 1st St Troy, NY | 3.0 | 2.5 | 1408 | $2,100 | $1.49 | 21d | 1 | 1.40mi |
Listing history 10 events
-
2026-06-01statusdays on market $174,900 Pending 18 DOM
-
2026-05-31days on market $174,900 Contingent 17 DOM
-
2026-05-31days on market $174,900 Contingent 16 DOM
-
2026-05-14$174,900 Active 579-char remark
-
2024-11-04soldstatus $210,000
-
2020-12-23soldstatus $140,000
-
2001-08-03soldstatus $43,440
-
2001-08-01soldstatus $50,000 17-char remark
Show marketing remark (17 chars)
-- Good Condition
-
2001-06-13historical 17-char remark
Show marketing remark (17 chars)
-- Good Condition
-
2000-11-21$49,900 17-char remark
Show marketing remark (17 chars)
-- Good Condition
ⓘ Source: listings_history table (triggers on properties + properties_extension) + one-shot
backfill from property_details.listing_events for pre-trigger history.
Tax reassessment forecast NY · Partial reset (capped growth)
- Current annual tax
- $2,402 · $200/mo
- Projected year-2 tax
- $2,679 · $223/mo
- Expected delta
- +$277/yr (+$23/mo · 11.5%)
ⓘ Screening estimate from a state-policy table — verify with the county assessor before closing.
Climate risk First Street
- Flood 1/10 Low FEMA zone X (unshaded) · 0% chance over 30 yrs
- Wildfire 1/10 Low
- Heat 4/10 Moderate 7 d/yr ≥98°F today · 17 d/yr by 30 yrs out
- Wind 3/10 Moderate 6% chance of damaging wind over 30 yrs
- Air quality 2/10 Low 0 unhealthy d/yr today · 1 by 30 yrs out
Nearby sold comps map
Loading sold comps map…
Walkable amenities ~0.75 mi
Loading nearby amenities…
Taxation est. · year 1
- Rental income
- $22,081
- − Mortgage interest
- −$9,797
- − Property taxes
- −$2,402
- − Insurance
- −$874
- − Repairs & maintenance
- −$1,767
- − Management
- −$1,767
- − Depreciation
- −$5,088
- Taxable income
- $387
- Est. tax owed @ 24.0%
- −$93
- After-tax cash flow
- $3,069/yr
For passive investors: Depreciation is non-cash, so a rental often shows a tax loss while cash-flowing — sheltering income. Rental losses are passive: they offset passive income freely, and up to $25,000/yr can offset ordinary (W-2) income if you actively participate and your MAGI is under $100k (phasing out to $0 by $150k); unused losses carry forward. On sale, claimed depreciation is recaptured at up to 25%, and gains may owe capital-gains tax (a 1031 exchange can defer both). Figures are a year-1 estimate at your 24.0% rate — not tax advice; consult a CPA.
Schools (NCES district)
- District
- Watervliet City School District
- NCES district ID
- 3630210
- Math proficiency
- 36% ▼ -2.00%
- Reading proficiency
- 45% ▬ 0.00%
- Median HH income
- $43,276
- Composite
- 34.23/100
- National rank
- #5261
- State rank
- #524 of 590 in NY
Livability — Watervliet
- Score
- 84/100
- State rank
- #51
- US rank
- #786
Category grades
Schools grade is shown separately in the Schools card above.
Census & demographics
- Census place
- Watervliet, NY
- County
- Albany County · 196,626 people
- City population
- 18,656
- Metro
- Albany-Schenectady-Troy, NY
- Population (ZIP)
- 18,656
- Household income
- $65,276
- Rent vs Own
- Severe rent burden
- 1224.0
Population outlook (Albany County) Hauer SSP2
- Today (2025)
- 320,794 people
- By 2030
- 327,401 · +2.1%
- By 2040
- 338,218 · +5.4%
- By 2050
- 348,467 · +8.6%
- By 2075
- 381,693 · +19.0%
- By 2100
- 393,809 · +22.8%
Race, ethnicity, and origin ACS 2023
- Neighborhood character
- Predominantly White (72%)
- Race & ethnicity
- White 72% Two or more races 8% Asian 8% Black 8% Hispanic / Latino 6%
- Hispanic origin (detail)
- Mexican 2% Puerto Rican 2% Dominican 1%
- Common ancestry
- Lithuanian 6% Romanian 5% Scotch-Irish 4%
- Foreign-born
- 11% · Canada, China, South Korea
- Languages at home
- 88% English-only · Other Indo-European 4% Spanish 2% Other Asian/Pacific 2%
Political lean MEDSL · Albany
- 2024 margin
- Strong D (+25.8) · D 62.9% · R 37.1%
- 2008→2024 swing
- -3.6pp toward R · 2008: 29.4pp · 2024: 25.8pp
- All cycles
- 2024: D+25.8 2020: D+31.4 2016: D+24.3 2012: D+31.0 2008: D+29.4
Not yet ingested
- Civics
- —
Market trends
- HPI YoY
- ▼ -110.16%
- Current HPI
- 273.8109
- Rent YoY
- ▲ 6.61%
- Metro
- Albany-Schenectady-Troy, NY
- State GDP YoY
- ▲ 2.60%
- F500 in state
- 92
Industry mix (Fortune 500 HQ in NY)
| Industry | F500 HQs | Revenue |
|---|---|---|
| Financial Services | 10 | $950B |
|
||
| Consumer Goods | 9 | $162B |
|
||
| Insurance | 4 | $225B |
|
||
| Telecommunications | 2 | $144B |
|
||
| Pharmaceuticals | 2 | $112B |
|
||
| Media / Entertainment | 2 | $69B |
|
||
Price history
+250.5% since first listed9 events — show timeline
- 2026-06-01 Pending — Global MLS
- 2026-05-27 Contingent — Global MLS
- 2026-05-14 Listed $174,900 Global MLS
- 2024-11-04 Sold (Public Records) $210,000 Public Records
- 2020-12-23 Sold (Public Records) $140,000 Public Records
- 2001-08-03 Sold (Public Records) $43,440 Public Records
- 2001-08-01 Sold (MLS) $50,000 Global MLS
- 2001-06-13 Listing Removed — Global MLS
- 2000-11-21 Listed $49,900 Global MLS
Property tax history
+1.1%/yrLatest (2025): $2,402 · +3.9% YoY. Source: county tax records.
Cash-flow waterfall
monthlySold comps — $/sqft
last 12 mo · ≤1 miLoading sold comps…