53 Helm Rd Rd · Oxford, AR
Flood risk 1/10 · Minimal
- FEMA flood zone
- —
- Chance of flooding over 30 yrs
- 0.0%
- Est. flood insurance / yr
- —
Fire risk 7/10 · Major
- Est. fire insurance / yr
- $1,499 – $2,785
Heat risk 4/10 · Minor
- Hot days now (above 108°F)
- 7 days/yr
- Hot days in 30 yrs
- 19 days/yr
Wind risk 2/10 · Minimal
- Chance of severe wind over 30 yrs
- 3.0%
Air-quality risk 1/10 · Minimal
- Unhealthy air days now
- 0 days/yr
- Unhealthy air days in 30 yrs
- 0 days/yr
Risk factors via First Street. Map © Google.
Why this score? — see what drove the D grade
The composite is a weighted blend of 9 inputs, each scored 0–100. Each bar is that input's sub-score; the figure is the points it added to the 100-point composite (weight × sub-score).
- Cash flow +11.5/30.0
- ARV discount +7.5/15.0
- Appreciation +5.0/10.0
- DSCR +3.4/10.0
- 1% rule +3.3/10.0
- Livability +2.7/5.0
- Rent growth +2.5/5.0
- Condition / age +2.5/5.0
- Schools +2.3/10.0
$135,000
🖨 Deal sheet (PDF) 📄 Offer letter ✓ Due diligence
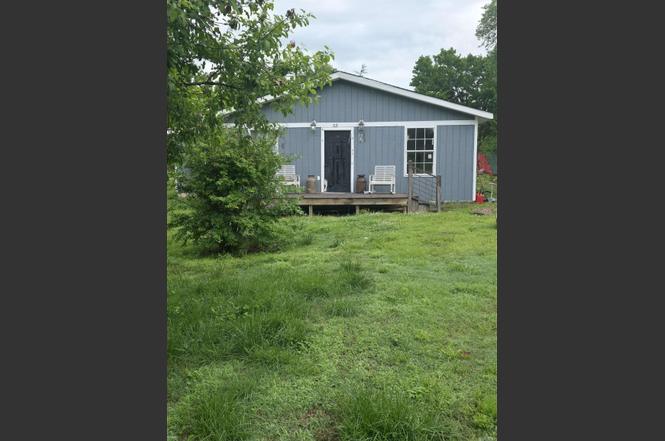
Listing remarks
Welcome to the market this cozy 3 bedroom, 2 bath house sitting on 2.2 acres in Oxford, Arkansas! This property provides multiple fruit trees and ample room for a garden. This house provides a spacious living room, dining room and outdoor pool area ready to entertain company no matter what the weather is! You'll find new flooring and rustic barn tin throughout the majority of the home giving it a cozy country feel! The very desired internet, NEXT powered by NAEC, is available at this location and Oxford city water/septic. One of the two bathrooms is undergoing remodeling, also leaving room for a fourth bedroom. This home is just minutes away from a local gas station, Dollar General, city
Key facts
- New floor joists
- New flooring
- Multiple fruit trees
Tags
Property features AI
Finance
- Other: Square footage source: Tax records; Acreage source: Courthouse
- Financial info: (No additional financial details provided)
- HOA & community: HOA frequency: Annual
Exterior
- Parking: (No parking details provided)
- Security: (No security details provided)
- Utilities: Public water; Septic system; Electric service via cooperative; Propane/butane gas with owned tank
- Home design: Single-family property (details on stories/entry level not specified); Approx. 1,624 total square feet; Approx. 2.2 acre lot
- Construction: 3-tab shingle roof; Crawl space foundation
- Exterior features: Masonite exterior; Paved road access; Sloped lot; Not in a subdivision; Located inside city limits
Interior
- Kitchen: Microwave; Gas range; Dishwasher; Refrigerator stays
- Bedrooms: Includes a bedroom level (details not specified)
- Flooring: Wood flooring; Luxury vinyl flooring
- Bathrooms: 2 full bathrooms
- Heating & cooling: Window air conditioning units; Gas space heater
- Interior features: Formal living room; Unfinished space
- Laundry & utility: Laundry room
Neighborhood map
What this means for you Summary
Snapshot
- This is a 3-bed/1.0-bath single-family listed at $135k.
Deal economics
- At list price, monthly cash flow is $-45 ($-539/yr) — negative.
- To cash-flow at today's rent, offer at most $128k (4.8% below list).
- To meet the 1% rule (rent ≥ 1% of price), the offer needs to be $112k (16.7% below list).
- Recommended offer: $112k (16.7% below list) — sets the bar for 1% rule.
Location & tenants
- Location reads 54/100 on livability (#418 in AR) — a working-class tenant base; expect higher turnover. Strengths: cost of living A+, housing A+; Watch: schools F, crime F, amenities F.
- Izard CountyConsolidated School District (rural): math 27% / reading 29% proficiency, ranked #171 of 238 in AR (top 72%) — low school quality limits family demand, transient renter base, plan for 1-2y turnover; 63% free/reduced lunch — lower-income household profile, screen leases tightly.
- Market conditions: 9 active listings in the ZIP; 6 units permitted in Izard County in 2024 (0 in 5+ unit buildings).
Forward outlook
- In year one you build about $5k of equity ($933 loan paydown + $4k appreciation (3.0% local appreciation)).
- Izard County population projected to shrink 8% by 2050 — rents likely to lag national; underwrite the cash flow, not the appreciation.
- At projected returns (3.0% appreciation + 3.0% rent growth), your $38k cash investment doubles in ~7 years — after that, you're playing with house money.
- By year 7, paydown + projected appreciation supports a ~$32k cash-out refi (75% LTV) — recoverable capital for the next deal without selling this one.
Negotiation context
- It's been on market 125 days — a 12% lower offer ($119k) is reasonable based on typical stale-listing flexibility.
- Current owner paid $16k; list at $135k implies a 744% gain — meaningful room to come down on a strong offer.
Risks & watch-outs
- Climate carrying-cost: major wildfire risk — expect insurance premiums to compound above CPI over the hold.
Questions for the listing agent
- What do current leases actually rent for vs. the listed asking? Can we see a recent rent roll and the last 12 months of T-12 income?
- It's been on market 125 days. Have you received any prior offers? Is the seller open to a 17% concession, seller financing, or rate buy-down credit?
- Built in 1972 — when were the roof, HVAC, electrical panel, plumbing, and water heater last replaced?
- Why hasn't it sold? Are there any deal-killer items the seller is aware of (foundation, flood, title, zoning, code violations)?
- Is there a deadline driving the sale (1031 exchange, divorce, estate, relocation)? That informs how much negotiation room exists.
- Schools are F-rated, which usually means shorter tenancies and higher turnover. Who's the typical renter profile here, and what's been the actual vacancy rate?
- Crime grade is F in this area — have there been break-ins, vandalism, or insurance claims at this property in the last 3 years? What carrier currently insures it and at what premium?
- The area grade is low — what's the realistic commute time and amenity access for the typical tenant pool here? Any planned neighborhood developments (good or bad) we should know about?
- What's the average days-on-market for RENTAL listings here right now (not sales)? A rising rental-DOM trend means longer vacancies and softer asking-rent achievability than the comps imply.
- What's the recent tenant-quality profile in this submarket — average credit score on applications, eviction rate, late-payment / NSF rate, and stable-employment percentage? A property-management company in the area should have these aggregated.
- How much new for-sale + rental construction is in the pipeline within 1–3 miles? Heavy new supply typically softens prices + rents 12–24 months out; constrained supply supports both.
Investment metrics
- 1% rule
- 0.83% ✗
- Cap rate
- 5.89%
- Cash-on-cash
- -1.43%
- DSCR
- 0.94
- GRM
- 10.0
CMA / ARV
No comps found within radius.
Projected returns pro-forma
3.0% appreciation · 3.0% rent growth · sell at horizon
- IRR
- 6.2%
- Equity multiple
- 1.35×
- Total profit
- $13,418
- Equity at exit
- $60,702
- IRR
- 9.1%
- Equity multiple
- 2.37×
- Total profit
- $51,823
- Equity at exit
- $93,549
Cash invested: $37,800 (down + closing). Projections, not guarantees.
Landlord ↔ Tenant lean methodology
- Overall (STATE)
- 92 Strongly Landlord-Friendly
- State Arkansas
- 92 Strongly Landlord-Friendly · R+14
- County
- — inherits STATE
- City
- — inherits STATE
ZIP-level market 72565
- Active inventory
- 9
- Price-to-rent
- 10.0×
Monthly cashflow live
- Estimated rent
- $1,124 medium interval (Pro) →
- Mortgage (P&I)
- −$708
- Tax est. 1.5%
- −$169 /mo · $2,025/yr
- Insurance
- −$56
- HOA
- −$0
- Vacancy / Maint / Mgmt
- −$236
- Net cashflow
- $-45
Break-even live
Sensitivity live
| Price | -10% $48 | -5% $2 | +0% $-45 | +5% $-92 | +10% $-138 |
|---|---|---|---|---|---|
| Rent | -10% $-134 | -5% $-89 | +0% $-45 | +5% $-1 | +10% $44 |
| Rate | -1.0pp $23 | -0.5pp $-11 | base $-45 | +0.5pp $-80 | +1.0pp $-115 |
UW: 25.0% down · 7.5% · 30yr · 1.5% tax · 5.0% vac · 8.0% maint · 8.0% mgmt
Financing live
Cash to close
- Down payment
- $33,750
- Closing costs
- $4,050
- Reserves months
- —
- Total cash needed
- —
Loan-product check · same deal, 3 products live
Conventional
25% down · 7.5% · 30yr
- Down + closing
- —
- Monthly P&I
- —
- Monthly cashflow
- —
- DSCR
- —
- Eligible?
- —
Personal DTI + credit; lowest rate.
DSCR
20% down · 8.5% · 30yr
- Down + closing
- —
- Monthly P&I
- —
- Monthly cashflow
- —
- DSCR
- —
- Eligible?
- —
No personal income docs; deal must DSCR.
Hard money
10% down · 12.0% · 12mo
- Down + closing
- —
- Monthly P&I
- —
- Monthly cashflow
- —
- DSCR
- —
- Eligible?
- —
Short-term bridge; refi at stabilization.
Listing history 18 events
-
2026-06-19days on market $135,000 Active 125 DOM
-
2026-06-18days on market $135,000 Active 124 DOM
-
2026-06-17days on market $135,000 Active 123 DOM
-
2026-06-16days on market $135,000 Active 122 DOM
-
2026-06-15days on market $135,000 Active 121 DOM
-
2026-06-14days on market $135,000 Active 119 DOM
-
2026-06-13days on market $135,000 Active 118 DOM
-
2026-06-09days on market $135,000 Active 115 DOM
-
2026-06-08days on market $135,000 Active 114 DOM
-
2026-06-07days on market $135,000 Active 113 DOM
-
2026-06-04days on market $135,000 Active 109 DOM
-
2026-06-02days on market $135,000 Active 108 DOM
-
2026-06-01days on market $135,000 Active 107 DOM
-
2026-05-31days on market $135,000 Active 106 DOM
-
2026-05-31days on market $135,000 Active 105 DOM
-
2026-02-13$135,000 New Listing
-
2019-07-24soldstatus $16,000
-
1999-10-08soldstatus $9,000
ⓘ Source: listings_history table (triggers on properties + properties_extension) + one-shot
backfill from property_details.listing_events for pre-trigger history.
Climate risk First Street
- Flood 1/10 Low 0% chance over 30 yrs
- Wildfire 7/10 Severe
- Heat 4/10 Moderate 7 d/yr ≥108°F today · 19 d/yr by 30 yrs out
- Wind 2/10 Low 3% chance of damaging wind over 30 yrs
- Air quality 1/10 Low 0 unhealthy d/yr today · 0 by 30 yrs out
Nearby sold comps map
Loading sold comps map…
Walkable amenities ~0.75 mi
Loading nearby amenities…
Taxation est. · year 1
- Rental income
- $13,489
- − Mortgage interest
- −$7,562
- − Property taxes
- −$2,025
- − Insurance
- −$675
- − Repairs & maintenance
- −$1,079
- − Management
- −$1,079
- − Depreciation
- −$3,927
- Taxable loss
- −$2,859
- Est. tax savings @ 24.0%
- +$686
- After-tax cash flow
- $147/yr
For passive investors: Depreciation is non-cash, so a rental often shows a tax loss while cash-flowing — sheltering income. Rental losses are passive: they offset passive income freely, and up to $25,000/yr can offset ordinary (W-2) income if you actively participate and your MAGI is under $100k (phasing out to $0 by $150k); unused losses carry forward. On sale, claimed depreciation is recaptured at up to 25%, and gains may owe capital-gains tax (a 1031 exchange can defer both). Figures are a year-1 estimate at your 24.0% rate — not tax advice; consult a CPA.
Schools (NCES district)
- District
- Izard CountyConsolidated School District
- NCES district ID
- 0500021
- Math proficiency
- 27% ▼ -15.00%
- Reading proficiency
- 29% ▼ -16.00%
- Median HH income
- $30,245
- Composite
- 22.66/100
- National rank
- #8047
- State rank
- #171 of 238 in AR
Livability — Oxford
- Score
- 54/100
- State rank
- #418
- US rank
- #23825
Category grades
Schools grade is shown separately in the Schools card above.
Census & demographics
- Census place
- Oxford, AR
- Population (ZIP)
- 1,253
Population outlook (Izard County) Hauer SSP2
- Today (2025)
- 13,018 people
- By 2030
- 12,761 · -2.0%
- By 2040
- 12,331 · -5.3%
- By 2050
- 12,041 · -7.5%
- By 2075
- 11,516 · -11.5%
- By 2100
- 10,549 · -19.0%
Race, ethnicity, and origin ACS 2023
- Neighborhood character
- Predominantly White (89%)
- Race & ethnicity
- White 89% Two or more races 8% Asian 3%
- Common ancestry
- Romanian 2% Italian 1% Serbian 1%
- Foreign-born
- 1%
- Languages at home
- 99% English-only · Spanish 1% Korean 1%
Political lean MEDSL · Izard
- 2024 margin
- Solid R (+65.9) · D 16.0% · R 81.9% · Other 2.1%
- 2008→2024 swing
- -39.1pp toward R · 2008: -26.9pp · 2024: -65.9pp
- All cycles
- 2024: R+65.9 2020: R+62.1 2016: R+54.3 2012: R+37.8 2008: R+26.9
Not yet ingested
- Civics
- —
Market trends
- HPI YoY
- —
- Current HPI
- —
- Rent YoY
- —
- Metro
- —
- State GDP YoY
- ▲ 3.80%
- F500 in state
- 10
Industry mix (Fortune 500 HQ in AR)
| Industry | F500 HQs | Revenue |
|---|---|---|
| Retail | 1 | $681B |
|
||
| Food / Agriculture | 1 | $53B |
|
||
| Retail / Energy | 1 | $22B |
|
||
| Transportation / Logistics | 1 | $12B |
|
||
| Energy | 1 | $4B |
|
||
Price history
+1400.0% since first listed3 events — show timeline
- 2026-02-13 Listed $135,000 CARMLS
- 2019-07-24 Sold (Public Records) $16,000 Public Records
- 1999-10-08 Sold (Public Records) $9,000 Public Records
Property tax history
-1.2%/yrLatest (2018): $204 · +0.0% YoY. Source: county tax records.
Cash-flow waterfall
monthlySold comps — $/sqft
last 12 mo · ≤1 miLoading sold comps…