 🏗️ New Construction
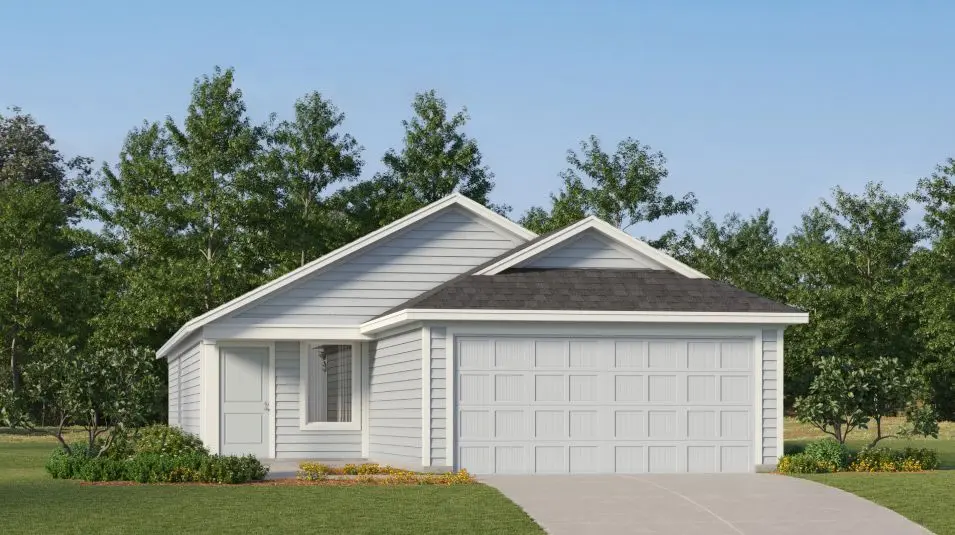
Kitson Plan · Princeton, TX
Flood risk 1/10 · Minimal
- FEMA flood zone
- X (unshaded)
- Chance of flooding over 30 yrs
- 0.0%
- Est. flood insurance / yr
- $507 – $1,088
Fire risk 4/10 · Minor
- Est. fire insurance / yr
- $1,222 – $2,270
Heat risk 7/10 · Major
- Hot days now (above 111°F)
- 7 days/yr
- Hot days in 30 yrs
- 24 days/yr
Wind risk 6/10 · Moderate
- Chance of severe wind over 30 yrs
- 27.0%
Air-quality risk 3/10 · Minor
- Unhealthy air days now
- 3 days/yr
- Unhealthy air days in 30 yrs
- 3 days/yr
Risk factors via First Street. Map © Google.
Why this score? — see what drove the F grade
The composite is a weighted blend of 9 inputs, each scored 0–100. Each bar is that input's sub-score; the figure is the points it added to the 100-point composite (weight × sub-score).
- ARV discount +7.5/15.0
- Cash flow +7.1/30.0
- Schools +4.2/10.0
- Livability +3.1/5.0
- Condition / age +2.5/5.0
- Rent growth +2.2/5.0
- 1% rule +2.0/10.0
- DSCR +1.3/10.0
- Appreciation +0.0/10.0
$245,999
🖨 Deal sheet (PDF) 📄 Offer letter ✓ Due diligence
Listing remarks MLS
This single-level home showcases a spacious open floorplan shared between the kitchen, dining area and family room for easy entertaining during gatherings. An owner's suite enjoys a private location in a rear corner of the home, complemented by an en-suite bathroom and walk-in closet. There are two secondary bedrooms along the side of the home, which are comfortable spaces for household members and overnight guests.
Key facts
- 2 garage spots
- Listed 600 days
Neighborhood map
What this means for you Summary
Snapshot
- This is a 3-bed/2.0-bath single-family listed at $246k.
Deal economics
- At list price, monthly cash flow is $-400 ($-5k/yr) — negative.
- To cash-flow at today's rent, offer at most $227k (7.7% below list).
- To meet the 1% rule (rent ≥ 1% of price), the offer needs to be $199k (19.2% below list).
- Recommended offer: $199k (19.2% below list) — sets the bar for 1% rule.
Location & tenants
- Location reads 62/100 on livability (#969 in TX) — a middle-class / working-renter tenant base. Strengths: employment A+, housing A+, cost of living A; Watch: amenities F, commute F, health & safety F.
- Princeton ISD (suburban): math 51% / reading 47% proficiency, ranked #188 of 826 in TX (top 23%) — families likely to look elsewhere, expect single-tenant / working-renter base with shorter leases.
- Zoned schools: Lacy El (math 44% / reading 44%, grade F, #1,243 of 4,322 statewide, top 29%, 670 students, 59% FRL); Clark Middle (math 53% / reading 42%, grade C-, #408 of 1,662 statewide, top 25%, 707 students, 66% FRL); Princeton H S (math 52% / reading 54%, grade C-, #437 of 1,632 statewide, top 27%, 1,521 students, 57% FRL) — zoned schools at 61% FRL track the district average.
- Market conditions: Rents soft (-1.0%/yr); 1410 active listings in the ZIP; 40 comparable units currently listed for rent nearby; rentals at typical pace (median 21d on market — plan ~3-4 weeks tenant-placement turnaround); solid renter incomes; 19,194 units permitted in Collin County in 2024 (3,988 in 5+ unit buildings).
Forward outlook
- Local home prices are declining (-3.0%/yr); year-one equity from $2k of loan paydown is wiped out by about $9k of value loss. Plan a longer hold.
- Collin County population projected at +60% by 2050 — long-run rental-demand tailwind backs the buy-and-hold thesis.
Negotiation context
- It's been on market 600 days — a 12% lower offer ($216k) is reasonable based on typical stale-listing flexibility.
Risks & watch-outs
- Climate carrying-cost: major wind risk, 27% chance of damaging wind over 30y; extreme-heat days projected 7→24/yr by 2055 (HVAC capex compounding) — expect insurance premiums to compound above CPI over the hold.
Questions for the listing agent
- What do current leases actually rent for vs. the listed asking? Can we see a recent rent roll and the last 12 months of T-12 income?
- It's been on market 600 days. Have you received any prior offers? Is the seller open to a 19% concession, seller financing, or rate buy-down credit?
- Why hasn't it sold? Are there any deal-killer items the seller is aware of (foundation, flood, title, zoning, code violations)?
- Is there a deadline driving the sale (1031 exchange, divorce, estate, relocation)? That informs how much negotiation room exists.
- The area grade is low — what's the realistic commute time and amenity access for the typical tenant pool here? Any planned neighborhood developments (good or bad) we should know about?
- What's the average days-on-market for RENTAL listings here right now (not sales)? A rising rental-DOM trend means longer vacancies and softer asking-rent achievability than the comps imply.
- What's the recent tenant-quality profile in this submarket — average credit score on applications, eviction rate, late-payment / NSF rate, and stable-employment percentage? A property-management company in the area should have these aggregated.
- How much new for-sale + rental construction is in the pipeline within 1–3 miles? Heavy new supply typically softens prices + rents 12–24 months out; constrained supply supports both.
Investment metrics
- 1% rule
- 0.70% ✗
- Cap rate
- 4.61%
- Cash-on-cash
- -6.01%
- DSCR
- 0.73
- GRM
- 12.0
CMA / ARV
- ARV (median comp)
- $284,966
- List price
- $245,999
- Delta
- -13.67%
- Verdict
- UNDERPRICED
- Comps
- 20 within 1.0 mi
Show comp detail 12 sales within ~0.75 mi
| Address | Dist | Beds/Ba | Sqft | Sold | Price | $/sf | Match |
|---|---|---|---|---|---|---|---|
| 1024 Calley Pear Trl | 0.32mi | 3/2.0 | 1,402 (0%) | 2mo | $217,724 | $155 | 83 |
| 1036 Calley Pear Trl | 0.31mi | 3/2.0 | 1,402 (0%) | 6mo | $223,899 | $160 | 80 |
| 1016 Calley Pear Trl | 0.33mi | 3/2.0 | 1,411 (+1%) | 4mo | $222,324 | $158 | 80 |
| 1000 Calley Pear Trl | 0.35mi | 3/2.0 | 1,402 (0%) | 5mo | $218,724 | $156 | 80 |
| 1004 Calley Pear Trl | 0.34mi | 3/2.0 | 1,411 (+1%) | 4mo | $223,324 | $158 | 79 |
| 1037 Calley Pear Trl | 0.34mi | 3/2.0 | 1,402 (0%) | 6mo | $251,749 | $180 | 78 |
| 912 Calley Pear Trl | 0.37mi | 3/2.0 | 1,402 (0%) | 6mo | $230,774 | $165 | 77 |
| 1009 Mesquite Ln | 0.48mi | 3/2.0 | 1,439 (+3%) | 2mo | $245,000 | $170 | 72 |
| 1209 Angelina Dr | 0.59mi | 3/2.0 | 1,324 (-6%) | 4mo | $240,456 | $182 | 59 |
| 621 Hemingway Ln | 0.72mi | 4/2.0 (+1) | 1,605 (+14%) | 5mo | $345,000 | $215 | 33 |
| 1206 Booker Dr | 0.71mi | 4/2.0 (+1) | 1,605 (+14%) | 6mo | $310,505 | $193 | 33 |
| 1200 Booker Dr | 0.71mi | 4/2.0 (+1) | 1,605 (+14%) | 6mo | $330,126 | $206 | 32 |
Match score weights: distance 35% · size 25% · config 20% · recency 20%. Top-matched comps best support the ARV.
Projected returns pro-forma
-3.0% appreciation · 0.0% rent growth · sell at horizon
- IRR
- -30.0%
- Equity multiple
- 0.03×
- Total profit
- $-77,420
- Equity at exit
- $42,489
- IRR
- -50.5%
- Equity multiple
- -0.54×
- Total profit
- $-122,570
- Equity at exit
- $24,639
Cash invested: $79,790 (down + closing). Projections, not guarantees.
Landlord ↔ Tenant lean methodology
- Overall (STATE)
- 87 Strongly Landlord-Friendly
- State Texas
- 87 Strongly Landlord-Friendly · R+5
- County
- — inherits STATE
- City
- — inherits STATE
ZIP-level market 75407
- Home prices YoY
- -30.3%
- Rents YoY
- -1.0%
- Active inventory
- 1410
- Price-to-rent
- 10.3×
Monthly cashflow live
- Estimated rent
- $1,987 high interval (Pro) →
- Mortgage (P&I)
- −$1,494
- Tax est. 1.5%
- −$356 /mo · $4,274/yr
- Insurance
- −$119
- HOA
- −$0
- Vacancy / Maint / Mgmt
- −$417
- Net cashflow
- $-400
Break-even live
Sensitivity live
| Price | -10% $-203 | -5% $-301 | +0% $-400 | +5% $-498 | +10% $-597 |
|---|---|---|---|---|---|
| Rent | -10% $-557 | -5% $-478 | +0% $-400 | +5% $-321 | +10% $-243 |
| Rate | -1.0pp $-256 | -0.5pp $-327 | base $-400 | +0.5pp $-473 | +1.0pp $-549 |
UW: 25.0% down · 7.5% · 30yr · 1.5% tax · 5.0% vac · 8.0% maint · 8.0% mgmt
Financing live
Cash to close
- Down payment
- $71,241
- Closing costs
- $8,549
- Reserves months
- —
- Total cash needed
- —
Loan-product check · same deal, 3 products live
Conventional
25% down · 7.5% · 30yr
- Down + closing
- —
- Monthly P&I
- —
- Monthly cashflow
- —
- DSCR
- —
- Eligible?
- —
Personal DTI + credit; lowest rate.
DSCR
20% down · 8.5% · 30yr
- Down + closing
- —
- Monthly P&I
- —
- Monthly cashflow
- —
- DSCR
- —
- Eligible?
- —
No personal income docs; deal must DSCR.
Hard money
10% down · 12.0% · 12mo
- Down + closing
- —
- Monthly P&I
- —
- Monthly cashflow
- —
- DSCR
- —
- Eligible?
- —
Short-term bridge; refi at stabilization.
Rent comps 40 comps
| Address | Beds | Baths | Sqft | Rent | $/sqft | DOM | Units | Dist |
|---|---|---|---|---|---|---|---|---|
| 1242 Tupelo Trl Princeton, TX | 3.0 | 2.0 | 1600 | $1,800 | $1.12 | 26d | 1 | 0.08mi |
| 1230 Cherry Bark Dr Princeton, TX | 3.0 | 2.0 | 1436 | $1,925 | $1.34 | 9d | 1 | 0.13mi |
| 1222 Tallow Trl Princeton, TX | 4.0 | 2.0 | 1667 | $1,945 | $1.17 | 45d | 1 | 0.15mi |
| 508 Poplar St Princeton, TX | 4.0 | 2.0 | 1835 | $1,995 | $1.09 | 19d | 1 | 0.18mi |
| 1117 Loblolly Ln Princeton, TX | 4.0 | 2.0 | 1784 | $1,795 | $1.01 | 22d | 1 | 0.21mi |
| 1329 Plum Rd Princeton, TX | 3.0 | 2.0 | 1440 | $2,055 | $1.43 | 26d | 1 | 0.25mi |
| 1205 Catclaw Rd Princeton, TX | 3.0 | 2.0 | 1474 | $1,900 | $1.29 | 45d | 1 | 0.25mi |
| 1033 Sourgum St Princeton, TX | 4.0 | 2.0 | 1667 | $1,850 | $1.11 | 14d | 1 | 0.26mi |
| 1033 Sourgum St Princeton, TX | 4.0 | 2.0 | 1667 | $1,850 | $1.11 | 9d | 1 | 0.26mi |
| 1201 Catclaw Rd Princeton, TX | 4.0 | 2.0 | 1774 | $1,900 | $1.07 | 45d | 1 | 0.26mi |
| 1209 Mesquite Ln Princeton, TX | 4.0 | 2.0 | 1828 | $1,995 | $1.09 | 14d | 1 | 0.28mi |
| 1012 Mountain Laurel Rd Princeton, TX | 4.0 | 2.0 | 1499 | $1,900 | $1.27 | 45d | 1 | 0.30mi |
| 1008 Mountain Laurel Rd Princeton, TX | 3.0 | 2.0 | 1262 | $1,700 | $1.35 | 20d | 1 | 0.30mi |
| 1040 Calley Pear Trl Princeton, TX | 3.0 | 2.0 | 1411 | $1,725 | $1.22 | 45d | 1 | 0.32mi |
| 1032 Calley Pear Trl Princeton, TX | 4.0 | 2.0 | 1600 | $1,820 | $1.14 | 9d | 1 | 0.33mi |
| 1024 Calley Pear Trl Princeton, TX | 3.0 | 2.0 | 1402 | $1,710 | $1.22 | 26d | 1 | 0.34mi |
| 1208 Sequoia Ln Princeton, TX | 4.0 | 2.0 | 1828 | $2,000 | $1.09 | 45d | 1 | 0.36mi |
| 1000 Calley Pear Trl Princeton, TX | 3.0 | 2.0 | 1402 | $1,700 | $1.21 | 45d | 1 | 0.36mi |
| 1029 Calley Pear Trl Princeton, TX | 3.0 | 2.0 | 1402 | $1,725 | $1.23 | 45d | 1 | 0.36mi |
| 932 Calley Pear Trl Princeton, TX | 3.0 | 2.0 | 1255 | $1,750 | $1.39 | 46d | 1 | 0.36mi |
| 900 Mountain Laurel Rd Princeton, TX | 4.0 | 2.0 | 1500 | $1,900 | $1.27 | 14d | 1 | 0.36mi |
| 928 Calley Pear Trl Princeton, TX | 3.0 | 2.0 | 1411 | $1,680 | $1.19 | 9d | 1 | 0.37mi |
| 905 Mountain Laurel Rd Princeton, TX | 3.0 | 2.0 | 1406 | $1,885 | $1.34 | 19d | 1 | 0.38mi |
| 1105 Daffodil St Princeton, TX | 3.0 | 2.0 | 1606 | $2,090 | $1.30 | 20d | 1 | 0.41mi |
| 1325 Englemann Dr Princeton, TX | 4.0 | 2.0 | 1656 | $1,795 | $1.08 | 7d | 1 | 0.42mi |
| 1109 Sassafras Dr Princeton, TX | 3.0 | 2.0 | 1606 | $1,850 | $1.15 | 12d | 1 | 0.43mi |
| 235 Magnolia Dr Princeton, TX | 3.0 | 2.0 | 1619 | $1,899 | $1.17 | 26d | 1 | 0.44mi |
| 835 Ginkgo Way Princeton, TX | 3.0 | 2.0 | 1474 | $1,850 | $1.26 | 45d | 1 | 0.46mi |
| 1228 Arizona Princeton, TX | 3.0 | 2.0 | 1619 | $1,795 | $1.11 | 20d | 1 | 0.46mi |
| 827 Ginkgo Way Princeton, TX | 4.0 | 2.0 | 1667 | $1,849 | $1.11 | 45d | 1 | 0.47mi |
| 1206 Arizona Princeton, TX | 3.0 | 2.0 | 1619 | $1,795 | $1.11 | 19d | 1 | 0.51mi |
| 230 Silverleaf Dr Princeton, TX | 3.0 | 2.0 | 1625 | $1,875 | $1.15 | 14d | 1 | 0.52mi |
| 309 Hackberry St Princeton, TX | 3.0 | 2.0 | 1594 | $1,800 | $1.13 | 45d | 1 | 0.52mi |
| 1309 Shumard Dr Princeton, TX | 4.0 | 2.0 | 1658 | $1,875 | $1.13 | 21d | 1 | 0.55mi |
| 922 Evergreen St Princeton, TX | 4.0 | 2.0 | 1838 | $1,900 | $1.03 | 7d | 1 | 0.56mi |
| 921 Mossycup ST Princeton, TX | 4.0 | 2.0 | 1667 | $1,950 | $1.17 | 6d | 1 | 0.58mi |
| 921 Mossycup ST Princeton, TX | 4.0 | 2.0 | 1667 | $1,990 | $1.19 | 20d | 1 | 0.58mi |
| 1314 Shumard Dr Princeton, TX | 3.0 | 2.0 | 1625 | $1,875 | $1.15 | 1d | 1 | 0.59mi |
| 905 Silverbell St Princeton, TX | 3.0 | 2.0 | 1445 | $1,850 | $1.28 | 20d | 1 | 0.59mi |
| 203 Cedar Creek Dr Princeton, TX | 3.0 | 2.0 | 1324 | $1,975 | $1.49 | 20d | 1 | 0.62mi |
Listing history 18 events
-
2026-06-21pricedays on market $245,999 Active 600 DOM
-
2026-06-18days on market $265,999 Active 597 DOM
-
2026-06-17days on market $265,999 Active 596 DOM
-
2026-06-16days on market $265,999 Active 595 DOM
-
2026-06-15days on market $265,999 Active 594 DOM
-
2026-06-13days on market $265,999 Active 592 DOM
-
2026-06-13days on market $265,999 Active 591 DOM
-
2026-06-09days on market $265,999 Active 588 DOM
-
2026-06-08days on market $265,999 Active 587 DOM
-
2026-06-07days on market $265,999 Active 586 DOM
-
2026-06-04days on market $265,999 Active 583 DOM
-
2026-06-03days on market $265,999 Active 582 DOM
-
2026-06-02days on market $265,999 Active 581 DOM
-
2026-06-01days on market $265,999 Active 580 DOM
-
2026-05-31days on market $265,999 Active 579 DOM
-
2025-03-11price $265,999 419-char remark
Show marketing remark (419 chars)
This single-level home showcases a spacious open floorplan shared between the kitchen, dining area and family room for easy entertaining during gatherings. An owner's suite enjoys a private location in a rear corner of the home, complemented by an en-suite bathroom and walk-in closet. There are two secondary bedrooms along the side of the home, which are comfortable spaces for household members and overnight guests.
-
2024-11-20price $264,999 419-char remark
Show marketing remark (419 chars)
This single-level home showcases a spacious open floorplan shared between the kitchen, dining area and family room for easy entertaining during gatherings. An owner's suite enjoys a private location in a rear corner of the home, complemented by an en-suite bathroom and walk-in closet. There are two secondary bedrooms along the side of the home, which are comfortable spaces for household members and overnight guests.
-
2024-10-29$278,999 Active 419-char remark
Show marketing remark (419 chars)
This single-level home showcases a spacious open floorplan shared between the kitchen, dining area and family room for easy entertaining during gatherings. An owner's suite enjoys a private location in a rear corner of the home, complemented by an en-suite bathroom and walk-in closet. There are two secondary bedrooms along the side of the home, which are comfortable spaces for household members and overnight guests.
ⓘ Source: listings_history table (triggers on properties + properties_extension) + one-shot
backfill from property_details.listing_events for pre-trigger history.
Climate risk First Street
- Flood 1/10 Low FEMA zone X (unshaded) · 0% chance over 30 yrs
- Wildfire 4/10 Moderate
- Heat 7/10 Severe 7 d/yr ≥111°F today · 24 d/yr by 30 yrs out
- Wind 6/10 Major 27% chance of damaging wind over 30 yrs
- Air quality 3/10 Moderate 3 unhealthy d/yr today · 3 by 30 yrs out
Nearby sold comps map
Loading sold comps map…
Walkable amenities ~0.75 mi
Loading nearby amenities…
Taxation est. · year 1
- Rental income
- $23,844
- − Mortgage interest
- −$15,963
- − Property taxes
- −$4,274
- − Insurance
- −$1,425
- − Repairs & maintenance
- −$1,908
- − Management
- −$1,908
- − Depreciation
- −$8,290
- Taxable loss
- −$9,923
- Est. tax savings @ 24.0%
- +$2,381
- After-tax cash flow
- $-2,414/yr
For passive investors: Depreciation is non-cash, so a rental often shows a tax loss while cash-flowing — sheltering income. Rental losses are passive: they offset passive income freely, and up to $25,000/yr can offset ordinary (W-2) income if you actively participate and your MAGI is under $100k (phasing out to $0 by $150k); unused losses carry forward. On sale, claimed depreciation is recaptured at up to 25%, and gains may owe capital-gains tax (a 1031 exchange can defer both). Figures are a year-1 estimate at your 24.0% rate — not tax advice; consult a CPA.
Schools (NCES district)
- District
- Princeton ISD
- NCES district ID
- 4835850
- Math proficiency
- 51% ▼ -8.00%
- Reading proficiency
- 47% ▬ 0.00%
- Median HH income
- $54,827
- Composite
- 42.44/100
- National rank
- #3226
- State rank
- #188 of 826 in TX
Livability — Princeton
- Score
- 62/100
- State rank
- #969
- US rank
- #17215
Category grades
Schools grade is shown separately in the Schools card above.
Census & demographics
- County
- Collin County · 1,159,394 people
- City population
- 34,171
- Metro
- Dallas-Fort Worth-Arlington, TX
- Population (ZIP)
- 34,171
- Household income
- $100,037
- Rent vs Own
- Severe rent burden
- 368.0
Population outlook (Collin County) Hauer SSP2
- Today (2025)
- 1,210,074 people
- By 2030
- 1,358,201 · +12.2%
- By 2040
- 1,654,061 · +36.7%
- By 2050
- 1,937,359 · +60.1%
- By 2075
- 2,567,039 · +112.1%
- By 2100
- 2,952,048 · +144.0%
Race, ethnicity, and origin ACS 2023
- Neighborhood character
- Diverse neighborhood (Simpson 0.66)
- Race & ethnicity
- White 47% Hispanic / Latino 30% Black 17% Two or more races 10% Asian 4% Native American 1%
- Hispanic origin (detail)
- Mexican 26%
- Common ancestry
- Lithuanian 2% Romanian 1% Russian 1%
- Foreign-born
- 15% · Canada, China, Mexico
- Languages at home
- 70% English-only · Spanish 22% Other Indo-European 2% Other Asian/Pacific 1%
Political lean MEDSL · Collin
- 2024 margin
- R (+11.1) · D 43.1% · R 54.3% · Other 2.6%
- 2008→2024 swing
- +14.4pp toward D · 2008: -25.6pp · 2024: -11.1pp
- All cycles
- 2024: R+11.1 2020: R+4.3 2016: R+17.0 2012: R+31.6 2008: R+25.6
Not yet ingested
- Civics
- —
Market trends
- HPI YoY
- ▼ -103.99%
- Current HPI
- 238.9373
- Rent YoY
- ▼ -1.02%
- Metro
- Dallas-Fort Worth-Arlington, TX
- State GDP YoY
- ▲ 3.95%
- F500 in state
- 110
Industry mix (Fortune 500 HQ in TX)
| Industry | F500 HQs | Revenue |
|---|---|---|
| Energy | 16 | $1,198B |
|
||
| Technology | 5 | $198B |
|
||
| Engineering / Construction | 4 | $72B |
|
||
| Energy Services | 3 | $60B |
|
||
| Utilities | 3 | $41B |
|
||
| Healthcare | 2 | $330B |
|
||
Price history
-4.7% since first listed3 events — show timeline
- 2025-03-11 Price Changed $265,999 Zillow
- 2024-11-20 Price Changed $264,999 Zillow
- 2024-10-29 Listed $278,999 Zillow
Cash-flow waterfall
monthlySold comps — $/sqft
last 12 mo · ≤1 miLoading sold comps…