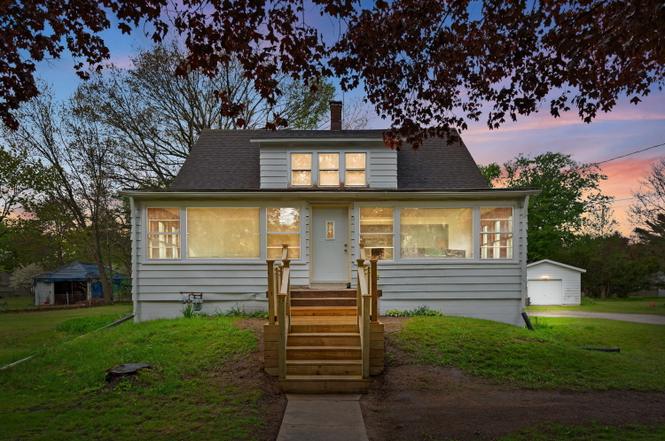
320 Johnson Rd · Trail Creek, IN
Flood risk 1/10 · Minimal
- FEMA flood zone
- X (unshaded)
- Chance of flooding over 30 yrs
- 0.0%
- Est. flood insurance / yr
- $473 – $860
Fire risk 1/10 · Minimal
- Est. fire insurance / yr
- $717 – $1,331
Heat risk 2/10 · Minimal
- Hot days now (above 100°F)
- 7 days/yr
- Hot days in 30 yrs
- 15 days/yr
Wind risk 2/10 · Minimal
- Chance of severe wind over 30 yrs
- —
Air-quality risk 3/10 · Minor
- Unhealthy air days now
- 2 days/yr
- Unhealthy air days in 30 yrs
- 3 days/yr
Risk factors via First Street. Map © Google.
Why this score? — see what drove the C+ grade
The composite is a weighted blend of 9 inputs, each scored 0–100. Each bar is that input's sub-score; the figure is the points it added to the 100-point composite (weight × sub-score).
- Cash flow +26.7/30.0
- DSCR +9.2/10.0
- ARV discount +7.5/15.0
- 1% rule +6.0/10.0
- Rent growth +4.9/5.0
- Livability +3.7/5.0
- Condition / age +2.5/5.0
- Schools +2.2/10.0
- Appreciation +0.0/10.0
$150,000
🖨 Deal sheet 📄 Offer letter ✓ Due diligence
Listing remarks
Opportunity is knocking in Trail Creek! This classic bungalow has been loved by the same owner for 40 years and is now ready for its next chapter. Freshly discovered hardwood floors hint at the charm and character waiting to be uncovered throughout, and with some TLC this home has serious potential. The open-concept floor plan is bright and welcoming, with two bedrooms on the main level and three additional bedrooms upstairs. The upper level also offers the opportunity to easily add a second bathroom, making the layout even more functional for the right buyer. Laundry is conveniently located in the basement. Some work has already been started, giving the next owner a head start on transform
Key facts
- Massive lot
- Hardwood floors
- Detached garage
Tags
Property features AI
Exterior
- Parking: Detached garage; Driveway; Additional off-street parking
- Security: Carbon monoxide detector(s); Smoke detector(s)
- Utilities: Electricity connected; Water connected (well); Septic tank
- Home design: Two-story; Built in 1890
- Construction: Has basement
- Exterior features: Private yard; Rain gutters; Neighborhood view
Interior
- Kitchen: Gas range; Refrigerator
- Bedrooms: Primary bedroom; Bedroom 2; Bedroom 3; Bedroom 4; Bedroom 5
- Flooring: Carpet; Hardwood
- Bathrooms: 1 full bathroom
- Heating & cooling: Hot water heating; Ceiling fan(s) for cooling
- Interior features: Ceiling fans; Walk-in closet(s); Basement (unfinished, other)
- Laundry & utility: Dryer
Neighborhood map
What this means for you Summary
Snapshot
- This is a 4-bed/1.0-bath single-family listed at $150k.
Deal economics
- At list price, monthly cash flow is $405 ($5k/yr) — positive.
- The deal already cash-flows at list — no discount required.
- Meets the 1% rule at list price ($2k rent vs $150k).
- Recommended offer: $146k (3.0% below list) — sets the bar for market timing.
Location & tenants
- Location reads 74/100 on livability (#71 in IN, #4,553 nationally) — a middle-class / working-renter tenant base. Strengths: crime A+, cost of living A+, housing A+; Watch: schools D-, amenities F, commute F.
- Michigan City Area Schools (urban): math 23% / reading 28% proficiency, ranked #262 of 301 in IN (top 87%) — low school quality limits family demand, transient renter base, plan for 1-2y turnover; 68% free/reduced lunch — lower-income household profile, screen leases tightly.
- Market conditions: Rents rising fast (+9.7%/yr); 371 active listings in the ZIP; 2 comparable units currently listed for rent nearby; 216 units permitted in LaPorte County in 2024 (75 in 5+ unit buildings).
- This rent runs 33% of the median local income ($59k/yr) — at the standard rent-burdened threshold; future hikes will face affordability resistance.
Forward outlook
- Local home prices are declining (-3.0%/yr); year-one equity from $1k of loan paydown is wiped out by about $4k of value loss. Plan a longer hold.
- LaPorte County population projected to shrink 7% by 2050 — rents likely to lag national; underwrite the cash flow, not the appreciation.
- At projected returns (-3.0% appreciation + 8.0% rent growth), your $42k cash investment doubles in ~7 years — after that, you're playing with house money.
Negotiation context
- It's been on market 39 days — a 3% lower offer ($146k) is reasonable based on typical stale-listing flexibility.
Risks & watch-outs
- Watch-outs: built in 1890 — expect roof / HVAC / electrical / plumbing capex.
Questions for the listing agent
- It's been on market 39 days. Have you received any prior offers? Is the seller open to a 3% concession, seller financing, or rate buy-down credit?
- Built in 1890 — when were the roof, HVAC, electrical panel, plumbing, and water heater last replaced?
- Is there a deadline driving the sale (1031 exchange, divorce, estate, relocation)? That informs how much negotiation room exists.
- Schools are D-rated, which usually means shorter tenancies and higher turnover. Who's the typical renter profile here, and what's been the actual vacancy rate?
- What's the average days-on-market for RENTAL listings here right now (not sales)? A rising rental-DOM trend means longer vacancies and softer asking-rent achievability than the comps imply.
- What's the recent tenant-quality profile in this submarket — average credit score on applications, eviction rate, late-payment / NSF rate, and stable-employment percentage? A property-management company in the area should have these aggregated.
- How much new for-sale + rental construction is in the pipeline within 1–3 miles? Heavy new supply typically softens prices + rents 12–24 months out; constrained supply supports both.
Investment metrics
- 1% rule
- 1.10% ✓
- Cap rate
- 9.54%
- Cash-on-cash
- 11.58%
- DSCR
- 1.52
- GRM
- 7.6
CMA / ARV
- ARV (on-the-fly)
- $308,024
- Comps found
- 12
Show comp detail 12 sales within ~0.75 mi
| Address | Dist | Beds/Ba | Sqft | Sold | Price | $/sf | Match |
|---|---|---|---|---|---|---|---|
| 320 Martin Dr | 0.31mi | 4/2.0 | 2,298 (+4%) | 5mo | $210,000 | $91 | 71 |
| 421 Trail St | 0.24mi | 3/1.5 (-1) | 2,133 (-4%) | 9mo | $339,900 | $159 | 68 |
| 105 Starling Dr | 0.50mi | 4/2.0 | 2,090 (-6%) | 7mo | $289,950 | $139 | 57 |
| 403 Firefly Dr | 0.45mi | 3/1.5 (-1) | 2,100 (-5%) | 8mo | $292,500 | $139 | 56 |
| 312 Black Oak Dr | 0.21mi | 4/2.0 | 2,416 (+9%) | 18mo | $265,000 | $110 | 56 |
| 306 Leo Ave | 0.08mi | 3/2.0 (-1) | 2,528 (+14%) | 12mo | $282,000 | $112 | 54 |
| 2118 Red Oak Dr | 0.29mi | 4/2.0 | 1,941 (-12%) | 10mo | $300,000 | $155 | 53 |
| 424 Laurel Dr | 0.32mi | 4/2.5 | 2,501 (+13%) | 13mo | $324,900 | $130 | 46 |
| 104 Brookdale Ave | 0.50mi | 4/2.5 | 2,088 (-6%) | 18mo | $279,900 | $134 | 46 |
| 1903 E Coolspring Ave | 0.53mi | 3/2.5 (-1) | 2,154 (-3%) | 18mo | $299,000 | $139 | 45 |
| 406 Chapala Pkwy | 0.36mi | 3/2.5 (-1) | 2,464 (+11%) | 14mo | $385,000 | $156 | 42 |
| 2532 Bruce Dr | 0.64mi | 4/1.5 | 1,932 (-13%) | 16mo | $220,000 | $114 | 33 |
Match score weights: distance 35% · size 25% · config 20% · recency 20%. Top-matched comps best support the ARV.
Projected returns pro-forma
-3.0% appreciation · 8.0% rent growth · sell at horizon
- IRR
- 5.9%
- Equity multiple
- 1.24×
- Total profit
- $10,167
- Equity at exit
- $22,365
- IRR
- 19.1%
- Equity multiple
- 2.94×
- Total profit
- $81,516
- Equity at exit
- $12,969
Cash invested: $42,000 (down + closing). Projections, not guarantees.
Landlord ↔ Tenant lean methodology
- Overall (STATE)
- 90 Strongly Landlord-Friendly
- State Indiana
- 90 Strongly Landlord-Friendly · R+11
- County
- — inherits STATE
- City
- — inherits STATE
ZIP-level market 46360
- Rents YoY
- 9.7%
- Active inventory
- 371
- Price-to-rent
- 7.6×
Monthly cashflow live
- Estimated rent
- $1,649 medium interval (Pro) →
- Mortgage (P&I)
- −$787
- Tax from tax record
- −$48 /mo · $577/yr
- Insurance
- −$62
- HOA
- −$0
- Vacancy / Maint / Mgmt
- −$346
- Net cashflow
- $405
Break-even live
UW: 25.0% down · 7.5% · 30yr · 1.5% tax · 5.0% vac · 8.0% maint · 8.0% mgmt
Financing live
Cash to close
- Down payment
- $37,500
- Closing costs
- $4,500
- Reserves months
- —
- Total cash needed
- —
Loan-product check · same deal, 3 products live
Conventional
25% down · 7.5% · 30yr
- Down + closing
- —
- Monthly P&I
- —
- Monthly cashflow
- —
- DSCR
- —
- Eligible?
- —
Personal DTI + credit; lowest rate.
DSCR
20% down · 8.5% · 30yr
- Down + closing
- —
- Monthly P&I
- —
- Monthly cashflow
- —
- DSCR
- —
- Eligible?
- —
No personal income docs; deal must DSCR.
Hard money
10% down · 12.0% · 12mo
- Down + closing
- —
- Monthly P&I
- —
- Monthly cashflow
- —
- DSCR
- —
- Eligible?
- —
Short-term bridge; refi at stabilization.
Rent comps 2 comps
| Address | Beds | Baths | Sqft | Rent | $/sqft | DOM | Units | Dist |
|---|---|---|---|---|---|---|---|---|
| 910 S Carroll Ave Michigan City, IN | 2.0–3.0 | 2.0 | 1187 | $1,600 | $1.35 | 43d | 3 | 0.78mi |
| 403 Herring Gull Ln Michigan City, IN | 1.0–4.0 | 1.0–2.0 | 1083 | $1,325 | $1.22 | 43d | 1 | 1.09mi |
Listing history 16 events
-
2026-06-17status $150,000 Pending 39 DOM
-
2026-06-16days on market $150,000 Active Under Contract 39 DOM
-
2026-06-15days on market $150,000 Active Under Contract 38 DOM
-
2026-06-14days on market $150,000 Active Under Contract 36 DOM
-
2026-06-13days on market $150,000 Active Under Contract 35 DOM
-
2026-06-10days on market $150,000 Active Under Contract 33 DOM
-
2026-06-09days on market $150,000 Active Under Contract 32 DOM
-
2026-06-08days on market $150,000 Active Under Contract 31 DOM
-
2026-06-07days on market $150,000 Active Under Contract 30 DOM
-
2026-06-03days on market $150,000 Active Under Contract 26 DOM
-
2026-06-02days on market $150,000 Active Under Contract 25 DOM
-
2026-06-01days on market $150,000 Active Under Contract 24 DOM
-
2026-05-31days on market $150,000 Active Under Contract 23 DOM
-
2026-05-30days on market $150,000 Active Under Contract 22 DOM
-
2026-05-11historical Active Under Contract
-
2026-05-07$150,000 Active
ⓘ Source: listings_history table (triggers on properties + properties_extension) + one-shot
backfill from property_details.listing_events for pre-trigger history.
Tax reassessment forecast IN · Partial reset (capped growth)
- Current annual tax
- $577 · $48/mo
- Projected year-2 tax
- $926 · $77/mo
- Expected delta
- +$349/yr (+$29/mo · 60.5%)
ⓘ Screening estimate from a state-policy table — verify with the county assessor before closing.
Climate risk First Street
- Flood 1/10 Low FEMA zone X (unshaded) · 0% chance over 30 yrs
- Wildfire 1/10 Low
- Heat 2/10 Low 7 d/yr ≥100°F today · 15 d/yr by 30 yrs out
- Wind 2/10 Low
- Air quality 3/10 Moderate 2 unhealthy d/yr today · 3 by 30 yrs out
Nearby sold comps map
Loading sold comps map…
Walkable amenities ~0.75 mi
Loading nearby amenities…
Taxation est. · year 1
- Rental income
- $19,787
- − Mortgage interest
- −$8,402
- − Property taxes
- −$577
- − Insurance
- −$750
- − Repairs & maintenance
- −$1,583
- − Management
- −$1,583
- − Depreciation
- −$4,364
- Taxable income
- $2,528
- Est. tax owed @ 24.0%
- −$607
- After-tax cash flow
- $4,258/yr
For passive investors: Depreciation is non-cash, so a rental often shows a tax loss while cash-flowing — sheltering income. Rental losses are passive: they offset passive income freely, and up to $25,000/yr can offset ordinary (W-2) income if you actively participate and your MAGI is under $100k (phasing out to $0 by $150k); unused losses carry forward. On sale, claimed depreciation is recaptured at up to 25%, and gains may owe capital-gains tax (a 1031 exchange can defer both). Figures are a year-1 estimate at your 24.0% rate — not tax advice; consult a CPA.
Schools (NCES district)
- District
- Michigan City Area Schools
- NCES district ID
- 1806570
- Math proficiency
- 23% ▼ -16.00%
- Reading proficiency
- 28% ▼ -10.00%
- Median HH income
- $42,629
- Composite
- 21.76/100
- National rank
- #8257
- State rank
- #262 of 301 in IN
Livability — Trail Creek
- Score
- 74/100
- State rank
- #71
- US rank
- #4553
Category grades
Schools grade is shown separately in the Schools card above.
Census & demographics
- Census place
- Trail Creek, IN
- County
- La Porte County · 88,580 people
- Metro
- Michigan City-La Porte, IN
- Population (ZIP)
- 43,817
- Household income
- $59,266
- Rent vs Own
- Severe rent burden
- 1152.0
Population outlook (LaPorte County) Hauer SSP2
- Today (2025)
- 109,757 people
- By 2030
- 108,288 · -1.3%
- By 2040
- 105,070 · -4.3%
- By 2050
- 102,330 · -6.8%
- By 2075
- 97,009 · -11.6%
- By 2100
- 86,459 · -21.2%
Race, ethnicity, and origin ACS 2023
- Neighborhood character
- Predominantly White (67%)
- Race & ethnicity
- White 67% Black 20% Hispanic / Latino 8% Two or more races 7%
- Hispanic origin (detail)
- Mexican 5%
- Common ancestry
- Romanian 11% Lithuanian 2% Iranian 1%
- Foreign-born
- 3% · Canada
- Languages at home
- 95% English-only · Spanish 3%
Political lean MEDSL · LaPorte
- 2024 margin
- R (+14.1) · D 42.1% · R 56.2% · Other 1.7%
- 2008→2024 swing
- -19.1pp toward R · 2008: 5.0pp · 2024: -14.1pp
- All cycles
- 2024: R+14.1 2020: R+7.2 2016: R+6.4 2012: D+12.6 2008: D+5.0
Not yet ingested
- Civics
- —
Market trends
- HPI YoY
- ▼ -210.27%
- Current HPI
- 206.0882
- Rent YoY
- ▲ 9.72%
- Metro
- Michigan City-La Porte, IN
- State GDP YoY
- ▲ 2.90%
- F500 in state
- 18
Industry mix (Fortune 500 HQ in IN)
| Industry | F500 HQs | Revenue |
|---|---|---|
| Industrial Machinery | 2 | $37B |
|
||
| Healthcare | 1 | $177B |
|
||
| Pharmaceuticals | 1 | $45B |
|
||
| Metals / Steel | 1 | $18B |
|
||
| Agriculture | 1 | $17B |
|
||
| Packaging | 1 | $12B |
|
||
Price history
2 events — show timeline
- 2026-05-11 Contingent — NIRA MLS as Distributed by MLS Grid
- 2026-05-07 Listed $150,000 NIRA MLS as Distributed by MLS Grid
Property tax history
+5.1%/yrLatest (2024): $577 · +4.4% YoY. Source: county tax records.
Cash-flow waterfall
monthlySold comps — $/sqft
last 12 mo · ≤1 miLoading sold comps…