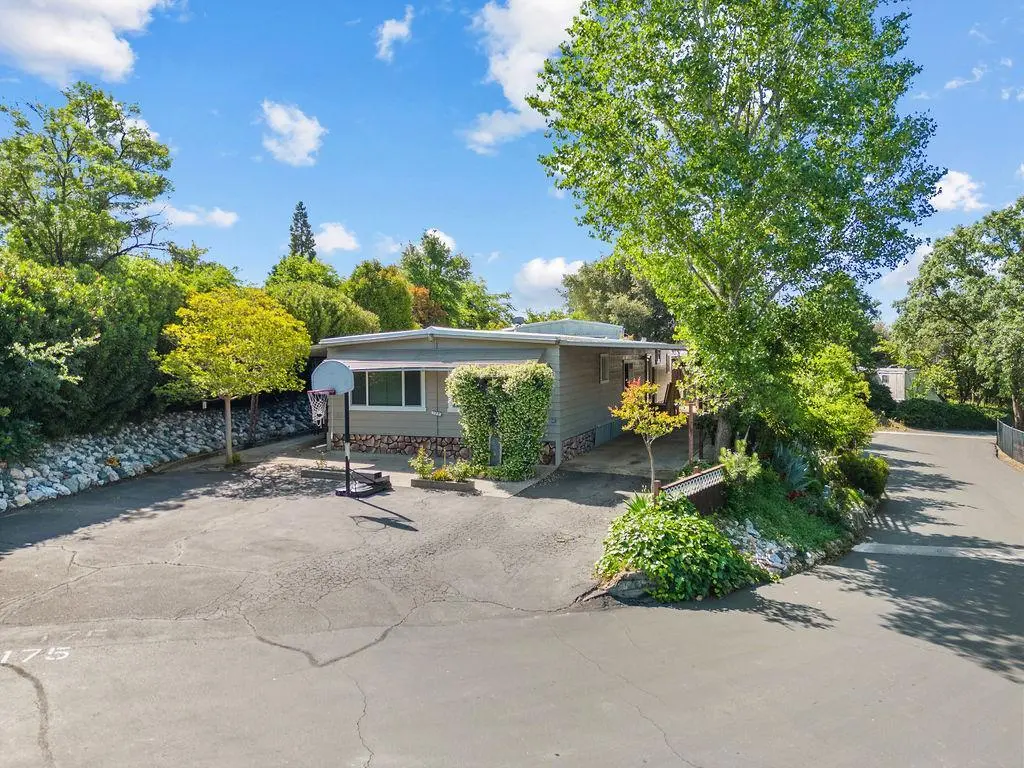
314 S Main St #175 · Angels, CA
Flood risk 1/10 · Minimal
- FEMA flood zone
- X (unshaded)
- Chance of flooding over 30 yrs
- 0.0%
- Est. flood insurance / yr
- $507 – $1,088
Fire risk 8/10 · Major
- Est. fire insurance / yr
- $659 – $1,223
Heat risk 6/10 · Moderate
- Hot days now (above 102°F)
- 6 days/yr
- Hot days in 30 yrs
- 13 days/yr
Wind risk 1/10 · Minimal
- Chance of severe wind over 30 yrs
- —
Air-quality risk 10/10 · Severe
- Unhealthy air days now
- 27 days/yr
- Unhealthy air days in 30 yrs
- 31 days/yr
Risk factors via First Street. Map © Google.
Why this score? — see what drove the B+ grade
The composite is a weighted blend of 9 inputs, each scored 0–100. Each bar is that input's sub-score; the figure is the points it added to the 100-point composite (weight × sub-score).
- Cash flow +30.0/30.0
- ARV discount +15.0/15.0
- 1% rule +10.0/10.0
- DSCR +10.0/10.0
- Schools +4.5/10.0
- Condition / age +3.8/5.0
- Livability +3.5/5.0
- Rent growth +2.5/5.0
- Appreciation +0.0/10.0
$199,000
🖨 Deal sheet 📄 Offer letter ✓ Due diligence
Listing remarks
Welcome to this beautifully updated and well‑maintained 3 bedroom, 2 bathroom mobile home located in the heart of Angels Camp. Sitting on a premium corner lotone of the largest lots in the entire parkthis home offers exceptional space, privacy, and value. With low space rent and plenty of parking, it's a rare find. Inside, you'll enjoy a bright, refreshed interior featuring new double‑pane windows, fresh paint throughout, and remodeled bathrooms that give the home a clean, modern feel. Major upgrades include all-new plumbing installed just 5 years ago and a newer AC and furnace, providing comfort and peace of mind year‑round. The spacious layout includes inviting living areas, a functional
Key facts
- Oversized corner lot
- Newer ac and furnace
- Updated interior
Tags
Property features AI
Finance
- HOA & community: No homeowners association; Not a senior community; Land lease in park (monthly land lease: $680)
Exterior
- Parking: Covered parking; Guest parking available
- Utilities: 220-volt outlet in kitchen; Public water; Public sewer
- Home design: Manufactured in park; Double wide
- Construction: Aluminum and stone skirting; FRWST make
- Exterior features: Corner, private lot; Metal roof
Interior
- Kitchen: Breakfast area; Dining/living combo and breakfast nook
- Bedrooms: 3 bedrooms (including master bedroom)
- Flooring: Tile; Wood
- Bathrooms: 2 full bathrooms with tile finishes
- Heating & cooling: Central heating; Central cooling
- Interior features: Tile and wood flooring; Covered deck, railed porch; Dual-pane full windows; Pets allowed
- Laundry & utility: Indoor laundry area
Neighborhood map
What this means for you Summary
Snapshot
- This is a 3-bed/2.0-bath manufactured listed at $199k. Condition is rated good.
Deal economics
- At list price, monthly cash flow is $1k ($13k/yr) — positive.
- The deal already cash-flows at list — no discount required.
- Meets the 1% rule at list price ($3k rent vs $199k).
- Recommended offer: $193k (3.0% below list) — sets the bar for market timing.
- Cap rate 13.0% vs local median 4.5% in Angels — top-decile yield for the area; either an underpriced asset or a hidden risk that comps aren't pricing in. Stress-test before assuming the spread holds.
Location & tenants
- Location reads 69/100 on livability (#265 in CA) — a middle-class / working-renter tenant base. Strengths: health & safety A+, crime B+, schools B; Watch: amenities F, commute F, cost of living F.
- Bret Harte Union High (town): math 35% / reading 65% proficiency, ranked #429 of 1,400 in CA (top 31%) — acceptable for families but not a draw, mixed tenant base, ~2y average lease.
- Market conditions: 95 active listings in the ZIP; 1 comparable units currently listed for rent nearby; 77 units permitted in Calaveras County in 2024 (0 in 5+ unit buildings).
Forward outlook
- Local home prices are declining (-3.0%/yr); year-one equity from $1k of loan paydown is wiped out by about $6k of value loss. Plan a longer hold.
- Calaveras County population projected at -18% by 2050 — secular population decline; favor cash flow + early exit over multi-decade hold.
- At projected returns (-3.0% appreciation + 3.0% rent growth), your $56k cash investment doubles in ~6 years — after that, you're playing with house money.
Negotiation context
- It's been on market 40 days — a 3% lower offer ($193k) is reasonable based on typical stale-listing flexibility.
Risks & watch-outs
- Climate carrying-cost: severe wildfire risk; extreme-heat days projected 6→13/yr by 2055 (HVAC capex compounding) — expect insurance premiums to compound above CPI over the hold.
Questions for the listing agent
- It's been on market 40 days. Have you received any prior offers? Is the seller open to a 3% concession, seller financing, or rate buy-down credit?
- Is there a deadline driving the sale (1031 exchange, divorce, estate, relocation)? That informs how much negotiation room exists.
- Schools are B-rated — typically a magnet for longer-tenancy family renters. What's the average tenant stay here, and is there a school-zone premium baked into asking?
- What's the average days-on-market for RENTAL listings here right now (not sales)? A rising rental-DOM trend means longer vacancies and softer asking-rent achievability than the comps imply.
- What's the recent tenant-quality profile in this submarket — average credit score on applications, eviction rate, late-payment / NSF rate, and stable-employment percentage? A property-management company in the area should have these aggregated.
- How much new for-sale + rental construction is in the pipeline within 1–3 miles? Heavy new supply typically softens prices + rents 12–24 months out; constrained supply supports both.
Investment metrics
- 1% rule
- 1.58% ✓
- Cap rate
- 13.01%
- Cash-on-cash
- 23.98%
- DSCR
- 2.07
- GRM
- 5.3
CMA / ARV
- ARV (on-the-fly)
- $276,800
- Comps found
- 3
Show comp detail 3 sales within ~0.75 mi
| Address | Dist | Beds/Ba | Sqft | Sold | Price | $/sf | Match |
|---|---|---|---|---|---|---|---|
| 314 S Main St #86 | 0.05mi | 3/2.0 | 1,600 (0%) | 22mo | $60,000 | $38 | 80 |
| 750 Casey St | 0.55mi | 3/2.0 | 1,425 (-11%) | 10mo | $345,000 | $242 | 48 |
| 933 Mark Twain Rd | 0.56mi | 2/2.0 (-1) | 1,425 (-11%) | 5mo | $247,000 | $173 | 46 |
Match score weights: distance 35% · size 25% · config 20% · recency 20%. Top-matched comps best support the ARV.
Projected returns pro-forma
-3.0% appreciation · 3.0% rent growth · sell at horizon
- IRR
- 17.2%
- Equity multiple
- 1.69×
- Total profit
- $38,705
- Equity at exit
- $29,672
- IRR
- 25.7%
- Equity multiple
- 3.25×
- Total profit
- $125,197
- Equity at exit
- $17,206
Cash invested: $55,720 (down + closing). Projections, not guarantees.
Landlord ↔ Tenant lean methodology
- Overall (STATE)
- 18 Strongly Tenant-Friendly
- State California
- 18 Strongly Tenant-Friendly · D+13
- County
- — inherits STATE
- City
- — inherits STATE
ZIP-level market 95222
- Active inventory
- 95
- Price-to-rent
- 5.3×
Monthly cashflow live
- Estimated rent
- $3,150 medium interval (Pro) →
- Mortgage (P&I)
- −$1,044
- Tax est. 1.5%
- −$249 /mo · $2,985/yr
- Insurance
- −$83
- HOA
- −$0
- Vacancy / Maint / Mgmt
- −$662
- Net cashflow
- $1,113
Break-even live
UW: 25.0% down · 7.5% · 30yr · 1.5% tax · 5.0% vac · 8.0% maint · 8.0% mgmt
Financing live
Cash to close
- Down payment
- $49,750
- Closing costs
- $5,970
- Reserves months
- —
- Total cash needed
- —
Loan-product check · same deal, 3 products live
Conventional
25% down · 7.5% · 30yr
- Down + closing
- —
- Monthly P&I
- —
- Monthly cashflow
- —
- DSCR
- —
- Eligible?
- —
Personal DTI + credit; lowest rate.
DSCR
20% down · 8.5% · 30yr
- Down + closing
- —
- Monthly P&I
- —
- Monthly cashflow
- —
- DSCR
- —
- Eligible?
- —
No personal income docs; deal must DSCR.
Hard money
10% down · 12.0% · 12mo
- Down + closing
- —
- Monthly P&I
- —
- Monthly cashflow
- —
- DSCR
- —
- Eligible?
- —
Short-term bridge; refi at stabilization.
Rent comps 1 comps
| Address | Beds | Baths | Sqft | Rent | $/sqft | DOM | Units | Dist |
|---|---|---|---|---|---|---|---|---|
| 515 Rosebush Ct Angels Camp, CA | 3.0 | 3.0 | 2250 | $3,150 | $1.40 | 13d | 1 | 0.87mi |
Listing history 15 events
-
2026-06-18days on market $199,000 Active 40 DOM
-
2026-06-17days on market $199,000 Active 39 DOM
-
2026-06-16days on market $199,000 Active 38 DOM
-
2026-06-15days on market $199,000 Active 37 DOM
-
2026-06-14days on market $199,000 Active 35 DOM
-
2026-06-10days on market $199,000 Active 32 DOM
-
2026-06-09days on market $199,000 Active 31 DOM
-
2026-06-08days on market $199,000 Active 30 DOM
-
2026-06-07days on market $199,000 Active 29 DOM
-
2026-06-05days on market $199,000 Active 26 DOM
-
2026-06-03days on market $199,000 Active 25 DOM
-
2026-06-02days on market $199,000 Active 24 DOM
-
2026-06-01days on market $199,000 Active 23 DOM
-
2026-05-31days on market $199,000 Active 22 DOM
-
2026-05-30days on market $199,000 Active 21 DOM
ⓘ Source: listings_history table (triggers on properties + properties_extension) + one-shot
backfill from property_details.listing_events for pre-trigger history.
Climate risk First Street
- Flood 1/10 Low FEMA zone X (unshaded) · 0% chance over 30 yrs
- Wildfire 8/10 Severe
- Heat 6/10 Major 6 d/yr ≥102°F today · 13 d/yr by 30 yrs out
- Wind 1/10 Low
- Air quality 10/10 Extreme 27 unhealthy d/yr today · 31 by 30 yrs out
Nearby sold comps map
Loading sold comps map…
Walkable amenities ~0.75 mi
Loading nearby amenities…
Taxation est. · year 1
- Rental income
- $37,800
- − Mortgage interest
- −$11,147
- − Property taxes
- −$2,985
- − Insurance
- −$995
- − Repairs & maintenance
- −$3,024
- − Management
- −$3,024
- − Depreciation
- −$5,789
- Taxable income
- $10,836
- Est. tax owed @ 24.0%
- −$2,601
- After-tax cash flow
- $10,758/yr
For passive investors: Depreciation is non-cash, so a rental often shows a tax loss while cash-flowing — sheltering income. Rental losses are passive: they offset passive income freely, and up to $25,000/yr can offset ordinary (W-2) income if you actively participate and your MAGI is under $100k (phasing out to $0 by $150k); unused losses carry forward. On sale, claimed depreciation is recaptured at up to 25%, and gains may owe capital-gains tax (a 1031 exchange can defer both). Figures are a year-1 estimate at your 24.0% rate — not tax advice; consult a CPA.
Condition & rehab AI · 14 photos
This well-maintained and updated mobile home offers a good investment opportunity with minimal repairs needed and potential for value increase through cosmetic updates.
Value-add opportunities
- Resale Painting the exterior — Fresh paint can significantly enhance curb appeal and home value.
- Rental Landscaping improvements — A well-maintained yard can attract more renters and increase rental value.
Renovation cost estimate screening
Value-add ROI direction
- Resale Painting the exterior — Fresh paint can significantly enhance curb appeal and home value. ↑
- Rental Landscaping improvements — A well-maintained yard can attract more renters and increase rental value. ↑
ⓘ Cost ranges are severity-bucket heuristics (US national rule-of-thumb). Get contractor quotes + a written scope before underwriting a rehab budget.
Schools (NCES district)
- District
- Bret Harte Union High
- NCES district ID
- 0605940
- Math proficiency
- 35% ▲ 5.00%
- Reading proficiency
- 65% ▲ 5.00%
- Median HH income
- $56,974
- Composite
- 45.41/100
- National rank
- #5708
- State rank
- #429 of 1400 in CA
Livability — Angels
- Score
- 69/100
- State rank
- #265
- US rank
- #8772
Category grades
Schools grade is shown separately in the Schools card above.
Census & demographics
- Census place
- Angels, CA
- City population
- 164
- Population (ZIP)
- 5,666
Population outlook (Calaveras County) Hauer SSP2
- Today (2025)
- 43,163 people
- By 2030
- 41,703 · -3.4%
- By 2040
- 38,202 · -11.5%
- By 2050
- 35,385 · -18.0%
- By 2075
- 30,807 · -28.6%
- By 2100
- 25,755 · -40.3%
Race, ethnicity, and origin ACS 2023
- Neighborhood character
- Predominantly White (85%)
- Race & ethnicity
- White 85% Hispanic / Latino 8% Two or more races 7% Native American 2%
- Hispanic origin (detail)
- Mexican 5%
- Common ancestry
- Slovak 4% Russian 3% Serbian 2%
- Foreign-born
- 3% · Canada
- Languages at home
- 91% English-only · Spanish 8% Other Indo-European 1%
Political lean MEDSL · Calaveras
- 2024 margin
- Strong R (+28.1) · D 34.7% · R 62.8% · Other 2.5%
- 2008→2024 swing
- -15.2pp toward R · 2008: -13.0pp · 2024: -28.1pp
- All cycles
- 2024: R+28.1 2020: R+23.8 2016: R+23.9 2012: R+17.0 2008: R+13.0
Not yet ingested
- Civics
- —
Market trends
- HPI YoY
- ▼ -118.93%
- Current HPI
- 137.7432
- Rent YoY
- —
- Metro
- —
- State GDP YoY
- ▲ 3.21%
- F500 in state
- 116
Industry mix (Fortune 500 HQ in CA)
| Industry | F500 HQs | Revenue |
|---|---|---|
| Technology | 27 | $1,492B |
|
||
| Financial Services | 3 | $174B |
|
||
| Retail | 3 | $44B |
|
||
| Insurance | 3 | $26B |
|
||
| Media / Entertainment | 2 | $115B |
|
||
| Pharmaceuticals / Biotech | 2 | $62B |
|
||
Cash-flow waterfall
monthlySold comps — $/sqft
last 12 mo · ≤1 miLoading sold comps…