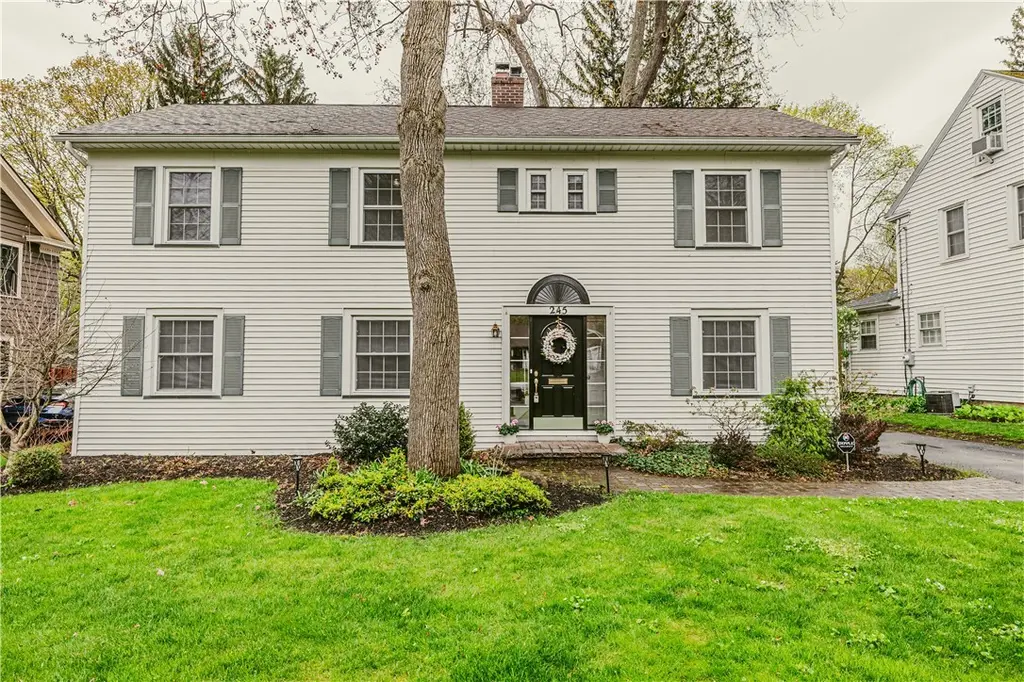
245 Nunda Blvd · Rochester, NY
Flood risk 1/10 · Minimal
- FEMA flood zone
- X (unshaded)
- Chance of flooding over 30 yrs
- 0.0%
- Est. flood insurance / yr
- $473 – $860
Fire risk 1/10 · Minimal
- Est. fire insurance / yr
- $691 – $1,283
Heat risk 2/10 · Minimal
- Hot days now (above 95°F)
- 7 days/yr
- Hot days in 30 yrs
- 15 days/yr
Wind risk 1/10 · Minimal
- Chance of severe wind over 30 yrs
- —
Air-quality risk 2/10 · Minimal
- Unhealthy air days now
- 1 days/yr
- Unhealthy air days in 30 yrs
- 1 days/yr
Risk factors via First Street. Map © Google.
Why this score? — see what drove the D grade
The composite is a weighted blend of 9 inputs, each scored 0–100. Each bar is that input's sub-score; the figure is the points it added to the 100-point composite (weight × sub-score).
- ARV discount +13.7/15.0
- Cash flow +11.7/30.0
- Livability +3.8/5.0
- DSCR +3.4/10.0
- Rent growth +3.2/5.0
- 1% rule +2.6/10.0
- Condition / age +2.5/5.0
- Schools +1.9/10.0
- Appreciation +0.0/10.0
$364,900
🖨 Deal sheet 📄 Offer letter ✓ Due diligence
Listing remarks
Welcome to 245 Nunda Boulevard, where timeless architecture and inviting spaces come together in one of Rochester’s most charming neighborhoods! This 3-bedroom, 1.5-bath home is filled with character at every turn, offering a layout that feels both distinctive and easy to live in. The main level unfolds with a natural sense of balance and flow. On one side, a sunlit living room centered around a wood-burning fireplace creates a warm, welcoming focal point, seamlessly connecting to a family room highlighted by a striking spiral staircase that adds both visual interest and architectural flair. On the other side, a formal dining room offers an elegant setting for gatherings and opens dir
Key facts
- Screened in porch
- Unfinished basement
- Private patio
Tags
Property features AI
Exterior
- Parking: Detached garage; Two garage spaces
- Utilities: Public water (connected); Sewer connected; Circuit breaker electrical service
- Home design: Two-story home; Resale property; Vinyl siding; Irregular residential lot with city street frontage (66 x 148)
- Construction: Block foundation; Vinyl siding exterior; Existing construction
- Exterior features: Blacktop driveway; Porch; Patio; Screened porch/patio
Interior
- Kitchen: Gas oven; Gas range; Microwave; Dishwasher; Refrigerator
- Bedrooms: Upper level laundry (building has 8 total rooms including living and family areas)
- Flooring: Hardwood; Tile; Varies
- Bathrooms: One full bathroom; One half bathroom
- Heating & cooling: Forced air heating (electric); Central air conditioning
- Interior features: Separate/formal dining room; Separate/formal living room; Full basement
- Laundry & utility: Washer and dryer; Laundry located on upper level; Gas water heater
Neighborhood map
What this means for you Summary
Snapshot
- This is a 4-bed/1.5-bath single-family listed at $365k.
Deal economics
- At list price, monthly cash flow is $-108 ($-1k/yr) — negative.
- To cash-flow at today's rent, offer at most $346k (5.2% below list).
- To meet the 1% rule (rent ≥ 1% of price), the offer needs to be $278k (23.8% below list).
- Recommended offer: $278k (23.8% below list) — sets the bar for 1% rule.
- Cap rate 5.9% vs local median 9.3% in Rochester — below-typical yield; the buyer is paying a premium for something (appreciation thesis, condition, location) that the cap rate doesn't capture.
Location & tenants
- Location reads 76/100 on livability (#222 in NY, #3,482 nationally) — a middle-class / working-renter tenant base. Strengths: commute A+, cost of living A+, housing A+; Watch: schools D+, crime F, employment F.
- Rochester City School District (urban): math 21% / reading 26% proficiency, ranked #589 of 590 in NY (top 100%) — low school quality limits family demand, transient renter base, plan for 1-2y turnover; 82% free/reduced lunch — lower-income household profile, screen leases tightly.
- Market conditions: Rents rising (+2.7%/yr); 85 active listings in the ZIP; 8 comparable units currently listed for rent nearby; rentals at typical pace (median 14d on market — plan ~3-4 weeks tenant-placement turnaround); solid renter incomes; 1,169 units permitted in Monroe County in 2024 (591 in 5+ unit buildings).
- This rent runs 39% of the median local income ($86k/yr) — at the standard rent-burdened threshold; future hikes will face affordability resistance.
Forward outlook
- Local home prices are declining (-3.0%/yr); year-one equity from $3k of loan paydown is wiped out by about $11k of value loss. Plan a longer hold.
- Monroe County population projected to shrink 6% by 2050 — rents likely to lag national; underwrite the cash flow, not the appreciation.
Negotiation context
- Only 5 days on market — expect competitive offers; lowballing is unlikely to land.
- 2 sale attempts with the ask held roughly flat each time — persistent listings suggest the price (not the market) is what's stuck; bring a comps-based counter.
Risks & watch-outs
- Watch-outs: built in 1926 — expect roof / HVAC / electrical / plumbing capex.
Questions for the listing agent
- What do current leases actually rent for vs. the listed asking? Can we see a recent rent roll and the last 12 months of T-12 income?
- Built in 1926 — when were the roof, HVAC, electrical panel, plumbing, and water heater last replaced?
- Is there a deadline driving the sale (1031 exchange, divorce, estate, relocation)? That informs how much negotiation room exists.
- Schools are D-rated, which usually means shorter tenancies and higher turnover. Who's the typical renter profile here, and what's been the actual vacancy rate?
- Crime grade is F in this area — have there been break-ins, vandalism, or insurance claims at this property in the last 3 years? What carrier currently insures it and at what premium?
- The area grade is low — what's the realistic commute time and amenity access for the typical tenant pool here? Any planned neighborhood developments (good or bad) we should know about?
- What's the average days-on-market for RENTAL listings here right now (not sales)? A rising rental-DOM trend means longer vacancies and softer asking-rent achievability than the comps imply.
- What's the recent tenant-quality profile in this submarket — average credit score on applications, eviction rate, late-payment / NSF rate, and stable-employment percentage? A property-management company in the area should have these aggregated.
- How much new for-sale + rental construction is in the pipeline within 1–3 miles? Heavy new supply typically softens prices + rents 12–24 months out; constrained supply supports both.
Investment metrics
- 1% rule
- 0.76% ✗
- Cap rate
- 5.94%
- Cash-on-cash
- -1.26%
- DSCR
- 0.94
- GRM
- 10.9
CMA / ARV
- ARV (median comp)
- $422,702
- List price
- $364,900
- Delta
- -13.67%
- Verdict
- UNDERPRICED
- Comps
- 20 within 1.0 mi
Show comp detail 12 sales within ~0.75 mi
| Address | Dist | Beds/Ba | Sqft | Sold | Price | $/sf | Match |
|---|---|---|---|---|---|---|---|
| 245 Nunda Blvd | 0.00mi | 3/1.5 (-1) | 1,848 (0%) | 0mo | $365,000 | $198 | 95 |
| 421 Kimberly Dr | 0.48mi | 4/2.0 | 1,846 (-0%) | 2mo | $490,000 | $265 | 74 |
| 360 San Gabriel Dr | 0.15mi | 4/2.5 | 1,735 (-6%) | 6mo | $375,000 | $216 | 74 |
| 130 San Gabriel Dr | 0.24mi | 3/2.5 (-1) | 1,916 (+4%) | 4mo | $500,000 | $261 | 70 |
| 15 Nunda Blvd | 0.33mi | 3/2.0 (-1) | 1,870 (+1%) | 11mo | $399,000 | $213 | 66 |
| 1120 Park Ave | 0.64mi | 4/1.0 | 1,928 (+4%) | 2mo | $363,100 | $188 | 59 |
| 168 Village Ln | 0.49mi | 3/2.0 (-1) | 1,744 (-6%) | 3mo | $351,000 | $201 | 58 |
| 2475 Highland Ave | 0.52mi | 3/3.0 (-1) | 1,832 (-1%) | 6mo | $590,000 | $322 | 58 |
| 405 Winton Rd S | 0.21mi | 3/1.5 (-1) | 1,576 (-15%) | 5mo | $350,000 | $222 | 56 |
| 364 Hillside Ave | 0.27mi | 3/2.5 (-1) | 1,644 (-11%) | 8mo | $400,000 | $243 | 53 |
| 170 Glen Ellyn Way | 0.68mi | 3/1.5 (-1) | 1,917 (+4%) | 5mo | $450,000 | $235 | 53 |
| 745 Winton Rd S | 0.67mi | 3/2.5 (-1) | 2,000 (+8%) | 2mo | $480,072 | $240 | 44 |
Match score weights: distance 35% · size 25% · config 20% · recency 20%. Top-matched comps best support the ARV.
Projected returns pro-forma
-3.0% appreciation · 2.72% rent growth · sell at horizon
- IRR
- -18.7%
- Equity multiple
- 0.35×
- Total profit
- $-66,855
- Equity at exit
- $54,408
- IRR
- -11.7%
- Equity multiple
- 0.31×
- Total profit
- $-70,601
- Equity at exit
- $31,550
Cash invested: $102,172 (down + closing). Projections, not guarantees.
Landlord ↔ Tenant lean methodology
- Overall (STATE)
- 15 Strongly Tenant-Friendly
- State New York
- 15 Strongly Tenant-Friendly · D+10
- County
- — inherits STATE
- City
- — inherits STATE
ZIP-level market 14610
- Home prices YoY
- -23.6%
- Rents YoY
- 2.7%
- Active inventory
- 85
- Price-to-rent
- 10.9×
Monthly cashflow live
- Estimated rent
- $2,780 high interval (Pro) →
- Mortgage (P&I)
- −$1,914
- Tax from tax record
- −$238 /mo · $2,861/yr
- Insurance
- −$152
- HOA
- −$0
- Vacancy / Maint / Mgmt
- −$584
- Net cashflow
- $-108
Break-even live
UW: 25.0% down · 7.5% · 30yr · 1.5% tax · 5.0% vac · 8.0% maint · 8.0% mgmt
Financing live
Cash to close
- Down payment
- $91,225
- Closing costs
- $10,947
- Reserves months
- —
- Total cash needed
- —
Loan-product check · same deal, 3 products live
Conventional
25% down · 7.5% · 30yr
- Down + closing
- —
- Monthly P&I
- —
- Monthly cashflow
- —
- DSCR
- —
- Eligible?
- —
Personal DTI + credit; lowest rate.
DSCR
20% down · 8.5% · 30yr
- Down + closing
- —
- Monthly P&I
- —
- Monthly cashflow
- —
- DSCR
- —
- Eligible?
- —
No personal income docs; deal must DSCR.
Hard money
10% down · 12.0% · 12mo
- Down + closing
- —
- Monthly P&I
- —
- Monthly cashflow
- —
- DSCR
- —
- Eligible?
- —
Short-term bridge; refi at stabilization.
Rent comps 8 comps
| Address | Beds | Baths | Sqft | Rent | $/sqft | DOM | Units | Dist |
|---|---|---|---|---|---|---|---|---|
| 1600 East Ave Rochester, NY | 3.0 | 1.0–2.0 | 944 | $2,875 | $3.04 | 2d | 1 | 0.57mi |
| 57 Calumet St Rochester, NY | 3.0 | 3.0 | 2500 | $2,250 | $0.90 | 14d | 1 | 0.79mi |
| 28 Chelmsford Rd Rochester, NY | 3.0 | 1.5 | 1365 | $3,100 | $2.27 | 43d | 1 | 0.87mi |
| 214 Culver Rd Apt 2 Rochester, NY | 3.0 | 1.0 | 1700 | $2,400 | $1.41 | 14d | 1 | 0.92mi |
| 2500 East Ave Rochester, NY | 3.0 | 1.0–3.0 | 1171 | $2,520 | $2.15 | 2d | 17 | 0.94mi |
| 36 Morningside Park Rochester, NY | 4.0 | 1.0 | 1446 | $2,400 | $1.66 | 3d | 1 | 1.06mi |
| 130 Brooklawn Dr Rochester, NY | 3.0 | 1.0 | 1380 | $2,950 | $2.14 | 43d | 1 | 1.32mi |
| 34 Shepard St Rochester, NY | 4.0 | 1.5 | 2347 | $800 | $0.34 | 43d | 1 | 1.33mi |
Listing history 9 events
-
2026-05-05status Pending 1818-char remark
-
2026-04-30$364,900 Active 1818-char remark
-
2025-11-06historical
-
2025-10-31price $365,000
-
2025-10-10price $384,900
-
2025-10-01$399,900 Active
-
2008-08-29soldstatus $170,000
-
1998-07-31soldstatus $99,900
-
1994-08-08soldstatus $102,000
ⓘ Source: listings_history table (triggers on properties + properties_extension) + one-shot
backfill from property_details.listing_events for pre-trigger history.
Tax reassessment forecast NY · Partial reset (capped growth)
- Current annual tax
- $2,861 · $238/mo
- Projected year-2 tax
- $4,514 · $376/mo
- Expected delta
- +$1,653/yr (+$138/mo · 57.8%)
ⓘ Screening estimate from a state-policy table — verify with the county assessor before closing.
Climate risk First Street
- Flood 1/10 Low FEMA zone X (unshaded) · 0% chance over 30 yrs
- Wildfire 1/10 Low
- Heat 2/10 Low 7 d/yr ≥95°F today · 15 d/yr by 30 yrs out
- Wind 1/10 Low
- Air quality 2/10 Low 1 unhealthy d/yr today · 1 by 30 yrs out
Nearby sold comps map
Loading sold comps map…
Walkable amenities ~0.75 mi
Loading nearby amenities…
Taxation est. · year 1
- Rental income
- $33,364
- − Mortgage interest
- −$20,440
- − Property taxes
- −$2,861
- − Insurance
- −$1,824
- − Repairs & maintenance
- −$2,669
- − Management
- −$2,669
- − Depreciation
- −$10,615
- Taxable loss
- −$7,715
- Est. tax savings @ 24.0%
- +$1,852
- After-tax cash flow
- $561/yr
For passive investors: Depreciation is non-cash, so a rental often shows a tax loss while cash-flowing — sheltering income. Rental losses are passive: they offset passive income freely, and up to $25,000/yr can offset ordinary (W-2) income if you actively participate and your MAGI is under $100k (phasing out to $0 by $150k); unused losses carry forward. On sale, claimed depreciation is recaptured at up to 25%, and gains may owe capital-gains tax (a 1031 exchange can defer both). Figures are a year-1 estimate at your 24.0% rate — not tax advice; consult a CPA.
Schools (NCES district)
- District
- Rochester City School District
- NCES district ID
- 3624750
- Math proficiency
- 21% ▬ 0.00%
- Reading proficiency
- 26% ▲ 4.00%
- Median HH income
- $30,923
- Composite
- 18.98/100
- National rank
- #8850
- State rank
- #589 of 590 in NY
Livability — Rochester
- Score
- 76/100
- State rank
- #222
- US rank
- #3482
Category grades
Schools grade is shown separately in the Schools card above.
Census & demographics
- Census place
- Rochester, NY
- County
- Monroe County · 674,131 people
- City population
- 432,803
- Metro
- Rochester, NY
- Population (ZIP)
- 14,311
- Household income
- $85,961
- Rent vs Own
- Severe rent burden
- 923.0
Population outlook (Monroe County) Hauer SSP2
- Today (2025)
- 759,460 people
- By 2030
- 757,154 · -0.3%
- By 2040
- 740,644 · -2.5%
- By 2050
- 714,443 · -5.9%
- By 2075
- 645,883 · -15.0%
- By 2100
- 547,084 · -28.0%
Race, ethnicity, and origin ACS 2023
- Neighborhood character
- Predominantly White (81%)
- Race & ethnicity
- White 81% Black 6% Hispanic / Latino 6% Two or more races 6% Asian 3%
- Hispanic origin (detail)
- Puerto Rican 2%
- Common ancestry
- Romanian 6% Iranian 4% Scotch-Irish 2%
- Foreign-born
- 7% · Canada, South Korea
- Languages at home
- 92% English-only · Spanish 2% Russian/Polish/Slavic 1% Other Indo-European 1%
Political lean MEDSL · Monroe
- 2024 margin
- D (+19.1) · D 59.5% · R 40.5%
- 2008→2024 swing
- +1.4pp toward D · 2008: 17.7pp · 2024: 19.1pp
- All cycles
- 2024: D+19.1 2020: D+21.0 2016: D+14.1 2012: D+17.4 2008: D+17.7
Not yet ingested
- Civics
- —
Market trends
- HPI YoY
- ▼ -86.64%
- Current HPI
- 280.8593
- Rent YoY
- ▲ 2.72%
- Metro
- Rochester, NY
- State GDP YoY
- ▲ 2.60%
- F500 in state
- 92
Industry mix (Fortune 500 HQ in NY)
| Industry | F500 HQs | Revenue |
|---|---|---|
| Financial Services | 10 | $950B |
|
||
| Consumer Goods | 9 | $162B |
|
||
| Insurance | 4 | $225B |
|
||
| Telecommunications | 2 | $144B |
|
||
| Pharmaceuticals | 2 | $112B |
|
||
| Media / Entertainment | 2 | $69B |
|
||
Price history
+257.8% since first listed10 events — show timeline
- 2026-06-05 Sold (MLS) $365,000 UNYREIS
- 2026-05-05 Pending — UNYREIS
- 2026-04-30 Listed $364,900 UNYREIS
- 2025-11-06 Listing Removed — UNYREIS
- 2025-10-31 Price Changed $365,000 UNYREIS
- 2025-10-10 Price Changed $384,900 UNYREIS
- 2025-10-01 Listed $399,900 UNYREIS
- 2008-08-29 Sold (Public Records) $170,000 Public Records
- 1998-07-31 Sold (Public Records) $99,900 Public Records
- 1994-08-08 Sold (Public Records) $102,000 Public Records
Property tax history
+2.3%/yrLatest (2025): $2,861 · -5.5% YoY. Source: county tax records.
Cash-flow waterfall
monthlySold comps — $/sqft
last 12 mo · ≤1 miLoading sold comps…