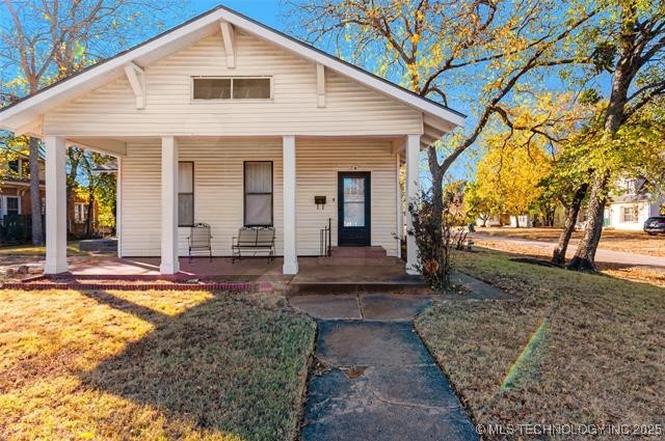
921 D St NW · Ardmore, OK
Flood risk 1/10 · Minimal
- FEMA flood zone
- X (unshaded)
- Chance of flooding over 30 yrs
- 0.0%
- Est. flood insurance / yr
- $507 – $1,088
Fire risk 3/10 · Minor
- Est. fire insurance / yr
- $2,463 – $4,575
Heat risk 6/10 · Moderate
- Hot days now (above 112°F)
- 7 days/yr
- Hot days in 30 yrs
- 20 days/yr
Wind risk 4/10 · Minor
- Chance of severe wind over 30 yrs
- 10.0%
Air-quality risk 3/10 · Minor
- Unhealthy air days now
- 2 days/yr
- Unhealthy air days in 30 yrs
- 3 days/yr
Risk factors via First Street. Map © Google.
Why this score? — see what drove the B grade
The composite is a weighted blend of 9 inputs, each scored 0–100. Each bar is that input's sub-score; the figure is the points it added to the 100-point composite (weight × sub-score).
- Cash flow +30.0/30.0
- ARV discount +15.0/15.0
- DSCR +10.0/10.0
- 1% rule +8.2/10.0
- Rent growth +4.3/5.0
- Livability +2.9/5.0
- Condition / age +2.5/5.0
- Schools +1.1/10.0
- Appreciation +0.0/10.0
$120,000
🖨 Deal sheet 📄 Offer letter ✓ Due diligence
Listing remarks
Back on the market through no fault of the seller or home! Opportunity awaits with this spacious 4-bedroom, 2-bath home situated on a corner lot in a historic and convenient location. Overlooking the peaceful Selvidge Park, this property offers timeless charm and great potential for updates or investment. Inside, you’ll find a welcoming layout featuring a formal dining room with built-in storage and versatile living spaces—ideal for family life, a home office, or guest accommodations. The covered front porch is perfect for relaxing and enjoying the park views, while the detached 2-car garage provides additional parking and storage. The generous lot features mature landscaping,
Key facts
- Covered front porch
- Formal dining room
- Corner lot
Tags
Property features AI
Exterior
- Parking: Detached garage; 2 garage spaces
- Security: No safety shelter
- Utilities: Cable available; Electricity available; Natural gas available; Public water; Public sewer
- Home design: Single-story; Faces east; Crawlspace foundation
- Construction: Vinyl siding; Wood frame construction; Asphalt/fiberglass roof; Built (year per public records)
- Exterior features: Covered patio/porch; Deck; Patio; Porch; Corner lot
Interior
- Kitchen: Cooktop; Double oven; Oven; Range; Dishwasher; Disposal
- Flooring: Laminate; Tile; Vinyl
- Bathrooms: 2 full bathrooms
- Heating & cooling: Central heating (gas); Central air conditioning
- Interior features: High ceilings; Laminate counters; Ceiling fan(s); Aluminum framed windows
- Laundry & utility: Gas water heater
Neighborhood map
What this means for you Summary
Snapshot
- This is a 4-bed/2.0-bath single-family listed at $120k.
Deal economics
- At list price, monthly cash flow is $517 ($6k/yr) — positive.
- The deal already cash-flows at list — no discount required.
- Meets the 1% rule at list price ($2k rent vs $120k).
- Recommended offer: $106k (12.0% below list) — sets the bar for market timing.
- Cap rate 11.5% vs local median 4.6% in Ardmore — top-decile yield for the area; either an underpriced asset or a hidden risk that comps aren't pricing in. Stress-test before assuming the spread holds.
Location & tenants
- Location reads 58/100 on livability (#447 in OK) — a working-class tenant base; expect higher turnover. Strengths: cost of living A+, housing A+; Watch: schools F, crime F, amenities F.
- Ardmore (town): math 12% / reading 15% proficiency, ranked #241 of 270 in OK (top 89%) — low school quality limits family demand, transient renter base, plan for 1-2y turnover; 73% free/reduced lunch — lower-income household profile, screen leases tightly.
- Market conditions: Rents rising fast (+7.4%/yr); 379 active listings in the ZIP; 73 units permitted in Carter County in 2024 (0 in 5+ unit buildings).
- This rent runs 31% of the median local income ($62k/yr) — at the standard rent-burdened threshold; future hikes will face affordability resistance.
Forward outlook
- Local home prices are declining (-3.0%/yr); year-one equity from $830 of loan paydown is wiped out by about $4k of value loss. Plan a longer hold.
- Carter County population projected at +9% by 2050 — modest demand growth; plan on rents tracking national, not racing it.
- At projected returns (-3.0% appreciation + 7.4% rent growth), your $34k cash investment doubles in ~6 years — after that, you're playing with house money.
Negotiation context
- It's been on market 222 days — a 12% lower offer ($106k) is reasonable based on typical stale-listing flexibility.
- 5 sale attempts since 2y ago; this cycle's ask has dropped $115k (49%) from the opening price — seller is motivated, your offer sets the floor, not the list.
Risks & watch-outs
- Watch-outs: built in 1950 — expect roof / HVAC / electrical / plumbing capex.
- Climate carrying-cost: extreme-heat days projected 7→20/yr by 2055 (HVAC capex compounding) — expect insurance premiums to compound above CPI over the hold.
Questions for the listing agent
- It's been on market 222 days. Have you received any prior offers? Is the seller open to a 12% concession, seller financing, or rate buy-down credit?
- Built in 1950 — when were the roof, HVAC, electrical panel, plumbing, and water heater last replaced?
- Why hasn't it sold? Are there any deal-killer items the seller is aware of (foundation, flood, title, zoning, code violations)?
- Is there a deadline driving the sale (1031 exchange, divorce, estate, relocation)? That informs how much negotiation room exists.
- Schools are F-rated, which usually means shorter tenancies and higher turnover. Who's the typical renter profile here, and what's been the actual vacancy rate?
- Crime grade is F in this area — have there been break-ins, vandalism, or insurance claims at this property in the last 3 years? What carrier currently insures it and at what premium?
- What's the average days-on-market for RENTAL listings here right now (not sales)? A rising rental-DOM trend means longer vacancies and softer asking-rent achievability than the comps imply.
- What's the recent tenant-quality profile in this submarket — average credit score on applications, eviction rate, late-payment / NSF rate, and stable-employment percentage? A property-management company in the area should have these aggregated.
- How much new for-sale + rental construction is in the pipeline within 1–3 miles? Heavy new supply typically softens prices + rents 12–24 months out; constrained supply supports both.
Investment metrics
- 1% rule
- 1.32% ✓
- Cap rate
- 11.46%
- Cash-on-cash
- 18.47%
- DSCR
- 1.82
- GRM
- 6.3
CMA / ARV
- ARV (on-the-fly)
- $194,582
- Comps found
- 12
Show comp detail 12 sales within ~0.75 mi
| Address | Dist | Beds/Ba | Sqft | Sold | Price | $/sf | Match |
|---|---|---|---|---|---|---|---|
| 1006 NW C | 0.12mi | 4/2.0 | 1,830 (-9%) | 5mo | $178,000 | $97 | 75 |
| 802 Burch St NW | 0.19mi | 3/2.5 (-1) | 1,952 (-3%) | 12mo | $225,000 | $115 | 70 |
| 415 4th Ave NW | 0.37mi | 4/3.0 | 1,998 (-0%) | 11mo | $200,000 | $100 | 68 |
| 901 Wolverton | 0.25mi | 3/2.0 (-1) | 1,854 (-8%) | 3mo | $110,000 | $59 | 68 |
| 405 4th NW | 0.38mi | 3/3.0 (-1) | 1,926 (-4%) | 7mo | $229,000 | $119 | 61 |
| 1426 Chickasaw Blvd | 0.52mi | 3/1.0 (-1) | 2,088 (+4%) | 12mo | $62,699 | $30 | 50 |
| 627 G St NW | 0.34mi | 3/2.0 (-1) | 1,818 (-9%) | 19mo | $172,900 | $95 | 48 |
| 1722 Essex St | 0.67mi | 4/2.0 | 2,212 (+10%) | 7mo | $180,000 | $81 | 45 |
| 25 Hillcrest | 0.65mi | 4/1.0 | 1,728 (-14%) | 1mo | $210,000 | $122 | 42 |
| 1518 N Washington St | 0.66mi | 3/2.0 (-1) | 2,234 (+11%) | 8mo | $65,000 | $29 | 39 |
| 1714 Salisbury | 0.65mi | 3/2.0 (-1) | 1,740 (-13%) | 5mo | $175,000 | $101 | 39 |
| 815 Campbell St | 0.74mi | 3/2.5 (-1) | 1,746 (-13%) | 2mo | $169,000 | $97 | 36 |
Match score weights: distance 35% · size 25% · config 20% · recency 20%. Top-matched comps best support the ARV.
Projected returns pro-forma
-3.0% appreciation · 7.38% rent growth · sell at horizon
- IRR
- 14.7%
- Equity multiple
- 1.62×
- Total profit
- $20,721
- Equity at exit
- $17,892
- IRR
- 26.3%
- Equity multiple
- 3.77×
- Total profit
- $92,934
- Equity at exit
- $10,375
Cash invested: $33,600 (down + closing). Projections, not guarantees.
Landlord ↔ Tenant lean methodology
- Overall (STATE)
- 83 Strongly Landlord-Friendly
- State Oklahoma
- 83 Strongly Landlord-Friendly · R+20
- County
- — inherits STATE
- City
- — inherits STATE
ZIP-level market 73401
- Home prices YoY
- -21.7%
- Rents YoY
- 7.4%
- Active inventory
- 379
- Price-to-rent
- 6.3×
Monthly cashflow live
- Estimated rent
- $1,578 medium interval (Pro) →
- Mortgage (P&I)
- −$629
- Tax from tax record
- −$50 /mo · $606/yr
- Insurance
- −$50
- HOA
- −$0
- Vacancy / Maint / Mgmt
- −$331
- Net cashflow
- $517
Break-even live
UW: 25.0% down · 7.5% · 30yr · 1.5% tax · 5.0% vac · 8.0% maint · 8.0% mgmt
Financing live
Cash to close
- Down payment
- $30,000
- Closing costs
- $3,600
- Reserves months
- —
- Total cash needed
- —
Loan-product check · same deal, 3 products live
Conventional
25% down · 7.5% · 30yr
- Down + closing
- —
- Monthly P&I
- —
- Monthly cashflow
- —
- DSCR
- —
- Eligible?
- —
Personal DTI + credit; lowest rate.
DSCR
20% down · 8.5% · 30yr
- Down + closing
- —
- Monthly P&I
- —
- Monthly cashflow
- —
- DSCR
- —
- Eligible?
- —
No personal income docs; deal must DSCR.
Hard money
10% down · 12.0% · 12mo
- Down + closing
- —
- Monthly P&I
- —
- Monthly cashflow
- —
- DSCR
- —
- Eligible?
- —
Short-term bridge; refi at stabilization.
Listing history 20 events
-
2026-06-07statusdays on market $120,000 Pending 222 DOM
-
2026-06-05days on market $120,000 Active 221 DOM
-
2026-06-03days on market $120,000 Active 220 DOM
-
2026-06-02days on market $120,000 Active 219 DOM
-
2026-06-01days on market $120,000 Active 218 DOM
-
2026-05-31days on market $120,000 Active 217 DOM
-
2026-05-30days on market $120,000 Active 216 DOM
-
2026-05-21status Active
-
2026-05-18status Pending
-
2026-04-30price $120,000
-
2025-10-27status Active
-
2025-10-11status Pending
-
2025-10-06price $134,900
-
2025-10-04$234,900 Active
-
2025-07-18historical
-
2025-06-20price $149,900
-
2025-04-04status Active
-
2025-03-10status Pending
-
2025-01-17price $159,900
-
2024-10-20$169,900 Active
ⓘ Source: listings_history table (triggers on properties + properties_extension) + one-shot
backfill from property_details.listing_events for pre-trigger history.
Tax reassessment forecast OK · Resets to sale price
- Current annual tax
- $606 · $50/mo
- Projected year-2 tax
- $1,080 · $90/mo
- Expected delta
- +$474/yr (+$40/mo · 78.2%)
ⓘ Screening estimate from a state-policy table — verify with the county assessor before closing.
Climate risk First Street
- Flood 1/10 Low FEMA zone X (unshaded) · 0% chance over 30 yrs
- Wildfire 3/10 Moderate
- Heat 6/10 Major 7 d/yr ≥112°F today · 20 d/yr by 30 yrs out
- Wind 4/10 Moderate 10% chance of damaging wind over 30 yrs
- Air quality 3/10 Moderate 2 unhealthy d/yr today · 3 by 30 yrs out
Nearby sold comps map
Loading sold comps map…
Walkable amenities ~0.75 mi
Loading nearby amenities…
Taxation est. · year 1
- Rental income
- $18,942
- − Mortgage interest
- −$6,722
- − Property taxes
- −$606
- − Insurance
- −$600
- − Repairs & maintenance
- −$1,515
- − Management
- −$1,515
- − Depreciation
- −$3,491
- Taxable income
- $4,492
- Est. tax owed @ 24.0%
- −$1,078
- After-tax cash flow
- $5,128/yr
For passive investors: Depreciation is non-cash, so a rental often shows a tax loss while cash-flowing — sheltering income. Rental losses are passive: they offset passive income freely, and up to $25,000/yr can offset ordinary (W-2) income if you actively participate and your MAGI is under $100k (phasing out to $0 by $150k); unused losses carry forward. On sale, claimed depreciation is recaptured at up to 25%, and gains may owe capital-gains tax (a 1031 exchange can defer both). Figures are a year-1 estimate at your 24.0% rate — not tax advice; consult a CPA.
Schools (NCES district)
- District
- Ardmore
- NCES district ID
- 4003180
- Math proficiency
- 12% ▼ -7.00%
- Reading proficiency
- 15% ▼ -6.00%
- Median HH income
- $35,194
- Composite
- 11.1/100
- National rank
- #9733
- State rank
- #241 of 270 in OK
Livability — Ardmore
- Score
- 58/100
- State rank
- #447
- US rank
- #21387
Category grades
Schools grade is shown separately in the Schools card above.
Census & demographics
- Census place
- Ardmore, OK
- County
- Carter County · 36,833 people
- City population
- 36,833
- Metro
- Ardmore, OK
- Population (ZIP)
- 36,833
- Household income
- $61,989
- Rent vs Own
- Severe rent burden
- 1026.0
Population outlook (Carter County) Hauer SSP2
- Today (2025)
- 50,892 people
- By 2030
- 51,913 · +2.0%
- By 2040
- 53,857 · +5.8%
- By 2050
- 55,604 · +9.3%
- By 2075
- 60,670 · +19.2%
- By 2100
- 62,366 · +22.5%
Race, ethnicity, and origin ACS 2023
- Neighborhood character
- Diverse neighborhood (Simpson 0.57)
- Race & ethnicity
- White 65% Two or more races 14% Hispanic / Latino 9% Native American 8% Black 7% Asian 1%
- Hispanic origin (detail)
- Mexican 7%
- Common ancestry
- Slovak 2% Lithuanian 1% Italian 1%
- Foreign-born
- 4% · Canada
- Languages at home
- 92% English-only · Spanish 5%
Political lean MEDSL · Carter
- 2024 margin
- Solid R (+54.7) · D 21.9% · R 76.7% · Other 1.4%
- 2008→2024 swing
- -14.2pp toward R · 2008: -40.5pp · 2024: -54.7pp
- All cycles
- 2024: R+54.7 2020: R+52.5 2016: R+52.6 2012: R+42.7 2008: R+40.5
Not yet ingested
- Civics
- —
Market trends
- HPI YoY
- ▼ -74.93%
- Current HPI
- 269.7381
- Rent YoY
- ▲ 7.38%
- Metro
- Ardmore, OK
- State GDP YoY
- ▲ 1.55%
- F500 in state
- 6
Industry mix (Fortune 500 HQ in OK)
| Industry | F500 HQs | Revenue |
|---|---|---|
| Energy | 3 | $48B |
|
||
Price history
-29.4% since first listed13 events — show timeline
- 2026-05-21 Relisted — MLS Technology, Inc.
- 2026-05-18 Pending — MLS Technology, Inc.
- 2026-04-30 Price Changed $120,000 MLS Technology, Inc.
- 2025-10-27 Relisted — MLS Technology, Inc.
- 2025-10-11 Pending — MLS Technology, Inc.
- 2025-10-06 Price Changed $134,900 MLS Technology, Inc.
- 2025-10-04 Listed $234,900 MLS Technology, Inc.
- 2025-07-18 Listing Removed — MLS Technology, Inc.
- 2025-06-20 Price Changed $149,900 MLS Technology, Inc.
- 2025-04-04 Relisted — MLS Technology, Inc.
- 2025-03-10 Pending — MLS Technology, Inc.
- 2025-01-17 Price Changed $159,900 MLS Technology, Inc.
- 2024-10-20 Listed $169,900 MLS Technology, Inc.
Property tax history
+6.1%/yrLatest (2025): $606 · +3.6% YoY. Source: county tax records.
Cash-flow waterfall
monthlySold comps — $/sqft
last 12 mo · ≤1 miLoading sold comps…