 🏷️ Likely Rental
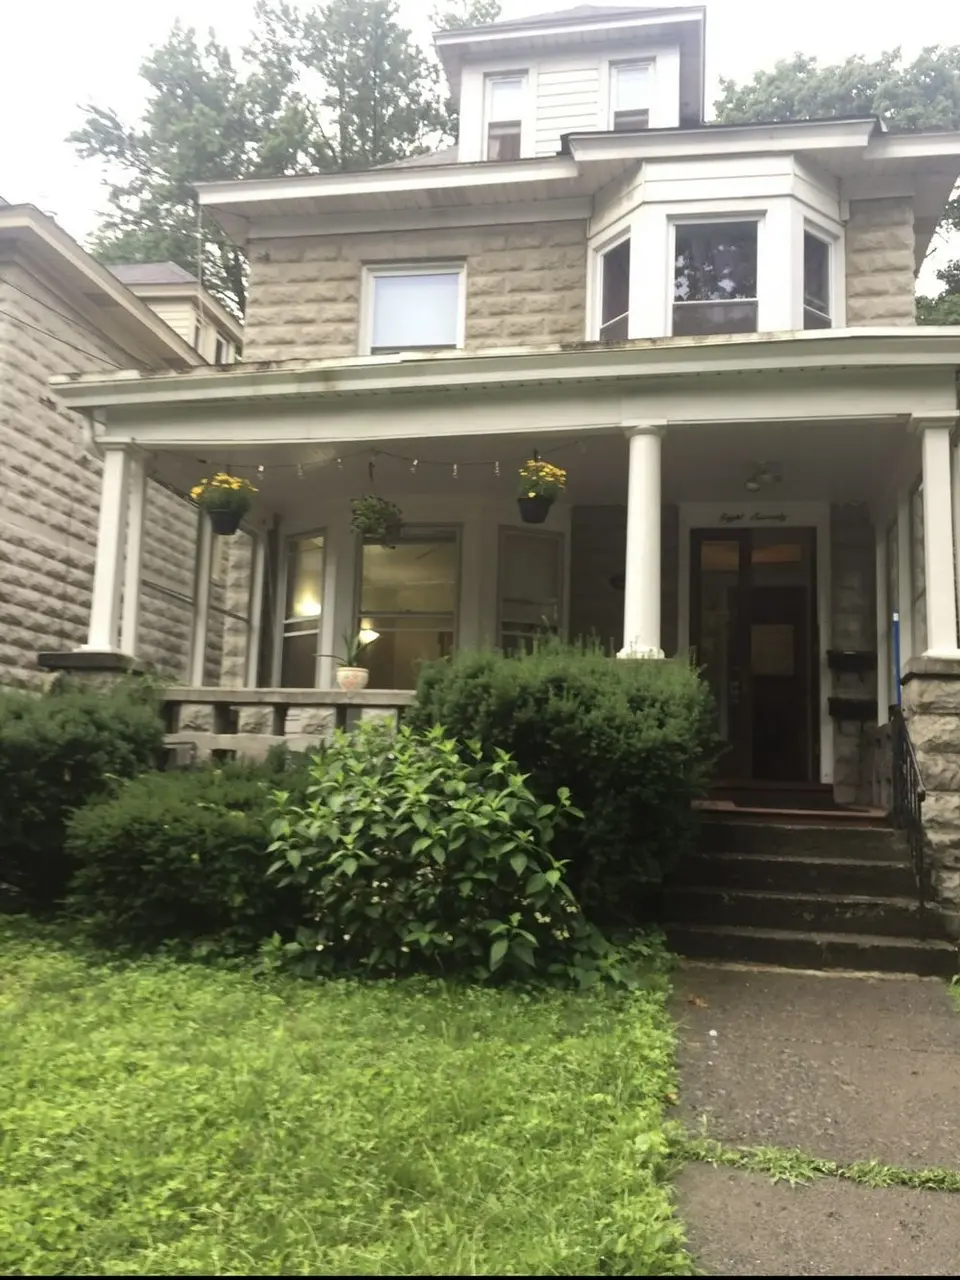
870 Lancaster St · Albany, NY
Flood risk 1/10 · Minimal
- FEMA flood zone
- X (unshaded)
- Chance of flooding over 30 yrs
- 0.0%
- Est. flood insurance / yr
- $473 – $860
Fire risk 1/10 · Minimal
- Est. fire insurance / yr
- $691 – $1,283
Heat risk 4/10 · Minor
- Hot days now (above 97°F)
- 7 days/yr
- Hot days in 30 yrs
- 16 days/yr
Wind risk 3/10 · Minor
- Chance of severe wind over 30 yrs
- 6.0%
Air-quality risk 1/10 · Minimal
- Unhealthy air days now
- 0 days/yr
- Unhealthy air days in 30 yrs
- 0 days/yr
Risk factors via First Street. Map © Google.
Why this score? — see what drove the D grade
The composite is a weighted blend of 9 inputs, each scored 0–100. Each bar is that input's sub-score; the figure is the points it added to the 100-point composite (weight × sub-score).
- ARV discount +15.0/15.0
- Cash flow +8.3/30.0
- Livability +4.0/5.0
- Schools +3.2/10.0
- 1% rule +3.0/10.0
- Rent growth +3.0/5.0
- Condition / age +2.5/5.0
- DSCR +2.2/10.0
- Appreciation +0.0/10.0
$329,000
🖨 Deal sheet 📄 Offer letter ✓ Due diligence
Listing remarks MLS
Well-maintained and spacious duplex nestled in the heart of Albany's desirable Pine Hills neighborhood. Fully occupied two-family home offers the perfect blend of historic charm and modern convenience, making it an excellent opportunity for investors or owner-occupants alike. Downstairs is a spacious 1 bedroom rent can go for $1,200 per month and upstairs is a 3 bedroom that can go for $1,600. - Bright, airy living and dining rooms with original hardwood floors - Updated kitchens with ample cabinet space. - Private front porches and rear balconies for outdoor enjoyment Additional highlights include: - Separate utilities for each unit - Full basement with laundry hookups and abundant storage Located just minutes from SUNY Albany, St. Rose, and Albany Med, with easy access to shopping, dining, and public transportation. Whether you're looking to live in one unit and rent the other, or add a solid property to your portfolio.
Key facts
- Rear balconies
- Ample cabinet space
- Updated kitchens
Tags
Neighborhood map
What this means for you Summary
Snapshot
- This is a 3-bed/2.0-bath single-family listed at $329k.
Deal economics
- At list price, monthly cash flow is $-303 ($-4k/yr) — negative.
- To cash-flow at today's rent, offer at most $276k (16.2% below list).
- To meet the 1% rule (rent ≥ 1% of price), the offer needs to be $263k (19.9% below list).
- Recommended offer: $263k (19.9% below list) — sets the bar for 1% rule.
Location & tenants
- Location reads 79/100 on livability (#129 in NY, #2,083 nationally) — a middle-class / working-renter tenant base. Strengths: amenities A+, commute A+, housing A+; Watch: employment C-, crime F.
- Albany City School District (urban): math 37% / reading 40% proficiency, ranked #543 of 590 in NY (top 92%) — families likely to look elsewhere, expect single-tenant / working-renter base with shorter leases; 66% free/reduced lunch — lower-income household profile, screen leases tightly.
- Market conditions: Rents rising (+1.9%/yr); 124 active listings in the ZIP; 17 comparable units currently listed for rent nearby; rentals at typical pace (median 23d on market — plan ~3-4 weeks tenant-placement turnaround); 47% of comp listings sitting > 30 days — soft ceiling on asking rent; solid renter incomes; 675 units permitted in Albany County in 2024 (451 in 5+ unit buildings).
- This rent runs 38% of the median local income ($83k/yr) — at the standard rent-burdened threshold; future hikes will face affordability resistance.
Forward outlook
- Local home prices are declining (-3.0%/yr); year-one equity from $2k of loan paydown is wiped out by about $10k of value loss. Plan a longer hold.
- Albany County population projected at +9% by 2050 — modest demand growth; plan on rents tracking national, not racing it.
Negotiation context
- It's been on market 213 days — a 12% lower offer ($290k) is reasonable based on typical stale-listing flexibility.
- 5 sale attempts since 23y ago; this cycle's ask is 10% above the opening price — seller raised mid-cycle; expect resistance to lowballs.
- Current owner paid $110k; list at $329k implies a 198% gain — meaningful room to come down on a strong offer.
Risks & watch-outs
- Watch-outs: built in 1906 — expect roof / HVAC / electrical / plumbing capex.
Questions for the listing agent
- What do current leases actually rent for vs. the listed asking? Can we see a recent rent roll and the last 12 months of T-12 income?
- It's been on market 213 days. Have you received any prior offers? Is the seller open to a 20% concession, seller financing, or rate buy-down credit?
- Built in 1906 — when were the roof, HVAC, electrical panel, plumbing, and water heater last replaced?
- Why hasn't it sold? Are there any deal-killer items the seller is aware of (foundation, flood, title, zoning, code violations)?
- Is there a deadline driving the sale (1031 exchange, divorce, estate, relocation)? That informs how much negotiation room exists.
- Crime grade is F in this area — have there been break-ins, vandalism, or insurance claims at this property in the last 3 years? What carrier currently insures it and at what premium?
- The area grade is low — what's the realistic commute time and amenity access for the typical tenant pool here? Any planned neighborhood developments (good or bad) we should know about?
- What's the average days-on-market for RENTAL listings here right now (not sales)? A rising rental-DOM trend means longer vacancies and softer asking-rent achievability than the comps imply.
- What's the recent tenant-quality profile in this submarket — average credit score on applications, eviction rate, late-payment / NSF rate, and stable-employment percentage? A property-management company in the area should have these aggregated.
- How much new for-sale + rental construction is in the pipeline within 1–3 miles? Heavy new supply typically softens prices + rents 12–24 months out; constrained supply supports both.
Investment metrics
- 1% rule
- 0.80% ✗
- Cap rate
- 5.19%
- Cash-on-cash
- -3.94%
- DSCR
- 0.82
- GRM
- 10.4
CMA / ARV
- ARV (median comp)
- $547,382
- List price
- $329,000
- Delta
- -39.90%
- Verdict
- UNDERPRICED
- Comps
- 20 within 1.0 mi
Show comp detail 12 sales within ~0.75 mi
| Address | Dist | Beds/Ba | Sqft | Sold | Price | $/sf | Match |
|---|---|---|---|---|---|---|---|
| 129 N Pine Ave | 0.13mi | 4/1.0 (+1) | 1,991 (-3%) | 6mo | $240,000 | $121 | 74 |
| 959 Washington Ave | 0.31mi | 2/2.5 (-1) | 2,000 (-3%) | 2mo | $299,000 | $150 | 72 |
| 38 N Allen St | 0.10mi | 4/2.0 (+1) | 1,807 (-12%) | 4mo | $265,000 | $147 | 67 |
| 100 Terrace Ave | 0.39mi | 3/2.0 | 1,914 (-7%) | 6mo | $326,000 | $170 | 66 |
| 109 Terrace Ave | 0.35mi | 3/1.5 | 1,856 (-10%) | 6mo | $354,000 | $191 | 60 |
| 289 W Lawrence St | 0.40mi | 3/1.5 | 1,784 (-13%) | 2mo | $305,000 | $171 | 55 |
| 160 Manning Blvd | 0.24mi | 4/2.5 (+1) | 2,330 (+13%) | 6mo | $274,900 | $118 | 55 |
| 42 Peyster St | 0.63mi | 3/1.5 | 1,911 (-7%) | 4mo | $273,500 | $143 | 53 |
| 905 Myrtle Ave | 0.34mi | 3/1.5 | 1,759 (-14%) | 6mo | $290,000 | $165 | 52 |
| 171 Terrace Ave | 0.38mi | 3/2.0 | 1,758 (-15%) | 8mo | $435,000 | $247 | 52 |
| 73 Oakwood St | 0.74mi | 4/2.0 (+1) | 2,134 (+4%) | 9mo | $465,000 | $218 | 47 |
| 789 Western Ave | 0.75mi | 4/2.0 (+1) | 1,768 (-14%) | 7mo | $357,500 | $202 | 30 |
Match score weights: distance 35% · size 25% · config 20% · recency 20%. Top-matched comps best support the ARV.
Projected returns pro-forma
-3.0% appreciation · 1.85% rent growth · sell at horizon
- IRR
- -24.2%
- Equity multiple
- 0.18×
- Total profit
- $-75,486
- Equity at exit
- $49,055
- IRR
- -23.3%
- Equity multiple
- -0.11×
- Total profit
- $-102,190
- Equity at exit
- $28,446
Cash invested: $92,120 (down + closing). Projections, not guarantees.
Landlord ↔ Tenant lean methodology
- Overall (STATE)
- 15 Strongly Tenant-Friendly
- State New York
- 15 Strongly Tenant-Friendly · D+10
- County
- — inherits STATE
- City
- — inherits STATE
ZIP-level market 12203
- Home prices YoY
- -31.0%
- Rents YoY
- 1.9%
- Active inventory
- 124
- Price-to-rent
- 10.4×
Monthly cashflow live
- Estimated rent
- $2,634 high interval (Pro) →
- Mortgage (P&I)
- −$1,725
- Tax from tax record
- −$521 /mo · $6,254/yr
- Insurance
- −$137
- HOA
- −$0
- Vacancy / Maint / Mgmt
- −$553
- Net cashflow
- $-303
Break-even live
UW: 25.0% down · 7.5% · 30yr · 1.5% tax · 5.0% vac · 8.0% maint · 8.0% mgmt
Financing live
Cash to close
- Down payment
- $82,250
- Closing costs
- $9,870
- Reserves months
- —
- Total cash needed
- —
Loan-product check · same deal, 3 products live
Conventional
25% down · 7.5% · 30yr
- Down + closing
- —
- Monthly P&I
- —
- Monthly cashflow
- —
- DSCR
- —
- Eligible?
- —
Personal DTI + credit; lowest rate.
DSCR
20% down · 8.5% · 30yr
- Down + closing
- —
- Monthly P&I
- —
- Monthly cashflow
- —
- DSCR
- —
- Eligible?
- —
No personal income docs; deal must DSCR.
Hard money
10% down · 12.0% · 12mo
- Down + closing
- —
- Monthly P&I
- —
- Monthly cashflow
- —
- DSCR
- —
- Eligible?
- —
Short-term bridge; refi at stabilization.
Rent comps 17 comps
| Address | Beds | Baths | Sqft | Rent | $/sqft | DOM | Units | Dist |
|---|---|---|---|---|---|---|---|---|
| 135 Winthrop Ave Albany, NY | 3.0 | 2.0 | 1788 | $3,500 | $1.96 | 43d | 1 | 0.24mi |
| 78 S Pine Ave Unit 2 Albany, NY | 3.0 | 1.5 | 1541 | $2,350 | $1.52 | 14d | 1 | 0.36mi |
| 57 S Main Ave Albany, NY | 4.0 | 1.0 | 2695 | $1,600 | $0.59 | 43d | 1 | 0.46mi |
| 32 Peyster St Unit 1st floor Albany, NY | 3.0 | 2.0 | 2714 | $2,500 | $0.92 | 43d | 1 | 0.62mi |
| 32 Peyster St Unit 2nd Albany, NY | 3.0 | 2.0 | 1500 | $2,300 | $1.53 | 43d | 1 | 0.62mi |
| 726 Western Ave Albany, NY | 4.0 | 2.5 | 1900 | $2,800 | $1.47 | 43d | 1 | 0.71mi |
| 363 Ontario St Albany, NY | 1.0–2.0 | 1.0–2.5 | 1610 | $3,485 | $2.16 | 14d | 1 | 0.79mi |
| 154 Spring St Albany, NY | 3.0 | 1.0 | 2500 | $1,695 | $0.68 | 43d | 1 | 0.81mi |
| 830 Western Ave Albany, NY | 4.0 | 2.5 | 1600 | $2,700 | $1.69 | 14d | 1 | 0.82mi |
| 257 Quail St Albany, NY | 4.0 | 2.5 | 2208 | $2,800 | $1.27 | 43d | 1 | 0.85mi |
| 38 W Erie St Albany, NY | 4.0 | 2.0 | 1440 | $2,800 | $1.94 | 23d | 1 | 0.87mi |
| 178 Western Ave Unit 3 Albany, NY | 3.0 | 1.0 | 1500 | $1,725 | $1.15 | 14d | 1 | 0.94mi |
| 53 Greenway N Albany, NY | 3.0 | 2.0 | 1500 | $2,600 | $1.73 | 23d | 1 | 1.00mi |
| 147 Western Ave Albany, NY | 3.0 | 1.0 | 1428 | $1,800 | $1.26 | 14d | 1 | 1.01mi |
| 546 Mercer St Unit 1 Albany, NY | 3.0 | 1.0 | 1400 | $1,800 | $1.29 | 23d | 1 | 1.05mi |
| 30 Cardinal Ave Albany, NY | 4.0 | 1.0 | 1529 | $2,800 | $1.83 | 44d | 1 | 1.12mi |
| 255 Patroon Creek Blvd Albany, NY | 1.0–3.0 | 1.0–2.0 | 1080 | $2,559 | $2.37 | 14d | 22 | 1.17mi |
Listing history 26 events
-
2026-06-18days on market $329,000 Active 213 DOM
-
2026-06-17days on market $329,000 Active 212 DOM
-
2026-06-16days on market $329,000 Active 211 DOM
-
2026-06-15days on market $329,000 Active 210 DOM
-
2026-06-14days on market $329,000 Active 208 DOM
-
2026-06-10days on market $329,000 Active 205 DOM
-
2026-06-08days on market $329,000 Active 203 DOM
-
2026-06-07days on market $329,000 Active 202 DOM
-
2026-06-03days on market $329,000 Active 198 DOM
-
2026-06-02days on market $329,000 Active 197 DOM
-
2026-06-01days on market $329,000 Active 196 DOM
-
2026-05-31days on market $329,000 Active 195 DOM
-
2026-05-31days on market $329,000 Active 194 DOM
-
2026-01-03price $329,000 935-char remark
Show marketing remark (935 chars)
Well-maintained and spacious duplex nestled in the heart of Albany's desirable Pine Hills neighborhood. Fully occupied two-family home offers the perfect blend of historic charm and modern convenience, making it an excellent opportunity for investors or owner-occupants alike. Downstairs is a spacious 1 bedroom rent can go for $1,200 per month and upstairs is a 3 bedroom that can go for $1,600. - Bright, airy living and dining rooms with original hardwood floors - Updated kitchens with ample cabinet space. - Private front porches and rear balconies for outdoor enjoyment Additional highlights include: - Separate utilities for each unit - Full basement with laundry hookups and abundant storage Located just minutes from SUNY Albany, St. Rose, and Albany Med, with easy access to shopping, dining, and public transportation. Whether you're looking to live in one unit and rent the other, or add a solid property to your portfolio.
-
2025-11-17$300,000 Active 935-char remark
Show marketing remark (935 chars)
Well-maintained and spacious duplex nestled in the heart of Albany's desirable Pine Hills neighborhood. Fully occupied two-family home offers the perfect blend of historic charm and modern convenience, making it an excellent opportunity for investors or owner-occupants alike. Downstairs is a spacious 1 bedroom rent can go for $1,200 per month and upstairs is a 3 bedroom that can go for $1,600. - Bright, airy living and dining rooms with original hardwood floors - Updated kitchens with ample cabinet space. - Private front porches and rear balconies for outdoor enjoyment Additional highlights include: - Separate utilities for each unit - Full basement with laundry hookups and abundant storage Located just minutes from SUNY Albany, St. Rose, and Albany Med, with easy access to shopping, dining, and public transportation. Whether you're looking to live in one unit and rent the other, or add a solid property to your portfolio.
-
2025-01-16historical $1,000
-
2025-01-09$1,000
-
2014-03-18historical
-
2013-05-16$170,900
-
2012-09-05historical
-
2012-06-20$179,900
-
2003-08-11soldstatus $110,500
-
2003-06-09soldstatus $110,000
-
2003-04-10historical
-
2003-04-02$110,000
-
2000-05-08soldstatus $86,500
ⓘ Source: listings_history table (triggers on properties + properties_extension) + one-shot
backfill from property_details.listing_events for pre-trigger history.
Tax reassessment forecast NY · Partial reset (capped growth)
- Current annual tax
- $6,254 · $521/mo
- Projected year-2 tax
- $6,254 · $521/mo
- Expected delta
- $0/yr ($0/mo · 0.0%)
ⓘ Screening estimate from a state-policy table — verify with the county assessor before closing.
Climate risk First Street
- Flood 1/10 Low FEMA zone X (unshaded) · 0% chance over 30 yrs
- Wildfire 1/10 Low
- Heat 4/10 Moderate 7 d/yr ≥97°F today · 16 d/yr by 30 yrs out
- Wind 3/10 Moderate 6% chance of damaging wind over 30 yrs
- Air quality 1/10 Low 0 unhealthy d/yr today · 0 by 30 yrs out
Nearby sold comps map
Loading sold comps map…
Walkable amenities ~0.75 mi
Loading nearby amenities…
Taxation est. · year 1
- Rental income
- $31,611
- − Mortgage interest
- −$18,429
- − Property taxes
- −$6,254
- − Insurance
- −$1,645
- − Repairs & maintenance
- −$2,529
- − Management
- −$2,529
- − Depreciation
- −$9,571
- Taxable loss
- −$9,346
- Est. tax savings @ 24.0%
- +$2,243
- After-tax cash flow
- $-1,387/yr
For passive investors: Depreciation is non-cash, so a rental often shows a tax loss while cash-flowing — sheltering income. Rental losses are passive: they offset passive income freely, and up to $25,000/yr can offset ordinary (W-2) income if you actively participate and your MAGI is under $100k (phasing out to $0 by $150k); unused losses carry forward. On sale, claimed depreciation is recaptured at up to 25%, and gains may owe capital-gains tax (a 1031 exchange can defer both). Figures are a year-1 estimate at your 24.0% rate — not tax advice; consult a CPA.
Schools (NCES district)
- District
- Albany City School District
- NCES district ID
- 3602460
- Math proficiency
- 37% ▲ 6.00%
- Reading proficiency
- 40% ▲ 7.00%
- Median HH income
- $40,568
- Composite
- 32.34/100
- National rank
- #5744
- State rank
- #543 of 590 in NY
Livability — Albany
- Score
- 79/100
- State rank
- #129
- US rank
- #2083
Category grades
Schools grade is shown separately in the Schools card above.
Census & demographics
- Census place
- Albany, NY
- County
- Albany County · 196,626 people
- City population
- 116,921
- Metro
- Albany-Schenectady-Troy, NY
- Population (ZIP)
- 30,771
- Household income
- $83,147
- Rent vs Own
- Severe rent burden
- 1704.0
Population outlook (Albany County) Hauer SSP2
- Today (2025)
- 320,794 people
- By 2030
- 327,401 · +2.1%
- By 2040
- 338,218 · +5.4%
- By 2050
- 348,467 · +8.6%
- By 2075
- 381,693 · +19.0%
- By 2100
- 393,809 · +22.8%
Race, ethnicity, and origin ACS 2023
- Neighborhood character
- Predominantly White (69%)
- Race & ethnicity
- White 69% Black 10% Asian 8% Hispanic / Latino 7% Two or more races 7%
- Hispanic origin (detail)
- Mexican 2% Puerto Rican 2%
- Common ancestry
- Romanian 5% Lithuanian 3% Slovak 2%
- Foreign-born
- 16% · Canada, China, South Korea
- Languages at home
- 82% English-only · Other Indo-European 6% Spanish 3% Russian/Polish/Slavic 2%
Political lean MEDSL · Albany
- 2024 margin
- Strong D (+25.8) · D 62.9% · R 37.1%
- 2008→2024 swing
- -3.6pp toward R · 2008: 29.4pp · 2024: 25.8pp
- All cycles
- 2024: D+25.8 2020: D+31.4 2016: D+24.3 2012: D+31.0 2008: D+29.4
Not yet ingested
- Civics
- —
Market trends
- HPI YoY
- ▼ -133.05%
- Current HPI
- 296.0467
- Rent YoY
- ▲ 1.85%
- Metro
- Albany-Schenectady-Troy, NY
- State GDP YoY
- ▲ 2.60%
- F500 in state
- 92
Industry mix (Fortune 500 HQ in NY)
| Industry | F500 HQs | Revenue |
|---|---|---|
| Financial Services | 10 | $950B |
|
||
| Consumer Goods | 9 | $162B |
|
||
| Insurance | 4 | $225B |
|
||
| Telecommunications | 2 | $144B |
|
||
| Pharmaceuticals | 2 | $112B |
|
||
| Media / Entertainment | 2 | $69B |
|
||
Price history
+280.3% since first listed13 events — show timeline
- 2026-01-03 Price Changed $329,000 ForSaleByOwner.com
- 2025-11-17 Listed $300,000 ForSaleByOwner.com
- 2025-01-16 Rental Removed $1,000 TURBOTENANT
- 2025-01-09 Listed for Rent $1,000 TURBOTENANT
- 2014-03-18 Listing Removed — Global MLS
- 2013-05-16 Listed $170,900 Global MLS
- 2012-09-05 Listing Removed — Global MLS
- 2012-06-20 Listed $179,900 Global MLS
- 2003-08-11 Sold (Public Records) $110,500 Public Records
- 2003-06-09 Sold (MLS) $110,000 Global MLS
- 2003-04-10 Listing Removed — Global MLS
- 2003-04-02 Listed $110,000 Global MLS
- 2000-05-08 Sold (Public Records) $86,500 Public Records
Property tax history
+1.2%/yrLatest (2025): $6,254 · +1.5% YoY. Source: county tax records.
Cash-flow waterfall
monthlySold comps — $/sqft
last 12 mo · ≤1 miLoading sold comps…