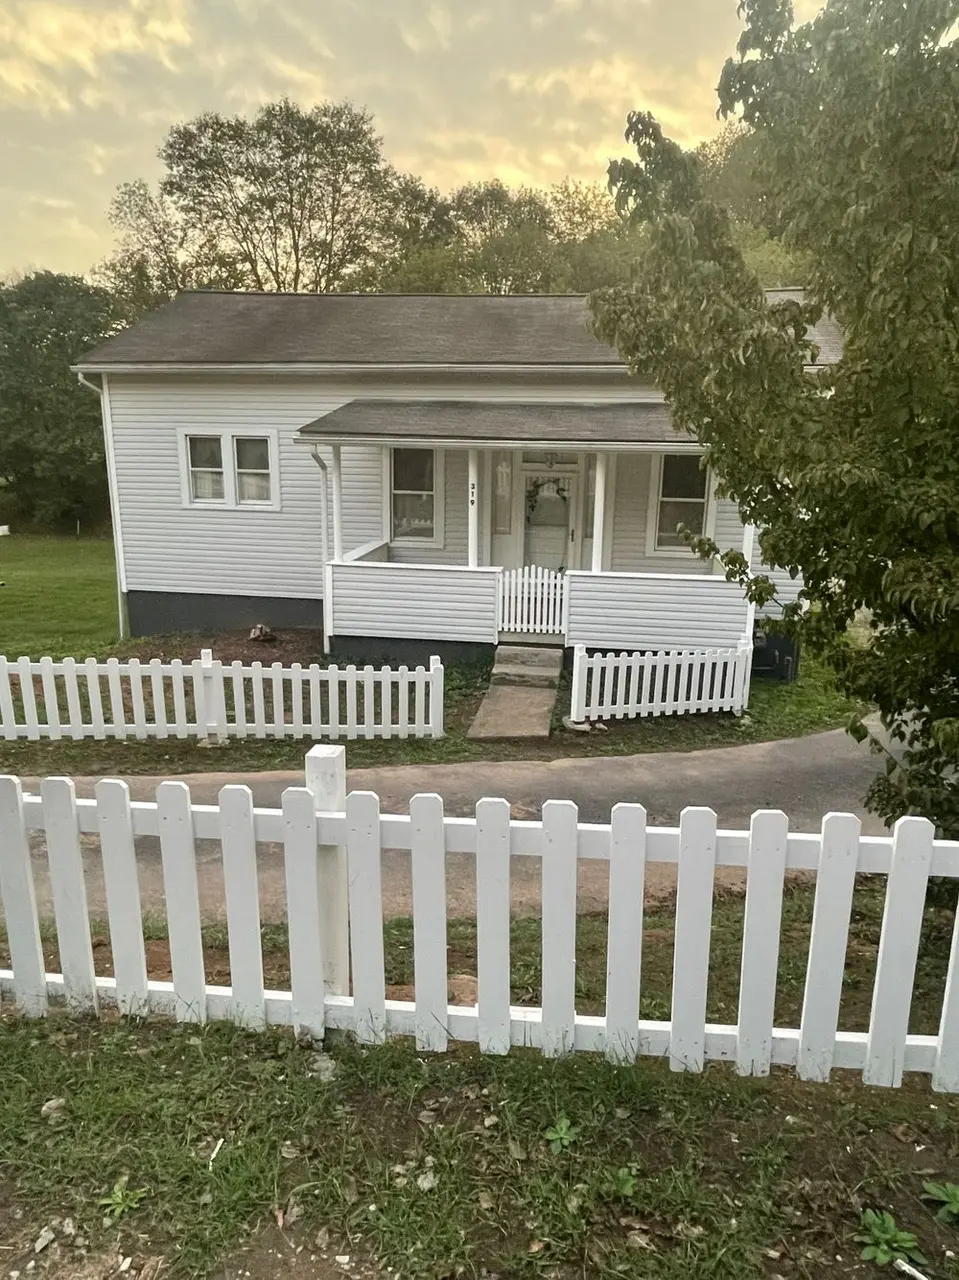
319 Kunst Dr · Weston, WV
Flood risk 7/10 · Major
- FEMA flood zone
- X (unshaded)
- Chance of flooding over 30 yrs
- 0.78%
- Est. flood insurance / yr
- $473 – $860
Fire risk 2/10 · Minimal
- Est. fire insurance / yr
- $787 – $1,461
Heat risk 4/10 · Minor
- Hot days now (above 99°F)
- 7 days/yr
- Hot days in 30 yrs
- 19 days/yr
Wind risk 1/10 · Minimal
- Chance of severe wind over 30 yrs
- 0.0%
Air-quality risk 2/10 · Minimal
- Unhealthy air days now
- 0 days/yr
- Unhealthy air days in 30 yrs
- 1 days/yr
Risk factors via First Street. Map © Google.
Why this score? — see what drove the C+ grade
The composite is a weighted blend of 9 inputs, each scored 0–100. Each bar is that input's sub-score; the figure is the points it added to the 100-point composite (weight × sub-score).
- Cash flow +22.4/30.0
- ARV discount +11.0/15.0
- DSCR +7.2/10.0
- Appreciation +5.6/10.0
- 1% rule +4.7/10.0
- Livability +3.7/5.0
- Rent growth +2.5/5.0
- Condition / age +2.5/5.0
- Schools +1.9/10.0
$95,000
🖨 Deal sheet 📄 Offer letter ✓ Due diligence
Listing remarks
FOR SALE 319 Kunst Drive, Weston, WV $95,000 Looking for an affordable home with great potential? Check out this property at 319 Kunst Drive in Weston, West Virginia! Convenient location Quiet residential area Great opportunity for homeowners or investors Affordable price point Room to make it your own Whether you're looking for a place to call home, a rental property, or an investment opportunity, this property deserves a look. Price: $95,000 Serious inquiries only. Contact for additional information or to schedule a viewing. Don't miss this chance to own property in Weston at an affordable price!
Key facts
- 7,884 sq ft lot
- Built 1925
- Listed 14 days
Property features AI
Exterior
- Home design: House
- Exterior features: Lot size approximately 7,884 sq ft
Neighborhood map
What this means for you Summary
Snapshot
- This is a 3-bed/1.0-bath single-family listed at $95k.
Deal economics
- At list price, monthly cash flow is $103 ($1k/yr) — positive.
- The deal already cash-flows at list — no discount required.
- To meet the 1% rule (rent ≥ 1% of price), the offer needs to be $92k (3.4% below list).
- Recommended offer: $92k (3.4% below list) — sets the bar for 1% rule.
- Cap rate 8.3% vs local median 4.2% in Weston — top-decile yield for the area; either an underpriced asset or a hidden risk that comps aren't pricing in. Stress-test before assuming the spread holds.
Location & tenants
- Location reads 73/100 on livability (#38 in WV) — a middle-class / working-renter tenant base. Strengths: cost of living A+, housing A+, health & safety A+; Watch: schools D, amenities D-, commute F.
- Lewis County Schools (rural): math 19% / reading 27% proficiency, ranked #53 of 55 in WV (top 96%) — low school quality limits family demand, transient renter base, plan for 1-2y turnover.
- Market conditions: 37 active listings in the ZIP.
Forward outlook
- In year one you build about $2k of equity ($657 loan paydown + $1k appreciation (1.2% local appreciation)).
- Lewis County population projected to shrink 5% by 2050 — rents likely to lag national; underwrite the cash flow, not the appreciation.
- At projected returns (1.2% appreciation + 3.0% rent growth), your $27k cash investment doubles in ~7 years — after that, you're playing with house money.
Negotiation context
- Only 14 days on market — expect competitive offers; lowballing is unlikely to land.
Risks & watch-outs
- Watch-outs: flood insurance adds $56/mo; built in 1925 — expect roof / HVAC / electrical / plumbing capex.
- Climate carrying-cost: major flood risk — expect insurance premiums to compound above CPI over the hold.
Questions for the listing agent
- Built in 1925 — when were the roof, HVAC, electrical panel, plumbing, and water heater last replaced?
- What's the actual annual flood-insurance premium (NFIP or private), and is the property in a SFHA with mandatory coverage?
- Is there a deadline driving the sale (1031 exchange, divorce, estate, relocation)? That informs how much negotiation room exists.
- Schools are D-rated, which usually means shorter tenancies and higher turnover. Who's the typical renter profile here, and what's been the actual vacancy rate?
- What's the average days-on-market for RENTAL listings here right now (not sales)? A rising rental-DOM trend means longer vacancies and softer asking-rent achievability than the comps imply.
- What's the recent tenant-quality profile in this submarket — average credit score on applications, eviction rate, late-payment / NSF rate, and stable-employment percentage? A property-management company in the area should have these aggregated.
- How much new for-sale + rental construction is in the pipeline within 1–3 miles? Heavy new supply typically softens prices + rents 12–24 months out; constrained supply supports both.
Investment metrics
- 1% rule
- 0.97% ✗
- Cap rate
- 8.30%
- Cash-on-cash
- 7.16%
- DSCR
- 1.32
- GRM
- 8.6
CMA / ARV
- ARV (on-the-fly)
- $103,000
- Comps found
- 7
Show comp detail 7 sales within ~0.75 mi
| Address | Dist | Beds/Ba | Sqft | Sold | Price | $/sf | Match |
|---|---|---|---|---|---|---|---|
| 825 W Second St | 0.18mi | 3/1.0 | 1,104 (+10%) | 6mo | $132,000 | $120 | 69 |
| 715 W 2nd | 0.27mi | 2/1.0 (-1) | 900 (-10%) | 1mo | $59,900 | $67 | 65 |
| 832 W Second St | 0.16mi | 2/1.0 (-1) | 1,076 (+8%) | 21mo | $19,000 | $18 | 58 |
| 556 Broad St | 0.59mi | 2/1.0 (-1) | 960 (-4%) | 7mo | $99,000 | $103 | 55 |
| 626 Rohr St | 0.37mi | 3/1.0 | 888 (-11%) | 13mo | $125,000 | $141 | 53 |
| 506 Broad St | 0.71mi | 2/1.5 (-1) | 980 (-2%) | 8mo | $110,000 | $112 | 50 |
| 601 W 2nd St | 0.49mi | 2/1.0 (-1) | 976 (-2%) | 23mo | $80,000 | $82 | 49 |
Match score weights: distance 35% · size 25% · config 20% · recency 20%. Top-matched comps best support the ARV.
Projected returns pro-forma
1.17% appreciation · 3.0% rent growth · sell at horizon
- IRR
- 6.7%
- Equity multiple
- 1.34×
- Total profit
- $9,134
- Equity at exit
- $33,283
- IRR
- 10.7%
- Equity multiple
- 2.32×
- Total profit
- $35,209
- Equity at exit
- $44,896
Cash invested: $26,600 (down + closing). Projections, not guarantees.
Landlord ↔ Tenant lean methodology
- Overall (STATE)
- 83 Strongly Landlord-Friendly
- State West Virginia
- 83 Strongly Landlord-Friendly · R+22
- County
- — inherits STATE
- City
- — inherits STATE
ZIP-level market 26452
- Home prices YoY
- 0.8%
- Active inventory
- 37
- Price-to-rent
- 8.6×
Monthly cashflow live
- Estimated rent
- $918 medium interval (Pro) →
- Mortgage (P&I)
- −$498
- Tax from tax record
- −$29 /mo · $342/yr
- Insurance
- −$40
- Flood insurance flood zone
- −$56 /mo · $666/yr
- HOA
- −$0
- Vacancy / Maint / Mgmt
- −$193
- Net cashflow
- $103
Break-even live
UW: 25.0% down · 7.5% · 30yr · 1.5% tax · 5.0% vac · 8.0% maint · 8.0% mgmt
Financing live
Cash to close
- Down payment
- $23,750
- Closing costs
- $2,850
- Reserves months
- —
- Total cash needed
- —
Loan-product check · same deal, 3 products live
Conventional
25% down · 7.5% · 30yr
- Down + closing
- —
- Monthly P&I
- —
- Monthly cashflow
- —
- DSCR
- —
- Eligible?
- —
Personal DTI + credit; lowest rate.
DSCR
20% down · 8.5% · 30yr
- Down + closing
- —
- Monthly P&I
- —
- Monthly cashflow
- —
- DSCR
- —
- Eligible?
- —
No personal income docs; deal must DSCR.
Hard money
10% down · 12.0% · 12mo
- Down + closing
- —
- Monthly P&I
- —
- Monthly cashflow
- —
- DSCR
- —
- Eligible?
- —
Short-term bridge; refi at stabilization.
Listing history 13 events
-
2026-06-18days on market $95,000 Active 14 DOM
-
2026-06-17days on market $95,000 Active 13 DOM
-
2026-06-16days on market $95,000 Active 12 DOM
-
2026-06-15days on market $95,000 Active 11 DOM
-
2026-06-15days on market $95,000 Active 10 DOM
-
2026-06-13days on market $95,000 Active 9 DOM
-
2026-06-12days on market $95,000 Active 8 DOM
-
2026-06-09days on market $95,000 Active 5 DOM
-
2026-06-08days on market $95,000 Active 4 DOM
-
2026-06-08days on market $95,000 Active 3 DOM
-
2026-06-07days on market $95,000 Active 2 DOM
-
2026-06-04remarks 616-char remark
-
2026-06-04$95,000 Active 1 DOM
ⓘ Source: listings_history table (triggers on properties + properties_extension) + one-shot
backfill from property_details.listing_events for pre-trigger history.
Tax reassessment forecast WV · Resets to sale price
- Current annual tax
- $342 · $29/mo
- Projected year-2 tax
- $560 · $47/mo
- Expected delta
- +$218/yr (+$18/mo · 63.8%)
ⓘ Screening estimate from a state-policy table — verify with the county assessor before closing.
Climate risk First Street
- Flood 7/10 Severe FEMA zone X (unshaded) · 78% chance over 30 yrs
- Wildfire 2/10 Low
- Heat 4/10 Moderate 7 d/yr ≥99°F today · 19 d/yr by 30 yrs out
- Wind 1/10 Low 0% chance of damaging wind over 30 yrs
- Air quality 2/10 Low 0 unhealthy d/yr today · 1 by 30 yrs out
Nearby sold comps map
Loading sold comps map…
Walkable amenities ~0.75 mi
Loading nearby amenities…
Taxation est. · year 1
- Rental income
- $11,011
- − Mortgage interest
- −$5,321
- − Property taxes
- −$342
- − Insurance
- −$1,142
- − Repairs & maintenance
- −$881
- − Management
- −$881
- − Depreciation
- −$2,764
- Taxable loss
- −$319
- Est. tax savings @ 24.0%
- +$77
- After-tax cash flow
- $1,314/yr
For passive investors: Depreciation is non-cash, so a rental often shows a tax loss while cash-flowing — sheltering income. Rental losses are passive: they offset passive income freely, and up to $25,000/yr can offset ordinary (W-2) income if you actively participate and your MAGI is under $100k (phasing out to $0 by $150k); unused losses carry forward. On sale, claimed depreciation is recaptured at up to 25%, and gains may owe capital-gains tax (a 1031 exchange can defer both). Figures are a year-1 estimate at your 24.0% rate — not tax advice; consult a CPA.
Schools (NCES district)
- District
- Lewis County Schools
- NCES district ID
- 5400630
- Math proficiency
- 19% ▼ -12.00%
- Reading proficiency
- 27% ▼ -8.00%
- Median HH income
- $36,146
- Composite
- 19.05/100
- National rank
- #8843
- State rank
- #53 of 55 in WV
Livability — Weston
- Score
- 73/100
- State rank
- #38
- US rank
- #5368
Category grades
Schools grade is shown separately in the Schools card above.
Census & demographics
- Population (ZIP)
- 9,374
Population outlook (Lewis County) Hauer SSP2
- Today (2025)
- 16,382 people
- By 2030
- 16,293 · -0.5%
- By 2040
- 15,999 · -2.3%
- By 2050
- 15,569 · -5.0%
- By 2075
- 14,450 · -11.8%
- By 2100
- 12,164 · -25.7%
Race, ethnicity, and origin ACS 2023
- Neighborhood character
- Predominantly White (92%)
- Race & ethnicity
- White 92% Two or more races 6% Hispanic / Latino 2%
- Common ancestry
- Serbian 1% Iranian 1% Italian 1%
- Foreign-born
- 1% · Canada
- Languages at home
- 98% English-only · Spanish 1%
Political lean MEDSL · Lewis
- 2024 margin
- Solid R (+59.3) · D 19.5% · R 78.8% · Other 1.8%
- 2008→2024 swing
- -25.6pp toward R · 2008: -33.7pp · 2024: -59.3pp
- All cycles
- 2024: R+59.3 2020: R+56.9 2016: R+56.8 2012: R+42.1 2008: R+33.7
Not yet ingested
- Civics
- —
Market trends
- HPI YoY
- ▲ 1.17%
- Current HPI
- 144.3377
- Rent YoY
- —
- Metro
- —
- State GDP YoY
- —
- F500 in state
- 0
Price history
1 event — show timeline
- 2026-06-04 Listed $95,000 ForSaleByOwner.com
Property tax history
+17.1%/yrLatest (2025): $342 · +11.8% YoY. Source: county tax records.
Cash-flow waterfall
monthlySold comps — $/sqft
last 12 mo · ≤1 miLoading sold comps…