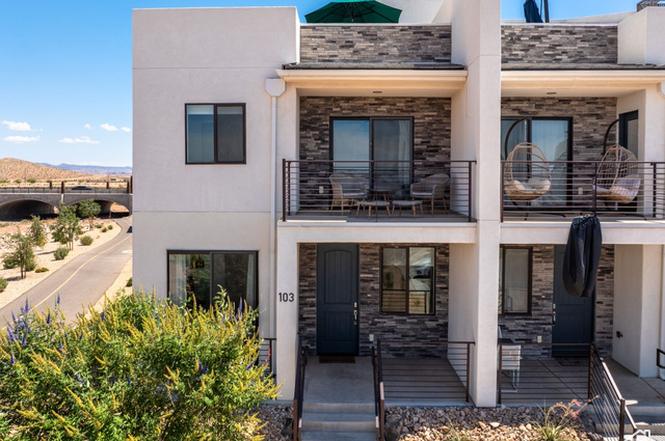
5399 E Cerulean Ln #103 · St. George, UT
Flood risk 4/10 · Minor
- FEMA flood zone
- X (unshaded)
- Chance of flooding over 30 yrs
- 0.22%
- Est. flood insurance / yr
- $507 – $1,088
Fire risk 6/10 · Moderate
- Est. fire insurance / yr
- $453 – $841
Heat risk 7/10 · Major
- Hot days now (above 103°F)
- 7 days/yr
- Hot days in 30 yrs
- 19 days/yr
Wind risk 1/10 · Minimal
- Chance of severe wind over 30 yrs
- —
Air-quality risk 1/10 · Minimal
- Unhealthy air days now
- 0 days/yr
- Unhealthy air days in 30 yrs
- 0 days/yr
Risk factors via First Street. Map © Google.
Why this score? — see what drove the B- grade
The composite is a weighted blend of 9 inputs, each scored 0–100. Each bar is that input's sub-score; the figure is the points it added to the 100-point composite (weight × sub-score).
- Cash flow +29.9/30.0
- 1% rule +10.0/10.0
- DSCR +10.0/10.0
- ARV discount +7.5/15.0
- Schools +3.7/10.0
- Rent growth +2.6/5.0
- Livability +2.5/5.0
- Condition / age +2.5/5.0
- Appreciation +0.0/10.0
$110,000
🖨 Deal sheet 📄 Offer letter ✓ Due diligence
Listing remarks
Discover the opportunity to own a 1/8th share of this fully furnished end-unit, three-story condo in the sought-after Desert Color community. This property offers resort-style living with access to two pools, a 2.5-acre lagoon, and a private spa area exclusively for this section of the neighborhood. Desert Color is rapidly growing, with new shopping, dining, and entertainment options nearby, including a Smith's grocery and a new movie theater and Costco coming soon. This home stands out among others in the building. As an end unit, it features more natural light, a private owner's closet, and every bedroom includes its own ensuite bathroom. The condo includes three bedrooms, three bathrooms
Key facts
- Private spa area
- 2.5 acre lagoon
- End unit
Tags
Property features AI
Finance
- Other: Subdivision: DESERT COLOR SKYLINE CONDOMINIUMS; Above-grade finished area listed
- HOA & community: Homeowners association (CCMC); Quarterly HOA fee (includes insurance); Community amenities: clubhouse, pool, spa/hot tub, RV parking, management
Exterior
- Parking: Two open/uncovered parking spaces; RV parking and common RV parking available
- Utilities: Electricity connected; Water connected (secondary source); Sewer connected; Natural gas not available
- Home design: Townhouse / row-end; Residential use; Agent-owned; Has a view; Short-term rentals allowed
- Construction: Built and currently standing; Stone and stucco construction; Tile roof; No basement
- Exterior features: Tile roof; Stone and stucco exterior; Full landscaping; Sidewalks; Red Rock view
Interior
- Kitchen: Microwave; Refrigerator
- Bedrooms: One main-level bedroom; Primary bedroom(s) located on 1st and 2nd floors
- Flooring: Carpet
- Bathrooms: Three full bathrooms; One partial/half bathroom
- Heating & cooling: Forced air heating; Central air conditioning
- Interior features: Walk-in closet; Smart thermostat; Blinds and drapes; Sliding glass doors
- Laundry & utility: Washer; Dryer
Neighborhood map
What this means for you Summary
Snapshot
- This is a 3-bed/4.0-bath condo listed at $110k.
Deal economics
- At list price, monthly cash flow is $407 ($5k/yr) — positive.
- The deal already cash-flows at list — no discount required.
- Meets the 1% rule at list price ($2k rent vs $110k).
- Recommended offer: $97k (12.0% below list) — sets the bar for market timing.
Location & tenants
- Location reads: area grade B — affects rentability + tenant quality, not the cash-flow math above.
- Washington District (urban): math 42% / reading 45% proficiency, ranked #37 of 80 in UT (top 46%) — families likely to look elsewhere, expect single-tenant / working-renter base with shorter leases.
- Zoned schools: Sunrise Ridge Intermediate (math 52% / reading 54%, grade C+, #17 of 138 statewide, top 12%, 810 students, 17% FRL); Desert Hills High (math 47% / reading 58%, grade C-, #22 of 171 statewide, top 13%, 1,210 students, 15% FRL) — zoned schools average 16% FRL vs 36% district-wide (20 pts lower); this property's tenant base skews higher-income than the district average.
- Market conditions: Rents flat; 976 active listings in the ZIP; 9 comparable units currently listed for rent nearby; rentals at typical pace (median 22d on market — plan ~3-4 weeks tenant-placement turnaround); solid renter incomes; 3,140 units permitted in Washington County in 2024 (650 in 5+ unit buildings).
- This rent runs 30% of the median local income ($91k/yr) — at the standard rent-burdened threshold; future hikes will face affordability resistance.
Forward outlook
- Local home prices are declining (-3.0%/yr); year-one equity from $761 of loan paydown is wiped out by about $3k of value loss. Plan a longer hold.
- Washington County population projected at +44% by 2050 — long-run rental-demand tailwind backs the buy-and-hold thesis.
Negotiation context
- It's been on market 290 days — a 12% lower offer ($97k) is reasonable based on typical stale-listing flexibility.
Risks & watch-outs
- Watch-outs: property tax is 3.3% of price; HOA is 21% of rent.
- Climate carrying-cost: major wildfire risk; extreme-heat days projected 7→19/yr by 2055 (HVAC capex compounding) — expect insurance premiums to compound above CPI over the hold.
Questions for the listing agent
- It's been on market 290 days. Have you received any prior offers? Is the seller open to a 12% concession, seller financing, or rate buy-down credit?
- Property tax is high relative to price — has the assessment been appealed recently, and will the sale trigger a re-assessment?
- What does the HOA fee cover, when was the last increase, and are there any pending special assessments or reserve-fund shortfalls?
- Any open or pending special assessments — roof, HVAC, plumbing, elevator, façade? What's the per-unit balance and payoff schedule, and is the seller paying it off at close or rolling it to the buyer?
- Why hasn't it sold? Are there any deal-killer items the seller is aware of (foundation, flood, title, zoning, code violations)?
- Is there a deadline driving the sale (1031 exchange, divorce, estate, relocation)? That informs how much negotiation room exists.
- What's the average days-on-market for RENTAL listings here right now (not sales)? A rising rental-DOM trend means longer vacancies and softer asking-rent achievability than the comps imply.
- What's the recent tenant-quality profile in this submarket — average credit score on applications, eviction rate, late-payment / NSF rate, and stable-employment percentage? A property-management company in the area should have these aggregated.
- How much new apartment / multifamily construction is in the pipeline within 1–3 miles? Heavy new supply (>2% of stock underway) typically softens rents 12–24 months out; light construction supports rent growth.
Investment metrics
- 1% rule
- 2.10% ✓
- Cap rate
- 10.74%
- Cash-on-cash
- 15.87%
- DSCR
- 1.71
- GRM
- 4.0
CMA / ARV
No comps found within radius.
Projected returns pro-forma
-3.0% appreciation · 0.2% rent growth · sell at horizon
- IRR
- 2.0%
- Equity multiple
- 1.07×
- Total profit
- $2,224
- Equity at exit
- $16,401
- IRR
- 6.8%
- Equity multiple
- 1.41×
- Total profit
- $12,546
- Equity at exit
- $9,511
Cash invested: $30,800 (down + closing). Projections, not guarantees.
Landlord ↔ Tenant lean methodology
- Overall (STATE)
- 86 Strongly Landlord-Friendly
- State Utah
- 86 Strongly Landlord-Friendly · R+15
- County
- — inherits STATE
- City
- — inherits STATE
ZIP-level market 84790
- Rents YoY
- 0.2%
- Active inventory
- 976
- Price-to-rent
- 4.0×
Monthly cashflow live
- Estimated rent
- $2,312 high interval (Pro) →
- Mortgage (P&I)
- −$577
- Tax from tax record
- −$304 /mo · $3,643/yr
- Insurance
- −$46
- HOA
- −$493
- Vacancy / Maint / Mgmt
- −$486
- Net cashflow
- $407
Break-even live
UW: 25.0% down · 7.5% · 30yr · 1.5% tax · 5.0% vac · 8.0% maint · 8.0% mgmt
Financing live
Cash to close
- Down payment
- $27,500
- Closing costs
- $3,300
- Reserves months
- —
- Total cash needed
- —
Loan-product check · same deal, 3 products live
Conventional
25% down · 7.5% · 30yr
- Down + closing
- —
- Monthly P&I
- —
- Monthly cashflow
- —
- DSCR
- —
- Eligible?
- —
Personal DTI + credit; lowest rate.
DSCR
20% down · 8.5% · 30yr
- Down + closing
- —
- Monthly P&I
- —
- Monthly cashflow
- —
- DSCR
- —
- Eligible?
- —
No personal income docs; deal must DSCR.
Hard money
10% down · 12.0% · 12mo
- Down + closing
- —
- Monthly P&I
- —
- Monthly cashflow
- —
- DSCR
- —
- Eligible?
- —
Short-term bridge; refi at stabilization.
Rent comps 9 comps
| Address | Beds | Baths | Sqft | Rent | $/sqft | DOM | Units | Dist |
|---|---|---|---|---|---|---|---|---|
| 662 W Rosa Ln Saint George, UT | 3.0 | 2.5 | 1628 | $2,400 | $1.47 | 13d | 1 | 0.11mi |
| 5544 S Ochre Ln Saint George, UT | 2.0 | 2.5 | 1478 | $2,425 | $1.64 | 21d | 1 | 0.19mi |
| 758 W Sunfire Ln Saint George, UT | 2.0 | 3.0 | 1406 | $2,000 | $1.42 | 21d | 1 | 0.22mi |
| 5088 S Desert Color Pkwy Saint George, UT | 3.0 | 1.0–2.0 | 883 | $2,309 | $2.61 | 13d | 47 | 0.39mi |
| 767 W Scarlet Hill Dr Saint George, UT | 3.0 | 2.5 | 2155 | $2,395 | $1.11 | 21d | 1 | 0.42mi |
| 5801 S Garnet Dr St George, UT | 1.0–3.0 | 1.0–2.0 | 1132 | $1,950 | $1.72 | 13d | 4 | 0.43mi |
| 667 W Desert Poppy Ln Saint George, UT | 3.0 | 3.0 | 1865 | $2,200 | $1.18 | 21d | 1 | 0.45mi |
| 6134 Snead Cir Saint George, UT | 3.0 | 3.0 | 1799 | $2,300 | $1.28 | 21d | 1 | 0.88mi |
| 1806 W Sunstar Dr Saint George, UT | 3.0 | 2.0 | 1509 | $2,100 | $1.39 | 21d | 1 | 1.49mi |
HOA detail condo
- Monthly dues
- $493 · $5,916/yr
- Likely covers
- pool
- Assessments
- None detected in remarks — confirm with the listing agent.
Listing history 17 events
-
2026-06-19days on market $110,000 Active 290 DOM
-
2026-06-18days on market $110,000 Active 289 DOM
-
2026-06-17days on market $110,000 Active 288 DOM
-
2026-06-16days on market $110,000 Active 287 DOM
-
2026-06-15days on market $110,000 Active 286 DOM
-
2026-06-14days on market $110,000 Active 284 DOM
-
2026-06-13days on market $110,000 Active 283 DOM
-
2026-06-10days on market $110,000 Active 281 DOM
-
2026-06-09days on market $110,000 Active 280 DOM
-
2026-06-08days on market $110,000 Active 279 DOM
-
2026-06-07days on market $110,000 Active 278 DOM
-
2026-06-05days on market $110,000 Active 275 DOM
-
2026-06-02days on market $110,000 Active 273 DOM
-
2026-06-01days on market $110,000 Active 272 DOM
-
2026-05-31days on market $110,000 Active 271 DOM
-
2026-05-30days on market $110,000 Active 270 DOM
-
2025-09-02$110,000 Active
ⓘ Source: listings_history table (triggers on properties + properties_extension) + one-shot
backfill from property_details.listing_events for pre-trigger history.
Tax reassessment forecast UT · Resets to sale price
- Current annual tax
- $3,643 · $304/mo
- Projected year-2 tax
- $3,643 · $304/mo
- Expected delta
- $0/yr ($0/mo · 0.0%)
ⓘ Screening estimate from a state-policy table — verify with the county assessor before closing.
Climate risk First Street
- Flood 4/10 Moderate FEMA zone X (unshaded) · 22% chance over 30 yrs
- Wildfire 6/10 Major
- Heat 7/10 Severe 7 d/yr ≥103°F today · 19 d/yr by 30 yrs out
- Wind 1/10 Low
- Air quality 1/10 Low 0 unhealthy d/yr today · 0 by 30 yrs out
Nearby sold comps map
Loading sold comps map…
Walkable amenities ~0.75 mi
Loading nearby amenities…
Taxation est. · year 1
- Rental income
- $27,746
- − Mortgage interest
- −$6,162
- − Property taxes
- −$3,643
- − Insurance
- −$550
- − Repairs & maintenance
- −$2,220
- − Management
- −$2,220
- − HOA
- −$5,916
- − Depreciation
- −$3,200
- Taxable income
- $3,836
- Est. tax owed @ 24.0%
- −$921
- After-tax cash flow
- $3,968/yr
For passive investors: Depreciation is non-cash, so a rental often shows a tax loss while cash-flowing — sheltering income. Rental losses are passive: they offset passive income freely, and up to $25,000/yr can offset ordinary (W-2) income if you actively participate and your MAGI is under $100k (phasing out to $0 by $150k); unused losses carry forward. On sale, claimed depreciation is recaptured at up to 25%, and gains may owe capital-gains tax (a 1031 exchange can defer both). Figures are a year-1 estimate at your 24.0% rate — not tax advice; consult a CPA.
Schools (NCES district)
- District
- Washington District
- NCES district ID
- 4901140
- Math proficiency
- 42% ▼ -3.00%
- Reading proficiency
- 45% ▼ -3.00%
- Median HH income
- $50,861
- Composite
- 37.47/100
- National rank
- #4408
- State rank
- #37 of 80 in UT
Livability — St. George
No livability data for this city. (Only ~50 U.S. cities are tracked.)
Census & demographics
- Census place
- St. George, UT
- County
- Washington County · 179,216 people
- City population
- 101,579
- Metro
- St. George, UT
- Population (ZIP)
- 55,892
- Household income
- $91,054
- Rent vs Own
- Severe rent burden
- 1359.0
Population outlook (Washington County) Hauer SSP2
- Today (2025)
- 193,324 people
- By 2030
- 211,699 · +9.5%
- By 2040
- 246,449 · +27.5%
- By 2050
- 278,447 · +44.0%
- By 2075
- 342,734 · +77.3%
- By 2100
- 382,815 · +98.0%
Race, ethnicity, and origin ACS 2023
- Neighborhood character
- Predominantly White (83%)
- Race & ethnicity
- White 83% Hispanic / Latino 11% Two or more races 7% Native American 1%
- Hispanic origin (detail)
- Mexican 7%
- Common ancestry
- Slovak 5% Italian 2% Portuguese 2%
- Foreign-born
- 6% · Canada, Dominican Republic
- Languages at home
- 89% English-only · Spanish 8% Other Asian/Pacific 1%
Political lean MEDSL · Washington
- 2024 margin
- Solid R (+52.3) · D 23.0% · R 75.2% · Other 1.8%
- 2008→2024 swing
- +1.2pp toward D · 2008: -53.5pp · 2024: -52.3pp
- All cycles
- 2024: R+52.3 2020: R+51.7 2016: R+52.1 2012: R+67.0 2008: R+53.5
Not yet ingested
- Civics
- —
Market trends
- HPI YoY
- ▼ -210.13%
- Current HPI
- 218.2317
- Rent YoY
- ▲ 0.20%
- Metro
- St. George, UT
- State GDP YoY
- ▲ 3.54%
- F500 in state
- 2
Industry mix (Fortune 500 HQ in UT)
| Industry | F500 HQs | Revenue |
|---|---|---|
| Financial Services | 1 | $3B |
|
||
Price history
1 event — show timeline
- 2025-09-02 Listed $110,000 WFRMLS
Property tax history
+14.3%/yrLatest (2025): $3,643 · -8.4% YoY. Source: county tax records.
Cash-flow waterfall
monthlySold comps — $/sqft
last 12 mo · ≤1 miLoading sold comps…