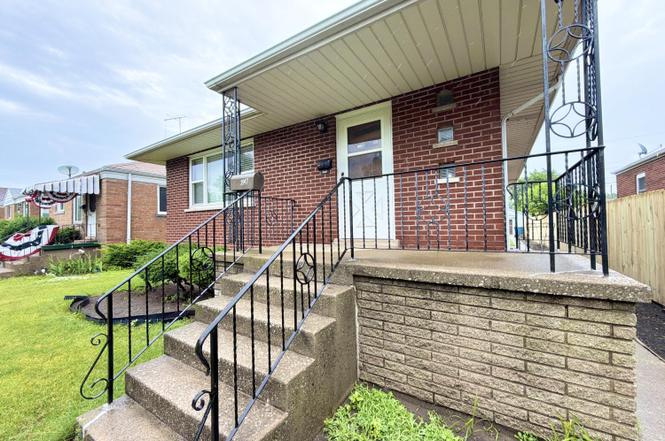
3947 Johnson Ave · Hammond, IN
Flood risk 4/10 · Minor
- FEMA flood zone
- X (unshaded)
- Chance of flooding over 30 yrs
- 0.21%
- Est. flood insurance / yr
- $473 – $860
Fire risk 2/10 · Minimal
- Est. fire insurance / yr
- $717 – $1,331
Heat risk 3/10 · Minor
- Hot days now (above 101°F)
- 7 days/yr
- Hot days in 30 yrs
- 15 days/yr
Wind risk 2/10 · Minimal
- Chance of severe wind over 30 yrs
- 1.0%
Air-quality risk 4/10 · Minor
- Unhealthy air days now
- 5 days/yr
- Unhealthy air days in 30 yrs
- 6 days/yr
Risk factors via First Street. Map © Google.
Why this score? — see what drove the B- grade
The composite is a weighted blend of 9 inputs, each scored 0–100. Each bar is that input's sub-score; the figure is the points it added to the 100-point composite (weight × sub-score).
- Cash flow +29.0/30.0
- DSCR +10.0/10.0
- Appreciation +9.5/10.0
- 1% rule +7.5/10.0
- Livability +3.5/5.0
- Rent growth +2.5/5.0
- Condition / age +2.5/5.0
- Schools +1.1/10.0
- ARV discount +0.0/15.0
$199,900
🖨 Deal sheet 📄 Offer letter ✓ Due diligence
Listing remarks MLS
PREVIOUS DEAL FEEL THROUGH DUE TO FINANCING Welcome home to this brick beauty. Many of the big ticket items have been replaced. The C/A and furnace have been replaced about 2 years ago. Water lines have been changed to copper. The living room, dining room and hallway carpet is a newer netural color. Basement has a partially finished 4th bedroom. Basement boasts glass block windows and yard is fenced.
Key facts
- Unfinished basement
- Bonus room
- Brick home
Tags
Property features AI
Exterior
- Parking: Off-street parking; On-street parking; Garage faces rear with alley access; 1-car garage
- Security: Smoke detector(s)
- Utilities: Electricity connected; Public water; Public sewer; Natural gas connected
- Home design: One-story home; Built in 1956
- Construction: Brick construction; Shingle roof; Full unfinished basement
- Exterior features: Private yard; Rain gutters; Chain link fencing; Neighborhood view; Blinds on windows; Garage(s) as an additional structure
Interior
- Kitchen: Range; Refrigerator
- Bedrooms: Primary bedroom; Additional bedrooms (total rooms include multiple bedrooms on main level)
- Flooring: Hardwood; Vinyl; Laminate
- Bathrooms: 1 full bathroom
- Heating & cooling: Forced air heating (natural gas); Central air conditioning
- Interior features: Ceiling fan(s); Smoke detector(s)
- Laundry & utility: Washer hookup; Dryer; Gas dryer hookup
Neighborhood map
What this means for you Summary
Snapshot
- This is a 3-bed/1.0-bath single-family listed at $200k.
Deal economics
- At list price, monthly cash flow is $683 ($8k/yr) — positive.
- The deal already cash-flows at list — no discount required.
- Meets the 1% rule at list price ($2k rent vs $200k).
- Cap rate 10.4% vs local median 5.8% in Hammond — top-decile yield for the area; either an underpriced asset or a hidden risk that comps aren't pricing in. Stress-test before assuming the spread holds.
Location & tenants
- Location reads 70/100 on livability (#143 in IN) — a middle-class / working-renter tenant base. Strengths: cost of living A+, housing A+, commute A; Watch: health & safety D+, employment D, crime F.
- School City Of Hammond (suburban): math 8% / reading 18% proficiency, ranked #289 of 301 in IN (top 96%) — low school quality limits family demand, transient renter base, plan for 1-2y turnover; 74% free/reduced lunch — lower-income household profile, screen leases tightly.
- Zoned schools: Abraham Lincoln Elementary School (math 8% / reading 13%, grade F, #914 of 994 statewide, top 92%, 546 students, 75% FRL); Henry W Eggers Middle School (math 5% / reading 17%, grade F, #312 of 330 statewide, top 95%, 855 students, 76% FRL); Hammond Central High School (math 8% / reading 37%, grade F, #339 of 369 statewide, top 93%, 1,863 students, 73% FRL) — zoned schools at 75% FRL track the district average.
- Market conditions: 28 active listings in the ZIP; 2 comparable units currently listed for rent nearby; 1,642 units permitted in Lake County in 2024 (14 in 5+ unit buildings).
Forward outlook
- In year one you build about $20k of equity ($1k loan paydown + $18k appreciation (9.1% local appreciation)).
- Lake County population projected to shrink 7% by 2050 — rents likely to lag national; underwrite the cash flow, not the appreciation.
- At projected returns (9.1% appreciation + 3.0% rent growth), your $56k cash investment doubles in ~2 years — after that, you're playing with house money.
- By year 2, paydown + projected appreciation supports a ~$31k cash-out refi (75% LTV) — recoverable capital for the next deal without selling this one.
Negotiation context
- Only 1 days on market — expect competitive offers; lowballing is unlikely to land.
- 2 sale attempts since 16y ago with the ask held roughly flat each time — persistent listings suggest the price (not the market) is what's stuck; bring a comps-based counter.
- Current owner paid $80k; list at $200k implies a 150% gain — meaningful room to come down on a strong offer.
Risks & watch-outs
- Watch-outs: built in 1956 — expect roof / HVAC / electrical / plumbing capex.
Questions for the listing agent
- Built in 1956 — when were the roof, HVAC, electrical panel, plumbing, and water heater last replaced?
- Is there a deadline driving the sale (1031 exchange, divorce, estate, relocation)? That informs how much negotiation room exists.
- Schools are F-rated, which usually means shorter tenancies and higher turnover. Who's the typical renter profile here, and what's been the actual vacancy rate?
- Crime grade is F in this area — have there been break-ins, vandalism, or insurance claims at this property in the last 3 years? What carrier currently insures it and at what premium?
- What's the average days-on-market for RENTAL listings here right now (not sales)? A rising rental-DOM trend means longer vacancies and softer asking-rent achievability than the comps imply.
- What's the recent tenant-quality profile in this submarket — average credit score on applications, eviction rate, late-payment / NSF rate, and stable-employment percentage? A property-management company in the area should have these aggregated.
- How much new for-sale + rental construction is in the pipeline within 1–3 miles? Heavy new supply typically softens prices + rents 12–24 months out; constrained supply supports both.
Investment metrics
- 1% rule
- 1.25% ✓
- Cap rate
- 10.39%
- Cash-on-cash
- 14.63%
- DSCR
- 1.65
- GRM
- 6.7
CMA / ARV
- ARV (on-the-fly)
- $159,057
- Comps found
- 12
Show comp detail 12 sales within ~0.75 mi
| Address | Dist | Beds/Ba | Sqft | Sold | Price | $/sf | Match |
|---|---|---|---|---|---|---|---|
| 3933 Henry Ave | 0.07mi | 3/1.0 | 1,141 (-2%) | 12mo | $194,500 | $170 | 84 |
| 4018 Henry Ave | 0.07mi | 3/1.0 | 1,026 (-12%) | 3mo | $205,000 | $200 | 75 |
| 3927 Towle Ave | 0.13mi | 2/1.0 (-1) | 1,015 (-13%) | 1mo | $174,900 | $172 | 67 |
| 522 137th St | 0.36mi | 3/1.0 | 1,080 (-7%) | 14mo | $195,000 | $181 | 60 |
| 546 Gostlin St | 0.66mi | 3/1.0 | 1,240 (+7%) | 1mo | $126,000 | $102 | 57 |
| 4140 Henry Ave | 0.24mi | 3/1.0 | 1,325 (+14%) | 10mo | $165,000 | $125 | 57 |
| 4415 Sheffield Ave | 0.60mi | 2/1.0 (-1) | 1,230 (+6%) | 6mo | $72,000 | $59 | 52 |
| 4227 Wabash Ave | 0.47mi | 3/1.5 | 1,268 (+9%) | 12mo | $174,000 | $137 | 51 |
| 3944 S Grover Ave | 0.42mi | 2/2.0 (-1) | 1,300 (+12%) | 2mo | $192,000 | $148 | 49 |
| 4412 Dearborn Ave | 0.73mi | 3/1.0 | 1,080 (-7%) | 6mo | $86,500 | $80 | 49 |
| 4324 Wabash Ave | 0.58mi | 2/1.0 (-1) | 1,100 (-5%) | 14mo | $135,000 | $123 | 48 |
| 4322 Sheffield Ave | 0.52mi | 2/1.0 (-1) | 1,032 (-11%) | 6mo | $53,500 | $52 | 47 |
Match score weights: distance 35% · size 25% · config 20% · recency 20%. Top-matched comps best support the ARV.
Projected returns pro-forma
9.08% appreciation · 3.0% rent growth · sell at horizon
- IRR
- 33.4%
- Equity multiple
- 3.50×
- Total profit
- $139,875
- Equity at exit
- $166,842
- IRR
- 29.2%
- Equity multiple
- 7.70×
- Total profit
- $375,077
- Equity at exit
- $346,580
Cash invested: $55,972 (down + closing). Projections, not guarantees.
Landlord ↔ Tenant lean methodology
- Overall (STATE)
- 90 Strongly Landlord-Friendly
- State Indiana
- 90 Strongly Landlord-Friendly · R+11
- County
- — inherits STATE
- City
- — inherits STATE
ZIP-level market 46327
- Home prices YoY
- 2.7%
- Active inventory
- 28
- Price-to-rent
- 6.7×
Monthly cashflow live
- Estimated rent
- $2,500 medium interval (Pro) →
- Mortgage (P&I)
- −$1,048
- Tax from tax record
- −$161 /mo · $1,931/yr
- Insurance
- −$83
- HOA
- −$0
- Vacancy / Maint / Mgmt
- −$525
- Net cashflow
- $683
Break-even live
UW: 25.0% down · 7.5% · 30yr · 1.5% tax · 5.0% vac · 8.0% maint · 8.0% mgmt
Financing live
Cash to close
- Down payment
- $49,975
- Closing costs
- $5,997
- Reserves months
- —
- Total cash needed
- —
Loan-product check · same deal, 3 products live
Conventional
25% down · 7.5% · 30yr
- Down + closing
- —
- Monthly P&I
- —
- Monthly cashflow
- —
- DSCR
- —
- Eligible?
- —
Personal DTI + credit; lowest rate.
DSCR
20% down · 8.5% · 30yr
- Down + closing
- —
- Monthly P&I
- —
- Monthly cashflow
- —
- DSCR
- —
- Eligible?
- —
No personal income docs; deal must DSCR.
Hard money
10% down · 12.0% · 12mo
- Down + closing
- —
- Monthly P&I
- —
- Monthly cashflow
- —
- DSCR
- —
- Eligible?
- —
Short-term bridge; refi at stabilization.
Rent comps 2 comps
| Address | Beds | Baths | Sqft | Rent | $/sqft | DOM | Units | Dist |
|---|---|---|---|---|---|---|---|---|
| 4624 Towle Ave Hammond, IN | 4.0 | 2.0 | 1500 | $2,500 | $1.67 | 2d | 1 | 0.82mi |
| 4624 Towle Ave Hammond, IN | 4.0 | 2.0 | 1500 | $2,500 | $1.67 | 1d | 1 | 0.82mi |
Listing history 2 events
-
2026-06-18remarks 699-char remark
-
2026-06-18$199,900 Active 1 DOM
ⓘ Source: listings_history table (triggers on properties + properties_extension) + one-shot
backfill from property_details.listing_events for pre-trigger history.
Tax reassessment forecast IN · Partial reset (capped growth)
- Current annual tax
- $1,931 · $161/mo
- Projected year-2 tax
- $1,931 · $161/mo
- Expected delta
- $0/yr ($0/mo · 0.0%)
ⓘ Screening estimate from a state-policy table — verify with the county assessor before closing.
Climate risk First Street
- Flood 4/10 Moderate FEMA zone X (unshaded) · 21% chance over 30 yrs
- Wildfire 2/10 Low
- Heat 3/10 Moderate 7 d/yr ≥101°F today · 15 d/yr by 30 yrs out
- Wind 2/10 Low 100% chance of damaging wind over 30 yrs
- Air quality 4/10 Moderate 5 unhealthy d/yr today · 6 by 30 yrs out
Nearby sold comps map
Loading sold comps map…
Walkable amenities ~0.75 mi
Loading nearby amenities…
Taxation est. · year 1
- Rental income
- $30,000
- − Mortgage interest
- −$11,198
- − Property taxes
- −$1,931
- − Insurance
- −$1,000
- − Repairs & maintenance
- −$2,400
- − Management
- −$2,400
- − Depreciation
- −$5,815
- Taxable income
- $5,257
- Est. tax owed @ 24.0%
- −$1,262
- After-tax cash flow
- $6,929/yr
For passive investors: Depreciation is non-cash, so a rental often shows a tax loss while cash-flowing — sheltering income. Rental losses are passive: they offset passive income freely, and up to $25,000/yr can offset ordinary (W-2) income if you actively participate and your MAGI is under $100k (phasing out to $0 by $150k); unused losses carry forward. On sale, claimed depreciation is recaptured at up to 25%, and gains may owe capital-gains tax (a 1031 exchange can defer both). Figures are a year-1 estimate at your 24.0% rate — not tax advice; consult a CPA.
Schools (NCES district)
- District
- School City Of Hammond
- NCES district ID
- 1804320
- Math proficiency
- 8% ▼ -18.00%
- Reading proficiency
- 18% ▼ -15.00%
- Median HH income
- $39,970
- Composite
- 11.11/100
- National rank
- #9730
- State rank
- #289 of 301 in IN
Livability — Hammond
- Score
- 70/100
- State rank
- #143
- US rank
- #7343
Category grades
Schools grade is shown separately in the Schools card above.
Census & demographics
- Census place
- Hammond, IN
- City population
- 58,809
- Population (ZIP)
- 10,797
Population outlook (Lake County) Hauer SSP2
- Today (2025)
- 484,026 people
- By 2030
- 478,091 · -1.2%
- By 2040
- 462,974 · -4.3%
- By 2050
- 449,894 · -7.1%
- By 2075
- 436,169 · -9.9%
- By 2100
- 426,607 · -11.9%
Race, ethnicity, and origin ACS 2023
- Neighborhood character
- Diverse neighborhood (Simpson 0.57)
- Race & ethnicity
- Hispanic / Latino 58% White 28% Black 13% Two or more races 9%
- Hispanic origin (detail)
- Mexican 54% Puerto Rican 3%
- Common ancestry
- Romanian 7% Iranian 2% Lithuanian 1%
- Foreign-born
- 21% · Canada
- Languages at home
- 60% English-only · Spanish 38% Russian/Polish/Slavic 1% Arabic 1%
Political lean MEDSL · Lake
- 2024 margin
- Lean D (+5.6) · D 52.1% · R 46.5% · Other 1.5%
- 2008→2024 swing
- -28.6pp toward R · 2008: 34.3pp · 2024: 5.6pp
- All cycles
- 2024: D+5.6 2020: D+15.1 2016: D+20.6 2012: D+31.0 2008: D+34.3
Not yet ingested
- Civics
- —
Market trends
- HPI YoY
- ▲ 9.08%
- Current HPI
- 343.2924
- Rent YoY
- —
- Metro
- —
- State GDP YoY
- ▲ 2.90%
- F500 in state
- 18
Industry mix (Fortune 500 HQ in IN)
| Industry | F500 HQs | Revenue |
|---|---|---|
| Industrial Machinery | 2 | $37B |
|
||
| Healthcare | 1 | $177B |
|
||
| Pharmaceuticals | 1 | $45B |
|
||
| Metals / Steel | 1 | $18B |
|
||
| Agriculture | 1 | $17B |
|
||
| Packaging | 1 | $12B |
|
||
Price history
+122.1% since first listed3 events — show timeline
- 2026-06-18 Listed $199,900 NIRA MLS as Distributed by MLS Grid
- 2010-10-26 Sold (MLS) $80,000 NIRA MLS as Distributed by MLS Grid
- 2010-06-28 Listed $90,000 NIRA MLS as Distributed by MLS Grid
Property tax history
+5.9%/yrLatest (2024): $1,931 · -1.6% YoY. Source: county tax records.
Cash-flow waterfall
monthlySold comps — $/sqft
last 12 mo · ≤1 miLoading sold comps…