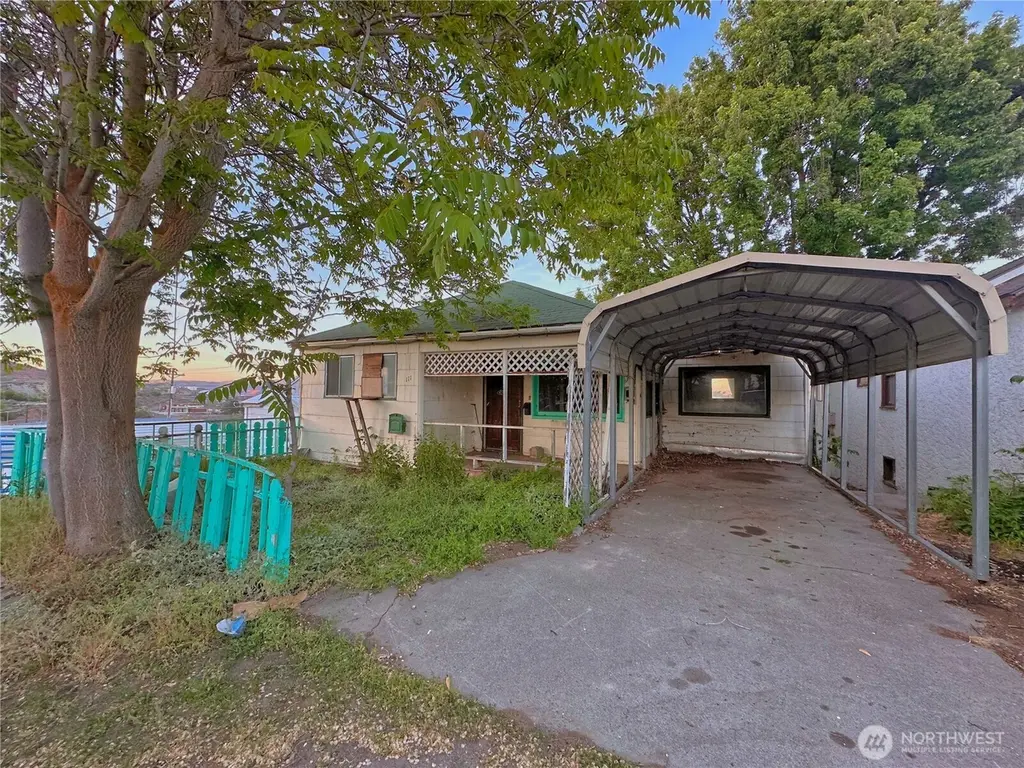
111 Young St · Grand Coulee, WA
Flood risk 1/10 · Minimal
- FEMA flood zone
- X (unshaded)
- Chance of flooding over 30 yrs
- 0.0%
- Est. flood insurance / yr
- $473 – $860
Fire risk 5/10 · Moderate
- Est. fire insurance / yr
- $604 – $1,122
Heat risk 4/10 · Minor
- Hot days now (above 93°F)
- 7 days/yr
- Hot days in 30 yrs
- 15 days/yr
Wind risk 1/10 · Minimal
- Chance of severe wind over 30 yrs
- —
Air-quality risk 10/10 · Severe
- Unhealthy air days now
- 17 days/yr
- Unhealthy air days in 30 yrs
- 19 days/yr
Risk factors via First Street. Map © Google.
Why this score? — see what drove the B grade
The composite is a weighted blend of 9 inputs, each scored 0–100. Each bar is that input's sub-score; the figure is the points it added to the 100-point composite (weight × sub-score).
- Cash flow +30.0/30.0
- 1% rule +10.0/10.0
- DSCR +10.0/10.0
- ARV discount +7.5/15.0
- Appreciation +6.3/10.0
- Livability +3.2/5.0
- Schools +3.0/10.0
- Rent growth +2.5/5.0
- Condition / age +2.5/5.0
$87,000
🖨 Deal sheet (PDF) 📄 Offer letter ✓ Due diligence
Listing remarks
PRICE REDUCED and PRICED $56K BELOW GRANT COUNTY ASSESSED VALUE! This diamond in the rough offers views of Crescent Bay & Lake Roosevelt that highlight 1948 FIXER-UPPER ready for your vision and improvements. 1-story home with a daylight basement offers 2 bedrooms, 1 full bath on the main level (1,104 SF). The lower level has a separate entrance, 2nd kitchen, 2 bonus rms/1 bath—ideal for multi-generational living or rental use. Total home size is 2,038SF. Detached 480SF garage provides additional storage or workspace. Situated on three lots totaling 9,092 SF for added space and storage flexibility. Separate power meters. 3 City lots. Deferred maintenance is present, making this
Key facts
- Separate entrance
- Daylight basement
- 2nd kitchen
Tags
Neighborhood map
What this means for you Summary
Snapshot
- This is a 4-bed/2.0-bath single-family listed at $87k.
Deal economics
- At list price, monthly cash flow is $689 ($8k/yr) — positive.
- The deal already cash-flows at list — no discount required.
- Meets the 1% rule at list price ($2k rent vs $87k).
- Recommended offer: $84k (3.0% below list) — sets the bar for market timing.
Location & tenants
- Location reads 63/100 on livability (#381 in WA) — a middle-class / working-renter tenant base. Strengths: cost of living A+, housing A+, crime A-; Watch: health & safety C-, schools F, amenities F.
- Grand Coulee Dam School District (rural): math 26% / reading 38% proficiency, ranked #262 of 291 in WA (top 90%) — families likely to look elsewhere, expect single-tenant / working-renter base with shorter leases.
- Market conditions: 35 active listings in the ZIP; 559 units permitted in Grant County in 2024 (35 in 5+ unit buildings).
Forward outlook
- In year one you build about $3k of equity ($601 loan paydown + $2k appreciation (2.6% local appreciation)).
- Grant County population projected at +16% by 2050 — long-run rental-demand tailwind backs the buy-and-hold thesis.
- At projected returns (2.6% appreciation + 3.0% rent growth), your $24k cash investment doubles in ~3 years — after that, you're playing with house money.
Negotiation context
- It's been on market 42 days — a 3% lower offer ($84k) is reasonable based on typical stale-listing flexibility.
- 2 sale attempts; this cycle's ask has dropped $10k (10%) from the opening price — seller is motivated, your offer sets the floor, not the list.
- Current owner paid $60k; 45% above their basis — modest negotiation headroom, anchor on the comps not their cost.
Risks & watch-outs
- Watch-outs: built in 1948 — expect roof / HVAC / electrical / plumbing capex.
- Climate carrying-cost: moderate wildfire risk — expect insurance premiums to compound above CPI over the hold.
Questions for the listing agent
- It's been on market 42 days. Have you received any prior offers? Is the seller open to a 3% concession, seller financing, or rate buy-down credit?
- Built in 1948 — when were the roof, HVAC, electrical panel, plumbing, and water heater last replaced?
- Is there a deadline driving the sale (1031 exchange, divorce, estate, relocation)? That informs how much negotiation room exists.
- Schools are F-rated, which usually means shorter tenancies and higher turnover. Who's the typical renter profile here, and what's been the actual vacancy rate?
- What's the average days-on-market for RENTAL listings here right now (not sales)? A rising rental-DOM trend means longer vacancies and softer asking-rent achievability than the comps imply.
- What's the recent tenant-quality profile in this submarket — average credit score on applications, eviction rate, late-payment / NSF rate, and stable-employment percentage? A property-management company in the area should have these aggregated.
- How much new for-sale + rental construction is in the pipeline within 1–3 miles? Heavy new supply typically softens prices + rents 12–24 months out; constrained supply supports both.
Investment metrics
- 1% rule
- 1.84% ✓
- Cap rate
- 15.79%
- Cash-on-cash
- 33.94%
- DSCR
- 2.51
- GRM
- 4.5
CMA / ARV
- ARV (median comp)
- $209,217
- List price
- $87,000
- Delta
- -58.42%
- Verdict
- UNDERPRICED
- Comps
- 9 within 1.0 mi
Show comp detail 2 sales within ~0.75 mi
| Address | Dist | Beds/Ba | Sqft | Sold | Price | $/sf | Match |
|---|---|---|---|---|---|---|---|
| 310 Center St | 0.19mi | 3/1.0 (-1) | 1,811 (-2%) | 1mo | $175,000 | $97 | 78 |
| 509 Cooper Sq | 0.63mi | 4/1.5 | 1,724 (-7%) | 11mo | $434,000 | $252 | 48 |
Match score weights: distance 35% · size 25% · config 20% · recency 20%. Top-matched comps best support the ARV.
Projected returns pro-forma
2.56% appreciation · 3.0% rent growth · sell at horizon
- IRR
- 38.9%
- Equity multiple
- 3.15×
- Total profit
- $52,334
- Equity at exit
- $36,959
- IRR
- 39.3%
- Equity multiple
- 6.23×
- Total profit
- $127,409
- Equity at exit
- $55,333
Cash invested: $24,360 (down + closing). Projections, not guarantees.
Landlord ↔ Tenant lean methodology
- Overall (STATE)
- 28 Tenant-Leaning
- State Washington
- 28 Tenant-Leaning · D+8
- County
- — inherits STATE
- City
- — inherits STATE
ZIP-level market 99133
- Home prices YoY
- 1.2%
- Active inventory
- 35
- Price-to-rent
- 4.5×
Monthly cashflow live
- Estimated rent
- $1,600 medium interval (Pro) →
- Mortgage (P&I)
- −$456
- Tax from tax record
- −$83 /mo · $995/yr
- Insurance
- −$36
- HOA
- −$0
- Vacancy / Maint / Mgmt
- −$336
- Net cashflow
- $689
Break-even live
Sensitivity live
| Price | -10% $738 | -5% $714 | +0% $689 | +5% $664 | +10% $640 |
|---|---|---|---|---|---|
| Rent | -10% $562 | -5% $626 | +0% $689 | +5% $752 | +10% $815 |
| Rate | -1.0pp $733 | -0.5pp $711 | base $689 | +0.5pp $666 | +1.0pp $643 |
UW: 25.0% down · 7.5% · 30yr · 1.5% tax · 5.0% vac · 8.0% maint · 8.0% mgmt
Financing live
Cash to close
- Down payment
- $21,750
- Closing costs
- $2,610
- Reserves months
- —
- Total cash needed
- —
Loan-product check · same deal, 3 products live
Conventional
25% down · 7.5% · 30yr
- Down + closing
- —
- Monthly P&I
- —
- Monthly cashflow
- —
- DSCR
- —
- Eligible?
- —
Personal DTI + credit; lowest rate.
DSCR
20% down · 8.5% · 30yr
- Down + closing
- —
- Monthly P&I
- —
- Monthly cashflow
- —
- DSCR
- —
- Eligible?
- —
No personal income docs; deal must DSCR.
Hard money
10% down · 12.0% · 12mo
- Down + closing
- —
- Monthly P&I
- —
- Monthly cashflow
- —
- DSCR
- —
- Eligible?
- —
Short-term bridge; refi at stabilization.
Listing history 22 events
-
2026-06-18status $87,000 Pending 42 DOM
-
2026-06-17days on market $87,000 Active 42 DOM
-
2026-06-16days on market $87,000 Active 41 DOM
-
2026-06-15days on market $87,000 Active 40 DOM
-
2026-06-15days on market $87,000 Active 39 DOM
-
2026-06-13days on market $87,000 Active 38 DOM
-
2026-06-12remarks 689-char remark
-
2026-06-12pricedays on market $87,000 Active 37 DOM
-
2026-06-09days on market $97,000 Active 34 DOM
-
2026-06-08days on market $97,000 Active 33 DOM
-
2026-06-08days on market $97,000 Active 32 DOM
-
2026-06-07days on market $97,000 Active 31 DOM
-
2026-06-03days on market $97,000 Active 28 DOM
-
2026-06-02days on market $97,000 Active 27 DOM
-
2026-06-01days on market $97,000 Active 26 DOM
-
2026-05-31days on market $97,000 Active 25 DOM
-
2026-05-13status Active
-
2026-03-27status Pending
-
2026-03-20$97,000 Active
-
2002-05-07soldstatus $60,000
-
1990-07-03soldstatus $39,500
-
1978-04-01soldstatus $27,000
ⓘ Source: listings_history table (triggers on properties + properties_extension) + one-shot
backfill from property_details.listing_events for pre-trigger history.
Tax reassessment forecast WA · Resets to sale price
- Current annual tax
- $995 · $83/mo
- Projected year-2 tax
- $995 · $83/mo
- Expected delta
- $0/yr ($0/mo · 0.0%)
ⓘ Screening estimate from a state-policy table — verify with the county assessor before closing.
Climate risk First Street
- Flood 1/10 Low FEMA zone X (unshaded) · 0% chance over 30 yrs
- Wildfire 5/10 Major
- Heat 4/10 Moderate 7 d/yr ≥93°F today · 15 d/yr by 30 yrs out
- Wind 1/10 Low
- Air quality 10/10 Extreme 17 unhealthy d/yr today · 19 by 30 yrs out
Nearby sold comps map
Loading sold comps map…
Walkable amenities ~0.75 mi
Loading nearby amenities…
Taxation est. · year 1
- Rental income
- $19,204
- − Mortgage interest
- −$4,873
- − Property taxes
- −$995
- − Insurance
- −$435
- − Repairs & maintenance
- −$1,536
- − Management
- −$1,536
- − Depreciation
- −$2,531
- Taxable income
- $7,297
- Est. tax owed @ 24.0%
- −$1,751
- After-tax cash flow
- $6,515/yr
For passive investors: Depreciation is non-cash, so a rental often shows a tax loss while cash-flowing — sheltering income. Rental losses are passive: they offset passive income freely, and up to $25,000/yr can offset ordinary (W-2) income if you actively participate and your MAGI is under $100k (phasing out to $0 by $150k); unused losses carry forward. On sale, claimed depreciation is recaptured at up to 25%, and gains may owe capital-gains tax (a 1031 exchange can defer both). Figures are a year-1 estimate at your 24.0% rate — not tax advice; consult a CPA.
Schools (NCES district)
- District
- Grand Coulee Dam School District
- NCES district ID
- 5303130
- Math proficiency
- 26% ▼ -3.00%
- Reading proficiency
- 38% ▬ 0.00%
- Median HH income
- $46,635
- Composite
- 30.27/100
- National rank
- #11563
- State rank
- #262 of 291 in WA
Livability — Grand Coulee
- Score
- 63/100
- State rank
- #381
- US rank
- #15025
Category grades
Schools grade is shown separately in the Schools card above.
Census & demographics
- Census place
- Grand Coulee, WA
- Population (ZIP)
- 1,341
Population outlook (Grant County) Hauer SSP2
- Today (2025)
- 99,356 people
- By 2030
- 102,107 · +2.8%
- By 2040
- 108,318 · +9.0%
- By 2050
- 114,712 · +15.5%
- By 2075
- 131,376 · +32.2%
- By 2100
- 146,163 · +47.1%
Race, ethnicity, and origin ACS 2023
- Neighborhood character
- Predominantly White (71%)
- Race & ethnicity
- White 71% Native American 14% Two or more races 12% Hispanic / Latino 9%
- Hispanic origin (detail)
- Mexican 7%
- Common ancestry
- Portuguese 6% Romanian 3% Italian 2%
- Foreign-born
- 1% · Canada
- Languages at home
- 92% English-only · Spanish 6% Other Asian/Pacific 1%
Political lean MEDSL · Grant
- 2024 margin
- Solid R (+37.5) · D 30.0% · R 67.4% · Other 2.6%
- 2008→2024 swing
- -9.9pp toward R · 2008: -27.5pp · 2024: -37.5pp
- All cycles
- 2024: R+37.5 2020: R+34.4 2016: R+37.9 2012: R+32.6 2008: R+27.5
Not yet ingested
- Civics
- —
Market trends
- HPI YoY
- ▲ 2.56%
- Current HPI
- 210.3573
- Rent YoY
- —
- Metro
- —
- State GDP YoY
- ▲ 4.65%
- F500 in state
- 22
Industry mix (Fortune 500 HQ in WA)
| Industry | F500 HQs | Revenue |
|---|---|---|
| Retail | 2 | $269B |
|
||
| Technology / Retail | 1 | $638B |
|
||
| Technology | 1 | $245B |
|
||
| Telecommunications | 1 | $38B |
|
||
| Food / Beverage | 1 | $36B |
|
||
| Automotive / Trucks | 1 | $34B |
|
||
Price history
+259.3% since first listed6 events — show timeline
- 2026-05-13 Relisted — NWMLS as Distributed by MLS Grid
- 2026-03-27 Pending — NWMLS as Distributed by MLS Grid
- 2026-03-20 Listed $97,000 NWMLS as Distributed by MLS Grid
- 2002-05-07 Sold (Public Records) $60,000 Public Records
- 1990-07-03 Sold (Public Records) $39,500 Public Records
- 1978-04-01 Sold (Public Records) $27,000 Public Records
Property tax history
+1.5%/yrLatest (2026): $995 · +0.0% YoY. Source: county tax records.
Cash-flow waterfall
monthlySold comps — $/sqft
last 12 mo · ≤1 miLoading sold comps…