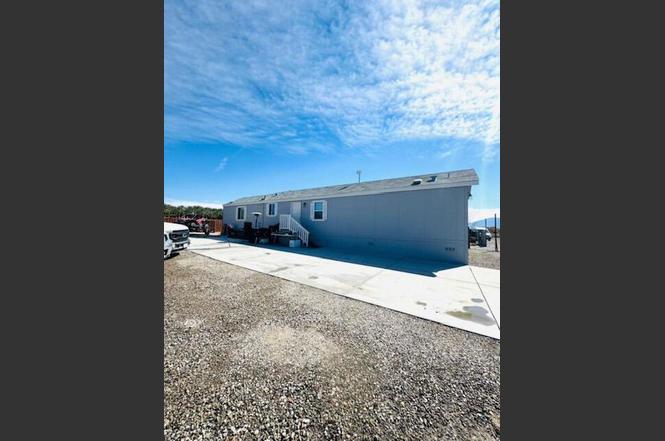
88755 Avenue 58 Spc 5 · Thermal, CA
Flood risk 1/10 · Minimal
- FEMA flood zone
- X (unshaded)
- Chance of flooding over 30 yrs
- 0.0%
- Est. flood insurance / yr
- $507 – $1,088
Fire risk 5/10 · Moderate
- Est. fire insurance / yr
- $659 – $1,223
Heat risk 10/10 · Severe
- Hot days now (above 115°F)
- 7 days/yr
- Hot days in 30 yrs
- 19 days/yr
Wind risk 1/10 · Minimal
- Chance of severe wind over 30 yrs
- —
Air-quality risk 4/10 · Minor
- Unhealthy air days now
- 4 days/yr
- Unhealthy air days in 30 yrs
- 5 days/yr
Risk factors via First Street. Map © Google.
Why this score? — see what drove the B- grade
The composite is a weighted blend of 9 inputs, each scored 0–100. Each bar is that input's sub-score; the figure is the points it added to the 100-point composite (weight × sub-score).
- Cash flow +27.1/30.0
- Appreciation +10.0/10.0
- DSCR +9.4/10.0
- ARV discount +7.5/15.0
- 1% rule +6.3/10.0
- Rent growth +2.5/5.0
- Condition / age +2.5/5.0
- Livability +2.3/5.0
- Schools +1.5/10.0
$159,999
🖨 Deal sheet 📄 Offer letter ✓ Due diligence
Listing remarks MLS
3 bedroom 2 bath. Year built is 2018. Come check this one out! It's a newer manufactured home, that gives you the option to move it if you would like! Located currently in the fast-growing city of Thermal CA. This home is ready for you to call home! Bring your family and get ready to fall in love!! (LAND IS NOT GUARANTEED, PRIVATE PARK OWNED)
Key facts
- 7,500 sq ft lot
- Garage
- Built 2018
Property features AI
Finance
- Other: Included in sale: stove, microwave; Disclosures: Home warranty plan; Sale terms: Cash, Submit, Private financing available; Possession at close of escrow; Short term rentals not allowed; Will not consider lease
- Financial info: Land lease annual amount: $10,200; Monthly space rent: $850; Land lease purchase: No; Land lease expiration year not provided
- HOA & community: No monthly association fee
Exterior
- Parking: 2 covered/assigned spaces; 2 carport spaces; Driveway parking; Total 6 parking spaces (including uncovered/other)
- Utilities: Sewer: Unknown; PUD: No
- Home design: Single-story; One level; Single wide mobile/manufactured home; Model: Silvercrest; Built by Champion; Manufacture year: 2018; Mobile home will remain
- Construction: Single wide manufactured home; Width: 68; Length: 134; Manufacturer: Champion; Builder model: Silvercrest; 1 story
- Exterior features: No security system reported; Detached property; Located on leased land (land lease)
Interior
- Kitchen: Stove (included); Microwave (included)
- Flooring: Laminate flooring
- Bathrooms: 2 full bathrooms
- Heating & cooling: Central heating; Central air conditioning
- Interior features: Unfurnished; Dining room; Living room; No fireplace
Neighborhood map
What this means for you Summary
Snapshot
- This is a 3-bed/2.0-bath manufactured listed at $160k.
Deal economics
- At list price, monthly cash flow is $452 ($5k/yr) — positive.
- The deal already cash-flows at list — no discount required.
- Meets the 1% rule at list price ($2k rent vs $160k).
- Recommended offer: $146k (9.0% below list) — sets the bar for market timing.
Location & tenants
- Location reads 46/100 on livability (#1,270 in CA) — a working-class tenant base; expect higher turnover. Strengths: crime B; Watch: housing D, schools F, amenities F.
- Coachella Valley Unified (rural): math 12% / reading 23% proficiency, ranked #481 of 517 in CA (top 93%) — low school quality limits family demand, transient renter base, plan for 1-2y turnover; 79% free/reduced lunch — lower-income household profile, screen leases tightly.
- Market conditions: 492 active listings in the ZIP; 9,195 units permitted in Riverside County in 2024 (1,512 in 5+ unit buildings).
Forward outlook
- In year one you build about $17k of equity ($1k loan paydown + $16k appreciation (10.0% local appreciation)).
- Riverside County population projected at +22% by 2050 — long-run rental-demand tailwind backs the buy-and-hold thesis.
- At projected returns (10.0% appreciation + 3.0% rent growth), your $45k cash investment doubles in ~2 years — after that, you're playing with house money.
- By year 3, paydown + projected appreciation supports a ~$43k cash-out refi (75% LTV) — recoverable capital for the next deal without selling this one.
Negotiation context
- It's been on market 108 days — a 9% lower offer ($146k) is reasonable based on typical stale-listing flexibility.
- 3 sale attempts since 3y ago with the ask held roughly flat each time — persistent listings suggest the price (not the market) is what's stuck; bring a comps-based counter.
- Current owner paid $108k; 48% above their basis — modest negotiation headroom, anchor on the comps not their cost.
Risks & watch-outs
- Climate carrying-cost: moderate wildfire risk; extreme-heat days projected 7→19/yr by 2055 (HVAC capex compounding) — expect insurance premiums to compound above CPI over the hold.
Questions for the listing agent
- It's been on market 108 days. Have you received any prior offers? Is the seller open to a 9% concession, seller financing, or rate buy-down credit?
- Why hasn't it sold? Are there any deal-killer items the seller is aware of (foundation, flood, title, zoning, code violations)?
- Is there a deadline driving the sale (1031 exchange, divorce, estate, relocation)? That informs how much negotiation room exists.
- Schools are F-rated, which usually means shorter tenancies and higher turnover. Who's the typical renter profile here, and what's been the actual vacancy rate?
- What's the average days-on-market for RENTAL listings here right now (not sales)? A rising rental-DOM trend means longer vacancies and softer asking-rent achievability than the comps imply.
- What's the recent tenant-quality profile in this submarket — average credit score on applications, eviction rate, late-payment / NSF rate, and stable-employment percentage? A property-management company in the area should have these aggregated.
- How much new for-sale + rental construction is in the pipeline within 1–3 miles? Heavy new supply typically softens prices + rents 12–24 months out; constrained supply supports both.
Investment metrics
- 1% rule
- 1.13% ✓
- Cap rate
- 9.69%
- Cash-on-cash
- 12.12%
- DSCR
- 1.54
- GRM
- 7.4
CMA / ARV
No comps found within radius.
Projected returns pro-forma
10.0% appreciation · 3.0% rent growth · sell at horizon
- IRR
- 33.2%
- Equity multiple
- 3.59×
- Total profit
- $115,901
- Equity at exit
- $144,140
- IRR
- 28.6%
- Equity multiple
- 8.11×
- Total profit
- $318,540
- Equity at exit
- $310,843
Cash invested: $44,800 (down + closing). Projections, not guarantees.
Landlord ↔ Tenant lean methodology
- Overall (STATE)
- 18 Strongly Tenant-Friendly
- State California
- 18 Strongly Tenant-Friendly · D+13
- County
- — inherits STATE
- City
- — inherits STATE
ZIP-level market 92274
- Home prices YoY
- 31.9%
- Active inventory
- 492
- Price-to-rent
- 7.4×
Monthly cashflow live
- Estimated rent
- $1,804 medium interval (Pro) →
- Mortgage (P&I)
- −$839
- Tax from tax record
- −$67 /mo · $800/yr
- Insurance
- −$67
- HOA
- −$0
- Vacancy / Maint / Mgmt
- −$379
- Net cashflow
- $452
Break-even live
UW: 25.0% down · 7.5% · 30yr · 1.5% tax · 5.0% vac · 8.0% maint · 8.0% mgmt
Financing live
Cash to close
- Down payment
- $40,000
- Closing costs
- $4,800
- Reserves months
- —
- Total cash needed
- —
Loan-product check · same deal, 3 products live
Conventional
25% down · 7.5% · 30yr
- Down + closing
- —
- Monthly P&I
- —
- Monthly cashflow
- —
- DSCR
- —
- Eligible?
- —
Personal DTI + credit; lowest rate.
DSCR
20% down · 8.5% · 30yr
- Down + closing
- —
- Monthly P&I
- —
- Monthly cashflow
- —
- DSCR
- —
- Eligible?
- —
No personal income docs; deal must DSCR.
Hard money
10% down · 12.0% · 12mo
- Down + closing
- —
- Monthly P&I
- —
- Monthly cashflow
- —
- DSCR
- —
- Eligible?
- —
Short-term bridge; refi at stabilization.
Listing history 20 events
-
2026-06-18days on market $159,999 Active 108 DOM
-
2026-06-17days on market $159,999 Active 107 DOM
-
2026-06-16days on market $159,999 Active 106 DOM
-
2026-06-15days on market $159,999 Active 105 DOM
-
2026-06-13days on market $159,999 Active 103 DOM
-
2026-06-13days on market $159,999 Active 102 DOM
-
2026-06-09days on market $159,999 Active 99 DOM
-
2026-06-08days on market $159,999 Active 98 DOM
-
2026-06-07days on market $159,999 Active 97 DOM
-
2026-06-04days on market $159,999 Active 94 DOM
-
2026-06-03days on market $159,999 Active 93 DOM
-
2026-06-02days on market $159,999 Active 92 DOM
-
2026-06-01days on market $159,999 Active 91 DOM
-
2026-05-31days on market $159,999 Active 90 DOM
-
2026-05-23status Active
-
2026-04-03historical Active Under Contract
-
2026-03-02$159,999 Active
-
2023-05-25soldstatus $108,000 Closed 344-char remark
Show marketing remark (344 chars)
3 bedroom 2 bath. Year built is 2018. Come check this one out! It's a newer manufactured home, that gives you the option to move it if you would like! Located currently in the fast-growing city of Thermal CA. This home is ready for you to call home! Bring your family and get ready to fall in love!! (LAND IS NOT GUARANTEED, PRIVATE PARK OWNED)
-
2023-04-12historical Active Under Contract 344-char remark
Show marketing remark (344 chars)
3 bedroom 2 bath. Year built is 2018. Come check this one out! It's a newer manufactured home, that gives you the option to move it if you would like! Located currently in the fast-growing city of Thermal CA. This home is ready for you to call home! Bring your family and get ready to fall in love!! (LAND IS NOT GUARANTEED, PRIVATE PARK OWNED)
-
2023-03-16$130,000 Active 344-char remark
Show marketing remark (344 chars)
3 bedroom 2 bath. Year built is 2018. Come check this one out! It's a newer manufactured home, that gives you the option to move it if you would like! Located currently in the fast-growing city of Thermal CA. This home is ready for you to call home! Bring your family and get ready to fall in love!! (LAND IS NOT GUARANTEED, PRIVATE PARK OWNED)
ⓘ Source: listings_history table (triggers on properties + properties_extension) + one-shot
backfill from property_details.listing_events for pre-trigger history.
Tax reassessment forecast CA · Resets to sale price
- Current annual tax
- $800 · $67/mo
- Projected year-2 tax
- $1,216 · $101/mo
- Expected delta
- +$416/yr (+$35/mo · 52.1%)
ⓘ Screening estimate from a state-policy table — verify with the county assessor before closing.
Climate risk First Street
- Flood 1/10 Low FEMA zone X (unshaded) · 0% chance over 30 yrs
- Wildfire 5/10 Major
- Heat 10/10 Extreme 7 d/yr ≥115°F today · 19 d/yr by 30 yrs out
- Wind 1/10 Low
- Air quality 4/10 Moderate 4 unhealthy d/yr today · 5 by 30 yrs out
Nearby sold comps map
Loading sold comps map…
Walkable amenities ~0.75 mi
Loading nearby amenities…
Taxation est. · year 1
- Rental income
- $21,642
- − Mortgage interest
- −$8,962
- − Property taxes
- −$800
- − Insurance
- −$800
- − Repairs & maintenance
- −$1,731
- − Management
- −$1,731
- − Depreciation
- −$4,655
- Taxable income
- $2,963
- Est. tax owed @ 24.0%
- −$711
- After-tax cash flow
- $4,718/yr
For passive investors: Depreciation is non-cash, so a rental often shows a tax loss while cash-flowing — sheltering income. Rental losses are passive: they offset passive income freely, and up to $25,000/yr can offset ordinary (W-2) income if you actively participate and your MAGI is under $100k (phasing out to $0 by $150k); unused losses carry forward. On sale, claimed depreciation is recaptured at up to 25%, and gains may owe capital-gains tax (a 1031 exchange can defer both). Figures are a year-1 estimate at your 24.0% rate — not tax advice; consult a CPA.
Schools (NCES district)
- District
- Coachella Valley Unified
- NCES district ID
- 0609070
- Math proficiency
- 12% ▼ -8.00%
- Reading proficiency
- 23% ▼ -6.00%
- Median HH income
- $37,683
- Composite
- 14.62/100
- National rank
- #9408
- State rank
- #481 of 517 in CA
Livability — Thermal
- Score
- 46/100
- State rank
- #1270
- US rank
- #26428
Category grades
Schools grade is shown separately in the Schools card above.
Census & demographics
- Census place
- Thermal, CA
- Population (ZIP)
- 17,909
Population outlook (Riverside County) Hauer SSP2
- Today (2025)
- 2,664,475 people
- By 2030
- 2,802,692 · +5.2%
- By 2040
- 3,050,904 · +14.5%
- By 2050
- 3,256,783 · +22.2%
- By 2075
- 3,655,058 · +37.2%
- By 2100
- 3,766,594 · +41.4%
Race, ethnicity, and origin ACS 2023
- Neighborhood character
- Predominantly Hispanic (88%)
- Race & ethnicity
- Hispanic / Latino 88% Two or more races 49% White 10%
- Hispanic origin (detail)
- Mexican 87%
- Common ancestry
- Italian 1% Portuguese 1%
- Foreign-born
- 42% · Canada
- Languages at home
- 24% English-only · Spanish 76%
Political lean MEDSL · Riverside
- 2024 margin
- Toss-up / Even · D 48.0% · R 49.3% · Other 2.6%
- 2008→2024 swing
- -3.6pp toward R · 2008: 2.3pp · 2024: -1.3pp
- All cycles
- 2024: R+1.3 2020: D+8.0 2016: D+4.3 2012: R+0.4 2008: D+2.3
Not yet ingested
- Civics
- —
Market trends
- HPI YoY
- ▲ 179.97%
- Current HPI
- 744.8454
- Rent YoY
- —
- Metro
- —
- State GDP YoY
- ▲ 3.21%
- F500 in state
- 116
Industry mix (Fortune 500 HQ in CA)
| Industry | F500 HQs | Revenue |
|---|---|---|
| Technology | 27 | $1,492B |
|
||
| Financial Services | 3 | $174B |
|
||
| Retail | 3 | $44B |
|
||
| Insurance | 3 | $26B |
|
||
| Media / Entertainment | 2 | $115B |
|
||
| Pharmaceuticals / Biotech | 2 | $62B |
|
||
Price history
+23.1% since first listed6 events — show timeline
- 2026-05-23 Relisted — GPSMLS
- 2026-04-03 Contingent — GPSMLS
- 2026-03-02 Listed $159,999 GPSMLS
- 2023-05-25 Sold (MLS) $108,000 GPSMLS
- 2023-04-12 Contingent — GPSMLS
- 2023-03-16 Listed $130,000 GPSMLS
Property tax history
+1.3%/yrLatest (2025): $800 · -10.1% YoY. Source: county tax records.
Cash-flow waterfall
monthlySold comps — $/sqft
last 12 mo · ≤1 miLoading sold comps…