 Multi-family
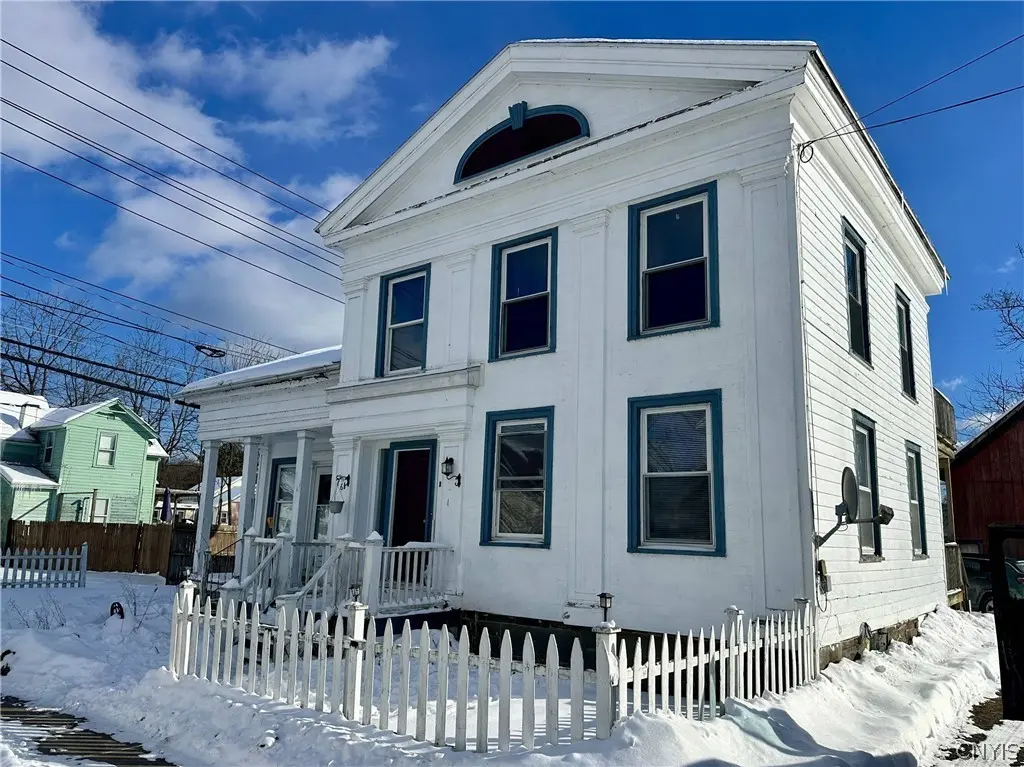
7 Miller St · Norwich, NY
Flood risk 1/10 · Minimal
- FEMA flood zone
- X (shaded)
- Chance of flooding over 30 yrs
- 0.0%
- Est. flood insurance / yr
- $473 – $860
Fire risk 1/10 · Minimal
- Est. fire insurance / yr
- $691 – $1,283
Heat risk 3/10 · Minor
- Hot days now (above 94°F)
- 7 days/yr
- Hot days in 30 yrs
- 17 days/yr
Wind risk 2/10 · Minimal
- Chance of severe wind over 30 yrs
- 1.0%
Air-quality risk 1/10 · Minimal
- Unhealthy air days now
- 0 days/yr
- Unhealthy air days in 30 yrs
- 0 days/yr
Risk factors via First Street. Map © Google.
Why this score? — see what drove the F grade
The composite is a weighted blend of 9 inputs, each scored 0–100. Each bar is that input's sub-score; the figure is the points it added to the 100-point composite (weight × sub-score).
- Appreciation +10.0/10.0
- ARV discount +7.5/15.0
- Schools +3.6/10.0
- Livability +3.5/5.0
- Rent growth +2.5/5.0
- Condition / age +2.5/5.0
- Cash flow +0.0/30.0
- 1% rule +0.0/10.0
- DSCR +0.0/10.0
$3,590,000
🖨 Deal sheet 📄 Offer letter ✓ Due diligence
Multi-family units
County records classify this as Multi-Family (2-4 Unit). Listing-text estimate: 1 unit. estimate disagrees with records
Listing remarks MLS
Centrally-located Chenango County, New York, has 22 multifamily buildings for sale with a total of 46 units and 99 bedrooms! Many units are renovated and command top rents for the markets, while others would benefit from cosmetic improvement. All units have excellent rental history, with low vacancy for the portfolio overall and consistently performing tenants. This largely rural area benefits from a stable investment market, and is positioned to benefit from the established of Micron just north.
Key facts
- 8 garage spots
- Built 1870
- Listed 118 days
Neighborhood map
What this means for you Summary
Snapshot
- This is a 5-bed/2.0-bath multifamily listed at $3.59M.
Deal economics
- At list price, monthly cash flow is $-24k ($-282k/yr) — negative.
- To cash-flow at today's rent, offer at most $185k (94.8% below list).
- To meet the 1% rule (rent ≥ 1% of price), the offer needs to be $162k (95.5% below list).
- Recommended offer: $162k (95.5% below list) — sets the bar for 1% rule.
- Cap rate -1.6% vs local median 4.1% in Norwich — below-typical yield; the buyer is paying a premium for something (appreciation thesis, condition, location) that the cap rate doesn't capture.
Location & tenants
- Location reads 70/100 on livability (#447 in NY) — a middle-class / working-renter tenant base. Strengths: cost of living A+, housing A+, health & safety A+; Watch: crime D, amenities F, commute F.
- Norwich City School District (town): math 42% / reading 43% proficiency, ranked #498 of 590 in NY (top 84%) — families likely to look elsewhere, expect single-tenant / working-renter base with shorter leases.
- Market conditions: 84 active listings in the ZIP; 151 units permitted in Chenango County in 2024 (96 in 5+ unit buildings).
Forward outlook
- In year one you build about $384k of equity ($25k loan paydown + $359k appreciation (10.0% local appreciation)).
- Chenango County population projected at -26% by 2050 — secular population decline; favor cash flow + early exit over multi-decade hold.
- By year 2, paydown + projected appreciation supports a ~$617k cash-out refi (75% LTV) — recoverable capital for the next deal without selling this one.
Negotiation context
- It's been on market 119 days — a 9% lower offer ($3.27M) is reasonable based on typical stale-listing flexibility.
- 2 sale attempts with the ask held roughly flat each time — persistent listings suggest the price (not the market) is what's stuck; bring a comps-based counter.
- Current owner paid $56k; list at $3.59M implies a 6311% gain — meaningful room to come down on a strong offer.
Risks & watch-outs
- Watch-outs: built in 1870 — expect roof / HVAC / electrical / plumbing capex.
Questions for the listing agent
- What do current leases actually rent for vs. the listed asking? Can we see a recent rent roll and the last 12 months of T-12 income?
- It's been on market 119 days. Have you received any prior offers? Is the seller open to a 95% concession, seller financing, or rate buy-down credit?
- Built in 1870 — when were the roof, HVAC, electrical panel, plumbing, and water heater last replaced?
- Why hasn't it sold? Are there any deal-killer items the seller is aware of (foundation, flood, title, zoning, code violations)?
- Is there a deadline driving the sale (1031 exchange, divorce, estate, relocation)? That informs how much negotiation room exists.
- Crime grade is D in this area — have there been break-ins, vandalism, or insurance claims at this property in the last 3 years? What carrier currently insures it and at what premium?
- The area grade is low — what's the realistic commute time and amenity access for the typical tenant pool here? Any planned neighborhood developments (good or bad) we should know about?
- What's the average days-on-market for RENTAL listings here right now (not sales)? A rising rental-DOM trend means longer vacancies and softer asking-rent achievability than the comps imply.
- What's the recent tenant-quality profile in this submarket — average credit score on applications, eviction rate, late-payment / NSF rate, and stable-employment percentage? A property-management company in the area should have these aggregated.
- How much new apartment / multifamily construction is in the pipeline within 1–3 miles? Heavy new supply (>2% of stock underway) typically softens rents 12–24 months out; light construction supports rent growth.
Investment metrics
- 1% rule
- 0.05% ✗
- Cap rate
- -1.57%
- Cash-on-cash
- -28.09%
- DSCR
- -0.25
- GRM
- 184.8
CMA / ARV
No comps found within radius.
Projected returns pro-forma
10.0% appreciation · 3.0% rent growth · sell at horizon
- IRR
- 5.3%
- Equity multiple
- 1.45×
- Total profit
- $456,531
- Equity at exit
- $3,234,156
- IRR
- 8.2%
- Equity multiple
- 3.51×
- Total profit
- $2,523,026
- Equity at exit
- $6,974,580
Cash invested: $1,005,200 (down + closing). Projections, not guarantees.
Landlord ↔ Tenant lean methodology
- Overall (STATE)
- 15 Strongly Tenant-Friendly
- State New York
- 15 Strongly Tenant-Friendly · D+10
- County
- — inherits STATE
- City
- — inherits STATE
ZIP-level market 13815
- Home prices YoY
- 8.2%
- Active inventory
- 84
- Price-to-rent
- 184.8×
Monthly cashflow live
- Estimated rent
- $1,619 medium interval (Pro) →
- Mortgage (P&I)
- −$18,826
- Tax est. 1.5%
- −$4,488 /mo · $53,850/yr
- Insurance
- −$1,496
- HOA
- −$0
- Vacancy / Maint / Mgmt
- −$340
- Net cashflow
- $-23,531
Break-even live
UW: 25.0% down · 7.5% · 30yr · 1.5% tax · 5.0% vac · 8.0% maint · 8.0% mgmt
Financing live
Cash to close
- Down payment
- $897,500
- Closing costs
- $107,700
- Reserves months
- —
- Total cash needed
- —
Loan-product check · same deal, 3 products live
Conventional
25% down · 7.5% · 30yr
- Down + closing
- —
- Monthly P&I
- —
- Monthly cashflow
- —
- DSCR
- —
- Eligible?
- —
Personal DTI + credit; lowest rate.
DSCR
20% down · 8.5% · 30yr
- Down + closing
- —
- Monthly P&I
- —
- Monthly cashflow
- —
- DSCR
- —
- Eligible?
- —
No personal income docs; deal must DSCR.
Hard money
10% down · 12.0% · 12mo
- Down + closing
- —
- Monthly P&I
- —
- Monthly cashflow
- —
- DSCR
- —
- Eligible?
- —
Short-term bridge; refi at stabilization.
Listing history 16 events
-
2026-06-17days on market $3,590,000 Active 119 DOM
-
2026-06-16days on market $3,590,000 Active 118 DOM
-
2026-06-15days on market $3,590,000 Active 117 DOM
-
2026-06-13days on market $3,590,000 Active 115 DOM
-
2026-06-12days on market $3,590,000 Active 114 DOM
-
2026-06-09days on market $3,590,000 Active 111 DOM
-
2026-06-08days on market $3,590,000 Active 110 DOM
-
2026-06-07days on market $3,590,000 Active 109 DOM
-
2026-06-07days on market $3,590,000 Active 108 DOM
-
2026-06-04days on market $3,590,000 Active 105 DOM
-
2026-06-02days on market $3,590,000 Active 104 DOM
-
2026-06-01days on market $3,590,000 Active 103 DOM
-
2026-05-31days on market $3,590,000 Active 102 DOM
-
2026-02-17$3,590,000 Active 501-char remark
Show marketing remark (501 chars)
Centrally-located Chenango County, New York, has 22 multifamily buildings for sale with a total of 46 units and 99 bedrooms! Many units are renovated and command top rents for the markets, while others would benefit from cosmetic improvement. All units have excellent rental history, with low vacancy for the portfolio overall and consistently performing tenants. This largely rural area benefits from a stable investment market, and is positioned to benefit from the established of Micron just north.
-
1990-05-30soldstatus $56,000
ⓘ Source: listings_history table (triggers on properties + properties_extension) + one-shot
backfill from property_details.listing_events for pre-trigger history.
Climate risk First Street
- Flood 1/10 Low FEMA zone X (shaded) · 0% chance over 30 yrs
- Wildfire 1/10 Low
- Heat 3/10 Moderate 7 d/yr ≥94°F today · 17 d/yr by 30 yrs out
- Wind 2/10 Low 100% chance of damaging wind over 30 yrs
- Air quality 1/10 Low 0 unhealthy d/yr today · 0 by 30 yrs out
Nearby sold comps map
Loading sold comps map…
Walkable amenities ~0.75 mi
Loading nearby amenities…
Taxation est. · year 1
- Rental income
- $19,423
- − Mortgage interest
- −$201,096
- − Property taxes
- −$53,850
- − Insurance
- −$17,950
- − Repairs & maintenance
- −$1,554
- − Management
- −$1,554
- − Depreciation
- −$104,436
- Taxable loss
- −$361,017
- Est. tax savings @ 24.0%
- +$86,644
- After-tax cash flow
- $-195,728/yr
For passive investors: Depreciation is non-cash, so a rental often shows a tax loss while cash-flowing — sheltering income. Rental losses are passive: they offset passive income freely, and up to $25,000/yr can offset ordinary (W-2) income if you actively participate and your MAGI is under $100k (phasing out to $0 by $150k); unused losses carry forward. On sale, claimed depreciation is recaptured at up to 25%, and gains may owe capital-gains tax (a 1031 exchange can defer both). Figures are a year-1 estimate at your 24.0% rate — not tax advice; consult a CPA.
Schools (NCES district)
- District
- Norwich City School District
- NCES district ID
- 3621330
- Math proficiency
- 42% ▼ -13.00%
- Reading proficiency
- 43% ▲ 1.00%
- Median HH income
- $40,687
- Composite
- 35.68/100
- National rank
- #4874
- State rank
- #498 of 590 in NY
Livability — Norwich
- Score
- 70/100
- State rank
- #447
- US rank
- #7857
Category grades
Schools grade is shown separately in the Schools card above.
Census & demographics
- Census place
- Norwich, NY
- City population
- 12,855
- Population (ZIP)
- 12,855
Population outlook (Chenango County) Hauer SSP2
- Today (2025)
- 45,669 people
- By 2030
- 43,484 · -4.8%
- By 2040
- 38,774 · -15.1%
- By 2050
- 34,000 · -25.6%
- By 2075
- 24,637 · -46.1%
- By 2100
- 16,452 · -64.0%
Race, ethnicity, and origin ACS 2023
- Neighborhood character
- Predominantly White (90%)
- Race & ethnicity
- White 90% Hispanic / Latino 5% Two or more races 4%
- Common ancestry
- Lithuanian 3% Slovak 2% Iranian 2%
- Foreign-born
- 4% · Canada
- Languages at home
- 95% English-only · Spanish 3% German/W. Germanic 0%
Political lean MEDSL · Chenango
- 2024 margin
- Strong R (+27.2) · D 36.4% · R 63.6%
- 2008→2024 swing
- -26.1pp toward R · 2008: -1.1pp · 2024: -27.2pp
- All cycles
- 2024: R+27.2 2020: R+23.3 2016: R+28.1 2012: R+3.4 2008: R+1.1
Not yet ingested
- Civics
- —
Market trends
- HPI YoY
- ▲ 21.23%
- Current HPI
- 280.463
- Rent YoY
- —
- Metro
- —
- State GDP YoY
- ▲ 2.60%
- F500 in state
- 92
Industry mix (Fortune 500 HQ in NY)
| Industry | F500 HQs | Revenue |
|---|---|---|
| Financial Services | 10 | $950B |
|
||
| Consumer Goods | 9 | $162B |
|
||
| Insurance | 4 | $225B |
|
||
| Telecommunications | 2 | $144B |
|
||
| Pharmaceuticals | 2 | $112B |
|
||
| Media / Entertainment | 2 | $69B |
|
||
Price history
+6310.7% since first listed3 events — show timeline
- 2026-02-17 Listed $3,590,000 GBAOR
- 2026-02-17 Listed $3,590,000 CNYIS
- 1990-05-30 Sold (Public Records) $56,000 Public Records
Property tax history
+1.5%/yrLatest (2025): $3,471 · +1.4% YoY. Source: county tax records.
Cash-flow waterfall
monthlySold comps — $/sqft
last 12 mo · ≤1 miLoading sold comps…