7624 Timberwood Dr · Jacksonville, FL
Flood risk 6/10 · Moderate
- FEMA flood zone
- X (unshaded)
- Chance of flooding over 30 yrs
- 0.72%
- Est. flood insurance / yr
- $507 – $1,088
Fire risk 6/10 · Moderate
- Est. fire insurance / yr
- $947 – $1,759
Heat risk 9/10 · Severe
- Hot days now (above 107°F)
- 7 days/yr
- Hot days in 30 yrs
- 20 days/yr
Wind risk 9/10 · Severe
- Chance of severe wind over 30 yrs
- 99.0%
Air-quality risk 4/10 · Minor
- Unhealthy air days now
- 5 days/yr
- Unhealthy air days in 30 yrs
- 5 days/yr
Risk factors via First Street. Map © Google.
Why this score? — see what drove the C grade
The composite is a weighted blend of 9 inputs, each scored 0–100. Each bar is that input's sub-score; the figure is the points it added to the 100-point composite (weight × sub-score).
- Cash flow +26.4/30.0
- DSCR +9.0/10.0
- 1% rule +6.1/10.0
- Appreciation +4.2/10.0
- Livability +4.2/5.0
- Schools +3.9/10.0
- Rent growth +2.6/5.0
- Condition / age +2.5/5.0
- ARV discount +0.4/15.0
$165,000
🖨 Deal sheet 📄 Offer letter ✓ Due diligence
Listing remarks MLS
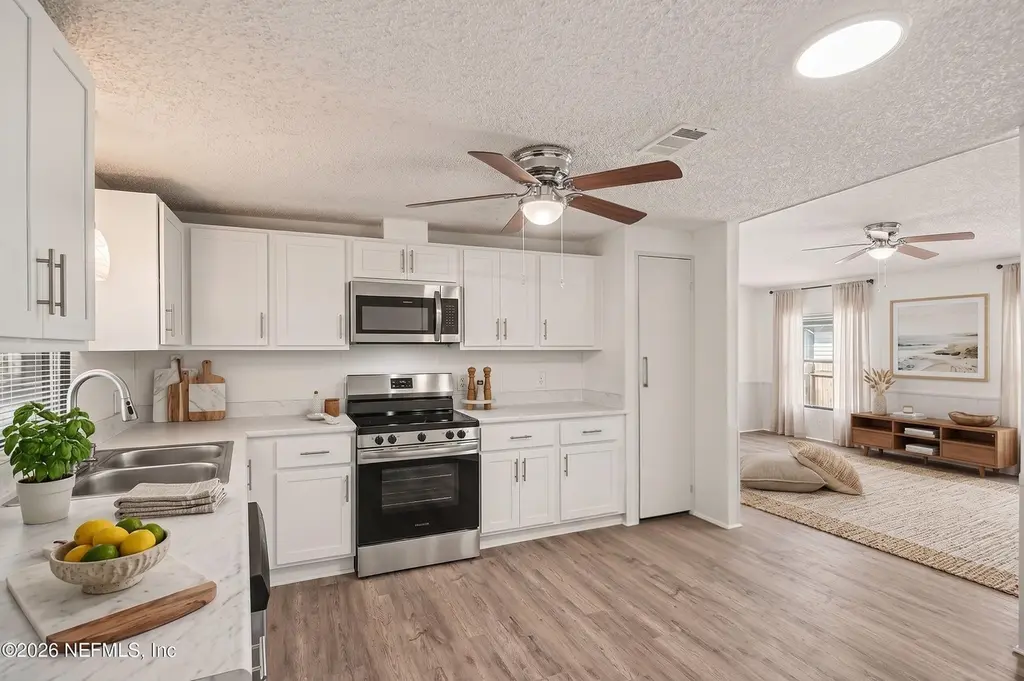
Priced to sell!! Charming 3 bed 2 bath home offers comfort, style, and convenience in an ideal location just minutes from the scenic S.t. Johns River. Inside, you'll find durable luxury vinyl plank flooring throughout the main living areas and cozy carpet in the bedrooms. Seller has since installed blinds in the home. The kitchen is perfect for cooking and entertaining, featuring brand new cabinets, sleek stainless steel appliances, and plenty of prep space. Enjoy bedrooms with spacious walk in closets. Both bathrooms have been tastefully upgraded with designer vanities, stylish tile work, and modern finishes. A beautiful lighting package adds warmth and character throughout the home. Washer and dryer are included! Outside, backyard shed provides great storage for tools and toys, while the oversized attached two-car carport offers plenty of covered parking and convenience.
Key facts
- Designer vanities
- Updated home
- Lvp flooring
Tags
Property features AI
Finance
- HOA & community: Homeowners association with $40 monthly fee; Not a senior community
Exterior
- Parking: Attached carport (2 spaces)
- Utilities: Public sewer; Sewer and water connected
- Home design: Double wide manufactured home; One level
- Construction: Vinyl siding; Shingle roof
- Exterior features: Front porch; Fenced yard; Shed(s) on the property; Paved city street frontage
Interior
- Kitchen: Dishwasher; Electric range; Microwave; Refrigerator
- Bedrooms: 3 bedrooms
- Flooring: Carpet; Vinyl
- Bathrooms: 2 full bathrooms
- Heating & cooling: Central heating; Central air conditioning
- Interior features: Ceiling fans; Primary bathroom includes shower (no tub); Split bedroom floor plan; Walk-in closet(s)
- Laundry & utility: Washer and dryer included; In-unit laundry with electric dryer hookup and washer hookup
Neighborhood map
What this means for you Summary
Snapshot
- This is a 3-bed/2.0-bath manufactured listed at $165k.
Deal economics
- At list price, monthly cash flow is $431 ($5k/yr) — positive.
- The deal already cash-flows at list — no discount required.
- Meets the 1% rule at list price ($2k rent vs $165k).
- Recommended offer: $163k (1.5% below list) — sets the bar for market timing.
- Cap rate 9.4% vs local median 4.0% in Jacksonville — top-decile yield for the area; either an underpriced asset or a hidden risk that comps aren't pricing in. Stress-test before assuming the spread holds.
Location & tenants
- Location reads 83/100 on livability (#50 in FL, #911 nationally) — a professional / high-income tenant draw. Strengths: amenities A+, commute A+, housing A+.
- Duval (urban): math 46% / reading 45% proficiency, ranked #48 of 73 in FL (top 66%) — families likely to look elsewhere, expect single-tenant / working-renter base with shorter leases.
- Zoned schools: Mandarin Oaks Elementary School (math 70% / reading 63%, grade B+, #473 of 2,144 statewide, top 23%, 988 students, 32% FRL); Twin Lakes Academy Middle School (math 43% / reading 38%, grade F, #360 of 571 statewide, top 64%, 1,076 students, 44% FRL); Atlantic Coast High School (math 37% / reading 48%, grade F, #264 of 667 statewide, top 41%, 2,537 students, 35% FRL).
- Market conditions: Rents flat; 513 active listings in the ZIP; 6 comparable units currently listed for rent nearby; rentals leasing fast (median 8d on market — plan ~1-2 weeks tenant-placement turnaround); 6,503 units permitted in Duval County in 2024 (1,131 in 5+ unit buildings).
Forward outlook
- Local home prices are declining (-1.6%/yr); year-one equity from $1k of loan paydown is wiped out by about $3k of value loss. Plan a longer hold.
- Duval County population projected at +19% by 2050 — long-run rental-demand tailwind backs the buy-and-hold thesis.
Negotiation context
- It's been on market 20 days — a 2% lower offer ($163k) is reasonable based on typical stale-listing flexibility.
- 3 sale attempts; this cycle's ask has dropped $20k (11%) from the opening price — seller is motivated, your offer sets the floor, not the list.
- Current owner paid $92k; list at $165k implies a 79% gain — meaningful room to come down on a strong offer.
Risks & watch-outs
- Climate carrying-cost: major flood risk; severe wind risk, 99% chance of damaging wind over 30y; major wildfire risk; extreme-heat days projected 7→20/yr by 2055 (HVAC capex compounding) — expect insurance premiums to compound above CPI over the hold.
Questions for the listing agent
- What does the HOA fee cover, when was the last increase, and are there any pending special assessments or reserve-fund shortfalls?
- Is there a deadline driving the sale (1031 exchange, divorce, estate, relocation)? That informs how much negotiation room exists.
- Schools are B-rated — typically a magnet for longer-tenancy family renters. What's the average tenant stay here, and is there a school-zone premium baked into asking?
- What's the average days-on-market for RENTAL listings here right now (not sales)? A rising rental-DOM trend means longer vacancies and softer asking-rent achievability than the comps imply.
- What's the recent tenant-quality profile in this submarket — average credit score on applications, eviction rate, late-payment / NSF rate, and stable-employment percentage? A property-management company in the area should have these aggregated.
- How much new for-sale + rental construction is in the pipeline within 1–3 miles? Heavy new supply typically softens prices + rents 12–24 months out; constrained supply supports both.
Investment metrics
- 1% rule
- 1.11% ✓
- Cap rate
- 9.43%
- Cash-on-cash
- 11.20%
- DSCR
- 1.50
- GRM
- 7.5
CMA / ARV
- ARV (on-the-fly)
- $142,560
- Comps found
- 4
Show comp detail 4 sales within ~0.75 mi
| Address | Dist | Beds/Ba | Sqft | Sold | Price | $/sf | Match |
|---|---|---|---|---|---|---|---|
| 7622 Sunwood Dr | 0.04mi | 3/2.0 | 1,288 (+8%) | 7mo | $154,000 | $120 | 78 |
| 7726 Plumwood Dr | 0.12mi | 3/2.0 | 1,288 (+8%) | 15mo | $165,000 | $128 | 68 |
| 7537 Covewood Dr | 0.13mi | 3/2.0 | 1,296 (+9%) | 15mo | $125,000 | $96 | 67 |
| 10905 Moorewood Dr | 0.11mi | 2/2.0 (-1) | 1,296 (+9%) | 18mo | $85,000 | $66 | 60 |
Match score weights: distance 35% · size 25% · config 20% · recency 20%. Top-matched comps best support the ARV.
Projected returns pro-forma
-1.58% appreciation · 0.39% rent growth · sell at horizon
- IRR
- 3.1%
- Equity multiple
- 1.13×
- Total profit
- $6,022
- Equity at exit
- $35,299
- IRR
- 8.2%
- Equity multiple
- 1.68×
- Total profit
- $31,254
- Equity at exit
- $33,332
Cash invested: $46,200 (down + closing). Projections, not guarantees.
Landlord ↔ Tenant lean methodology
- Overall (STATE)
- 87 Strongly Landlord-Friendly
- State Florida
- 87 Strongly Landlord-Friendly · R+3
- County
- — inherits STATE
- City
- — inherits STATE
ZIP-level market 32256
- Home prices YoY
- -0.7%
- Rents YoY
- 0.4%
- Active inventory
- 513
- Price-to-rent
- 7.5×
Monthly cashflow live
- Estimated rent
- $1,838 high interval (Pro) →
- Mortgage (P&I)
- −$865
- Tax from tax record
- −$47 /mo · $564/yr
- Insurance
- −$69
- HOA
- −$40
- Vacancy / Maint / Mgmt
- −$386
- Net cashflow
- $431
Break-even live
UW: 25.0% down · 7.5% · 30yr · 1.5% tax · 5.0% vac · 8.0% maint · 8.0% mgmt
Financing live
Cash to close
- Down payment
- $41,250
- Closing costs
- $4,950
- Reserves months
- —
- Total cash needed
- —
Loan-product check · same deal, 3 products live
Conventional
25% down · 7.5% · 30yr
- Down + closing
- —
- Monthly P&I
- —
- Monthly cashflow
- —
- DSCR
- —
- Eligible?
- —
Personal DTI + credit; lowest rate.
DSCR
20% down · 8.5% · 30yr
- Down + closing
- —
- Monthly P&I
- —
- Monthly cashflow
- —
- DSCR
- —
- Eligible?
- —
No personal income docs; deal must DSCR.
Hard money
10% down · 12.0% · 12mo
- Down + closing
- —
- Monthly P&I
- —
- Monthly cashflow
- —
- DSCR
- —
- Eligible?
- —
Short-term bridge; refi at stabilization.
Rent comps 6 comps
| Address | Beds | Baths | Sqft | Rent | $/sqft | DOM | Units | Dist |
|---|---|---|---|---|---|---|---|---|
| 10906 Olivewood Ln Jacksonville, FL | 2.0 | 1.0 | 784 | $1,495 | $1.91 | 17d | 1 | 0.09mi |
| 7703 Erinwood Ct E Jacksonville, FL | 3.0 | 2.0 | 1123 | $1,800 | $1.60 | 4d | 1 | 0.14mi |
| 10598 Cordgrass Ln Jacksonville, FL | 1.0–3.0 | 1.0–2.0 | 1131 | $2,305 | $2.04 | 1d | 29 | 0.71mi |
| 10654 Towns Way Jacksonville, FL | 2.0–3.0 | 2.5 | 1338 | $2,430 | $1.82 | 7d | 10 | 0.85mi |
| 11778 Beardgrass Way Jacksonville, FL | 2.0 | 2.5 | 1155 | $1,750 | $1.52 | 23d | 1 | 0.93mi |
| 11100 Domain Dr Jacksonville, FL | 1.0–2.0 | 1.0–2.5 | 1000 | $2,645 | $2.64 | 1d | 5 | 1.38mi |
HOA detail
- Monthly dues
- $40 · $480/yr
Listing history 14 events
-
2026-06-18days on market $165,000 Active 20 DOM
-
2026-06-17days on market $165,000 Active 19 DOM
-
2026-06-16days on market $165,000 Active 18 DOM
-
2026-06-15days on market $165,000 Active 17 DOM
-
2026-06-13days on market $165,000 Active 15 DOM
-
2026-06-13days on market $165,000 Active 14 DOM
-
2026-06-10days on market $165,000 Active 11 DOM
-
2026-06-08pricedays on market $165,000 Active 10 DOM
-
2026-06-07days on market $185,000 Active 9 DOM
-
2026-06-05days on market $185,000 Active 6 DOM
-
2026-06-03days on market $185,000 Active 5 DOM
-
2026-06-02days on market $185,000 Active 4 DOM
-
2026-06-01days on market $185,000 Active 3 DOM
-
2026-05-31days on market $185,000 Active 2 DOM
ⓘ Source: listings_history table (triggers on properties + properties_extension) + one-shot
backfill from property_details.listing_events for pre-trigger history.
Tax reassessment forecast FL · Resets to sale price
- Current annual tax
- $564 · $47/mo
- Projected year-2 tax
- $1,370 · $114/mo
- Expected delta
- +$806/yr (+$67/mo · 142.9%)
ⓘ Screening estimate from a state-policy table — verify with the county assessor before closing.
Climate risk First Street
- Flood 6/10 Major FEMA zone X (unshaded) · 72% chance over 30 yrs
- Wildfire 6/10 Major
- Heat 9/10 Extreme 7 d/yr ≥107°F today · 20 d/yr by 30 yrs out
- Wind 9/10 Extreme 99% chance of damaging wind over 30 yrs
- Air quality 4/10 Moderate 5 unhealthy d/yr today · 5 by 30 yrs out
Nearby sold comps map
Loading sold comps map…
Walkable amenities ~0.75 mi
Loading nearby amenities…
Taxation est. · year 1
- Rental income
- $22,056
- − Mortgage interest
- −$9,243
- − Property taxes
- −$564
- − Insurance
- −$825
- − Repairs & maintenance
- −$1,765
- − Management
- −$1,765
- − HOA
- −$480
- − Depreciation
- −$4,800
- Taxable income
- $2,616
- Est. tax owed @ 24.0%
- −$628
- After-tax cash flow
- $4,545/yr
For passive investors: Depreciation is non-cash, so a rental often shows a tax loss while cash-flowing — sheltering income. Rental losses are passive: they offset passive income freely, and up to $25,000/yr can offset ordinary (W-2) income if you actively participate and your MAGI is under $100k (phasing out to $0 by $150k); unused losses carry forward. On sale, claimed depreciation is recaptured at up to 25%, and gains may owe capital-gains tax (a 1031 exchange can defer both). Figures are a year-1 estimate at your 24.0% rate — not tax advice; consult a CPA.
Schools (NCES district)
- District
- Duval
- NCES district ID
- 1200480
- Math proficiency
- 46% ▼ -11.00%
- Reading proficiency
- 45% ▼ -4.00%
- Median HH income
- $48,987
- Composite
- 38.97/100
- National rank
- #4076
- State rank
- #48 of 73 in FL
Livability — Jacksonville
- Score
- 83/100
- State rank
- #50
- US rank
- #911
Category grades
Schools grade is shown separately in the Schools card above.
Census & demographics
- Census place
- Jacksonville, FL
- County
- Duval County · 1,015,274 people
- City population
- 979,034
- Metro
- Jacksonville, FL
- Population (ZIP)
- 58,192
- Household income
- $73,570
- Rent vs Own
- Severe rent burden
- 2706.0
Population outlook (Duval County) Hauer SSP2
- Today (2025)
- 1,013,010 people
- By 2030
- 1,059,228 · +4.6%
- By 2040
- 1,141,439 · +12.7%
- By 2050
- 1,205,258 · +19.0%
- By 2075
- 1,324,282 · +30.7%
- By 2100
- 1,319,620 · +30.3%
Race, ethnicity, and origin ACS 2023
- Neighborhood character
- Diverse neighborhood (Simpson 0.68)
- Race & ethnicity
- White 51% Black 18% Asian 13% Hispanic / Latino 11% Two or more races 10%
- Hispanic origin (detail)
- Puerto Rican 4% Cuban 1%
- Common ancestry
- Italian 4% Lithuanian 2% Romanian 2%
- Foreign-born
- 22% · Canada, Jamaica, China
- Languages at home
- 73% English-only · Spanish 9% Other Indo-European 6% Other Asian/Pacific 3%
Political lean MEDSL · Duval
- 2024 margin
- Toss-up / Even · D 48.7% · R 50.1% · Other 1.2%
- 2008→2024 swing
- +0.4pp no change · 2008: -1.9pp · 2024: -1.5pp
- All cycles
- 2024: R+1.5 2020: D+3.8 2016: R+1.5 2012: R+3.6 2008: R+1.9
Not yet ingested
- Civics
- —
Market trends
- HPI YoY
- ▼ -1.58%
- Current HPI
- 216.5115
- Rent YoY
- ▲ 0.39%
- Metro
- Jacksonville, FL
- State GDP YoY
- ▲ 3.28%
- F500 in state
- 36
Industry mix (Fortune 500 HQ in FL)
| Industry | F500 HQs | Revenue |
|---|---|---|
| Industrial Technology | 2 | $29B |
|
||
| Insurance | 2 | $17B |
|
||
| Retail | 1 | $60B |
|
||
| Technology Distribution | 1 | $58B |
|
||
| Homebuilding | 1 | $35B |
|
||
| Technology Manufacturing | 1 | $35B |
|
||
Price history
+2366.7% since first listed12 events — show timeline
- 2026-05-28 Listed $185,000 realMLS
- 2026-05-26 Relisted — realMLS
- 2026-05-26 Listing Removed — realMLS
- 2026-04-30 Listing Removed — realMLS
- 2026-04-10 Price Changed $174,500 realMLS
- 2026-04-06 Price Changed $175,000 realMLS
- 2026-03-30 Price Changed $179,900 realMLS
- 2026-03-12 Listed $199,900 realMLS
- 2026-01-08 Sold (Public Records) $92,000 Public Records
- 2001-10-22 Sold (Public Records) $53,800 Public Records
- 1985-07-01 Sold (Public Records) $7,500 Public Records
- 1982-11-27 Sold (Public Records) $7,500 Public Records
Property tax history
+7.1%/yrLatest (2025): $564 · +50.4% YoY. Source: county tax records.
Cash-flow waterfall
monthlySold comps — $/sqft
last 12 mo · ≤1 miLoading sold comps…