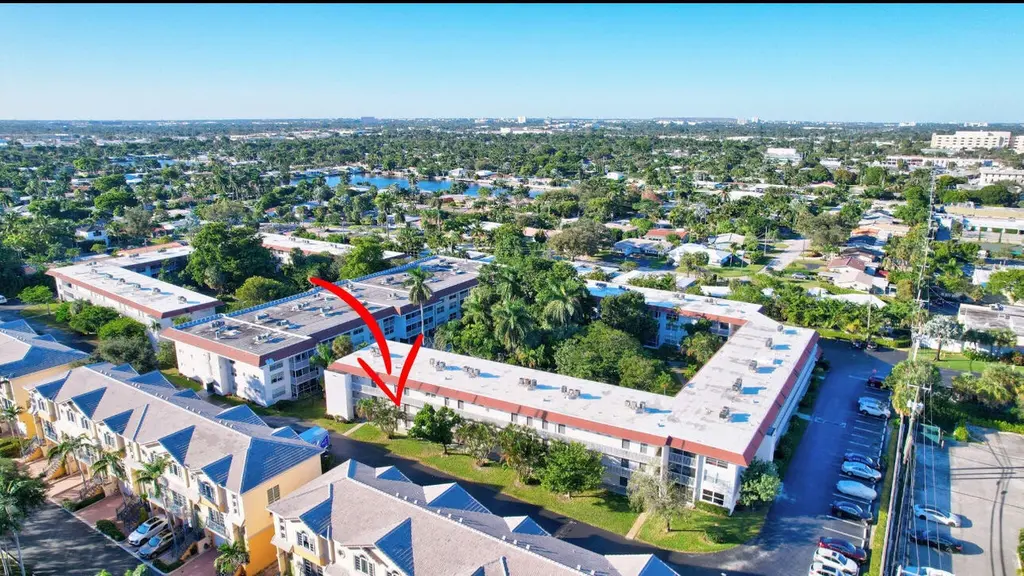
4025 N Federal Hwy Unit 212a · Oakland Park, FL
Flood risk 4/10 · Minor
- FEMA flood zone
- X (shaded)
- Chance of flooding over 30 yrs
- 0.22%
- Est. flood insurance / yr
- $507 – $1,088
Fire risk 1/10 · Minimal
- Est. fire insurance / yr
- $947 – $1,759
Heat risk 10/10 · Severe
- Hot days now (above 105°F)
- 7 days/yr
- Hot days in 30 yrs
- 27 days/yr
Wind risk 10/10 · Severe
- Chance of severe wind over 30 yrs
- 99.0%
Air-quality risk 2/10 · Minimal
- Unhealthy air days now
- 1 days/yr
- Unhealthy air days in 30 yrs
- 2 days/yr
Risk factors via First Street. Map © Google.
Why this score? — see what drove the C grade
The composite is a weighted blend of 9 inputs, each scored 0–100. Each bar is that input's sub-score; the figure is the points it added to the 100-point composite (weight × sub-score).
- Cash flow +19.2/30.0
- 1% rule +10.0/10.0
- ARV discount +7.5/15.0
- DSCR +6.1/10.0
- Schools +4.1/10.0
- Livability +3.9/5.0
- Rent growth +3.4/5.0
- Condition / age +2.5/5.0
- Appreciation +0.0/10.0
$224,000
🖨 Deal sheet (PDF) 📄 Offer letter ✓ Due diligence
Key facts
- $881 HOA
- 2 parking spots
- Community pool
Property features AI
Finance
- Financial info: Pets allowed (restrictions possible)
- HOA & community: Has association; Monthly HOA fee of 650; HOA covers sewer and pool service; Association amenities include pool, laundry, bike storage, and maintained community
Exterior
- Parking: Two parking spaces; No carport
- Utilities: Public water; Public sewer; Cable connected; Electricity connected; Water connected
- Home design: Condominium; Resale condition; Faces south; Three stories total
- Construction: Constructed with concrete block system (CBS); Concrete roof; Living area approximately 960
- Exterior features: Not waterfront; No waterfront features
Interior
- Kitchen: Dishwasher; Electric range; Refrigerator; Trash compactor
- Bedrooms: One bedroom on the main level
- Flooring: Ceramic tile
- Bathrooms: Two full bathrooms (one on the main level)
- Heating & cooling: Central heating; Other heating type listed; Central air conditioning
- Interior features: No notable interior built-in features listed; Unfurnished
- Laundry & utility: Laundry available (community/association amenity listed)
Neighborhood map
What this means for you Summary
Snapshot
- This is a 2-bed/2.0-bath condo listed at $224k.
Deal economics
- At list price, monthly cash flow is $243 ($3k/yr) — positive.
- The deal already cash-flows at list — no discount required.
- Meets the 1% rule at list price ($4k rent vs $224k).
- Recommended offer: $221k (1.5% below list) — sets the bar for market timing.
- Cap rate 7.6% vs local median 3.8% in Oakland Park — top-decile yield for the area; either an underpriced asset or a hidden risk that comps aren't pricing in. Stress-test before assuming the spread holds.
Location & tenants
- Location reads 77/100 on livability (#193 in FL, #3,082 nationally) — a middle-class / working-renter tenant base. Strengths: commute A+, housing A+, health & safety A+; Watch: amenities F.
- Broward (suburban): math 42% / reading 53% proficiency, ranked #46 of 73 in FL (top 63%) — families likely to look elsewhere, expect single-tenant / working-renter base with shorter leases.
- Zoned schools: Oakland Park Elementary School (math 31% / reading 45%, grade F, #1,587 of 2,144 statewide, top 74%, 576 students, 83% FRL); James S. Rickards Middle School (math 18% / reading 31%, grade F, #522 of 571 statewide, top 93%, 755 students, 75% FRL); Northeast High School (math 12% / reading 37%, grade F, #505 of 667 statewide, top 79%, 1,552 students, 69% FRL) — zoned schools average 76% FRL vs 51% district-wide (25 pts higher); higher-poverty schools than district average — tighter screening recommended.
- Zoned-school proficiency averages 29% at this address vs 48% district-wide (-18 pts) — the specific schools serving this property underperform the Broward average; the district grade overstates school quality for this exact location.
- Market conditions: Rents rising (+3.6%/yr); 739 active listings in the ZIP; 31 comparable units currently listed for rent nearby; rentals at typical pace (median 16d on market — plan ~3-4 weeks tenant-placement turnaround); solid renter incomes; 2,111 units permitted in Broward County in 2024 (1,265 in 5+ unit buildings).
Forward outlook
- Local home prices are declining (-3.0%/yr); year-one equity from $2k of loan paydown is wiped out by about $7k of value loss. Plan a longer hold.
- Broward County population projected at +34% by 2050 — long-run rental-demand tailwind backs the buy-and-hold thesis.
Negotiation context
- It's been on market 18 days — a 2% lower offer ($221k) is reasonable based on typical stale-listing flexibility.
- 7 sale attempts since 2y ago with the ask held roughly flat each time — persistent listings suggest the price (not the market) is what's stuck; bring a comps-based counter.
- Current owner paid $100k; list at $224k implies a 125% gain — meaningful room to come down on a strong offer.
Risks & watch-outs
- Watch-outs: HOA is 25% of rent.
- Climate carrying-cost: severe wind risk, 99% chance of damaging wind over 30y; extreme-heat days projected 7→27/yr by 2055 (HVAC capex compounding) — expect insurance premiums to compound above CPI over the hold.
Questions for the listing agent
- Built in 1966 — when were the roof, HVAC, electrical panel, plumbing, and water heater last replaced?
- What does the HOA fee cover, when was the last increase, and are there any pending special assessments or reserve-fund shortfalls?
- Any open or pending special assessments — roof, HVAC, plumbing, elevator, façade? What's the per-unit balance and payoff schedule, and is the seller paying it off at close or rolling it to the buyer?
- Is there a deadline driving the sale (1031 exchange, divorce, estate, relocation)? That informs how much negotiation room exists.
- Schools are D-rated, which usually means shorter tenancies and higher turnover. Who's the typical renter profile here, and what's been the actual vacancy rate?
- What's the average days-on-market for RENTAL listings here right now (not sales)? A rising rental-DOM trend means longer vacancies and softer asking-rent achievability than the comps imply.
- What's the recent tenant-quality profile in this submarket — average credit score on applications, eviction rate, late-payment / NSF rate, and stable-employment percentage? A property-management company in the area should have these aggregated.
- How much new apartment / multifamily construction is in the pipeline within 1–3 miles? Heavy new supply (>2% of stock underway) typically softens rents 12–24 months out; light construction supports rent growth.
Investment metrics
- 1% rule
- 1.58% ✓
- Cap rate
- 7.59%
- Cash-on-cash
- 4.65%
- DSCR
- 1.21
- GRM
- 5.3
CMA / ARV
No comps found within radius.
Projected returns pro-forma
-3.0% appreciation · 3.63% rent growth · sell at horizon
- IRR
- -7.6%
- Equity multiple
- 0.71×
- Total profit
- $-17,888
- Equity at exit
- $33,399
- IRR
- 3.4%
- Equity multiple
- 1.26×
- Total profit
- $16,491
- Equity at exit
- $19,367
Cash invested: $62,720 (down + closing). Projections, not guarantees.
Landlord ↔ Tenant lean methodology
- Overall (STATE)
- 87 Strongly Landlord-Friendly
- State Florida
- 87 Strongly Landlord-Friendly · R+3
- County
- — inherits STATE
- City
- — inherits STATE
ZIP-level market 33308
- Rents YoY
- 3.6%
- Active inventory
- 739
- Price-to-rent
- 5.3×
Monthly cashflow live
- Estimated rent
- $3,546 high interval (Pro) →
- Mortgage (P&I)
- −$1,175
- Tax from tax record
- −$410 /mo · $4,917/yr
- Insurance
- −$93
- HOA
- −$881
- Vacancy / Maint / Mgmt
- −$745
- Net cashflow
- $243
Break-even live
Sensitivity live
| Price | -10% $370 | -5% $306 | +0% $243 | +5% $180 | +10% $116 |
|---|---|---|---|---|---|
| Rent | -10% $-37 | -5% $103 | +0% $243 | +5% $383 | +10% $523 |
| Rate | -1.0pp $356 | -0.5pp $300 | base $243 | +0.5pp $185 | +1.0pp $126 |
UW: 25.0% down · 7.5% · 30yr · 1.5% tax · 5.0% vac · 8.0% maint · 8.0% mgmt
Financing live
Cash to close
- Down payment
- $56,000
- Closing costs
- $6,720
- Reserves months
- —
- Total cash needed
- —
Loan-product check · same deal, 3 products live
Conventional
25% down · 7.5% · 30yr
- Down + closing
- —
- Monthly P&I
- —
- Monthly cashflow
- —
- DSCR
- —
- Eligible?
- —
Personal DTI + credit; lowest rate.
DSCR
20% down · 8.5% · 30yr
- Down + closing
- —
- Monthly P&I
- —
- Monthly cashflow
- —
- DSCR
- —
- Eligible?
- —
No personal income docs; deal must DSCR.
Hard money
10% down · 12.0% · 12mo
- Down + closing
- —
- Monthly P&I
- —
- Monthly cashflow
- —
- DSCR
- —
- Eligible?
- —
Short-term bridge; refi at stabilization.
Rent comps 31 comps
| Address | Beds | Baths | Sqft | Rent | $/sqft | DOM | Units | Dist |
|---|---|---|---|---|---|---|---|---|
| 3411 N Federal Hwy Fort Lauderdale, FL | 2.0 | 1.0–2.0 | 754 | $3,545 | $4.70 | 3d | 59 | 0.54mi |
| 3781 NE 13th Ave Oakland Park, FL | 2.0 | 1.0 | 869 | $3,900 | $4.49 | 25d | 1 | 0.61mi |
| 1680 NE 34th Ln Unit B Oakland Park, FL | 2.0 | 2.0 | 1084 | $3,100 | $2.86 | 20d | 1 | 0.65mi |
| 3333 N Federal Hwy Fort Lauderdale, FL | 2.0 | 1.0–2.0 | 736 | $3,228 | $4.38 | 2d | 13 | 0.71mi |
| 3801 Dixie Hwy Oakland Park, FL | 2.0 | 1.0–2.0 | 944 | $3,584 | $3.80 | 15d | 45 | 0.74mi |
| 4800 Bayview Dr #303 Fort Lauderdale, FL | 2.0 | 2.0 | 1032 | $3,500 | $3.39 | 25d | 1 | 1.14mi |
| 3605 NE 32nd Ave Unit 209A Fort Lauderdale, FL | 2.0 | 2.0 | 1000 | $3,300 | $3.30 | 20d | 1 | 1.16mi |
| 3605 NE 32nd Ave Unit 209A Fort Lauderdale, FL | 2.0 | 2.0 | 1000 | $3,300 | $3.30 | 2d | 1 | 1.16mi |
| 351 NE 41st St Oakland Park, FL | 2.0 | 1.0 | 900 | $3,400 | $3.78 | 25d | 1 | 1.28mi |
| 2900 NE 30th St Unit H6 Fort Lauderdale, FL | 2.0 | 2.0 | 1040 | $3,200 | $3.08 | 25d | 1 | 1.29mi |
| 4601 NE 4th Ave Unit 1261561P Fort Lauderdale, FL | 3.0 | 2.0 | 1097 | $4,430 | $4.04 | 25d | 1 | 1.33mi |
| 3020 NE 32nd Ave Fort Lauderdale, FL | 1.0–2.0 | 1.0–2.0 | 920 | $4,300 | $4.67 | 5d | 4 | 1.38mi |
| 3000 NE 6th Ave Wilton Manors, FL | 2.0 | 1.0–2.0 | 921 | $3,510 | $3.81 | 3d | 20 | 1.38mi |
| 261 NE 45th St Fort Lauderdale, FL | 3.0 | 2.0 | 997 | $3,247 | $3.26 | 25d | 1 | 1.40mi |
| 3031 N Ocean Blvd Fort Lauderdale, FL | 2.0–3.0 | 2.0 | 1290 | $3,200 | $2.48 | 5d | 4 | 1.44mi |
| 3031 N Ocean Blvd Fort Lauderdale, FL | 2.0–3.0 | 2.0 | 1325 | $3,475 | $2.62 | 18d | 3 | 1.44mi |
| 3031 N Ocean Blvd Fort Lauderdale, FL | 2.0–3.0 | 2.0 | 1290 | $3,400 | $2.63 | 8d | 3 | 1.44mi |
| 3900 Galt Ocean Dr Fort Lauderdale, FL | 2.0 | 1.5–2.0 | 1429 | $4,675 | $3.27 | 17d | 3 | 1.45mi |
| 3900 Galt Ocean Dr Fort Lauderdale, FL | 1.0–2.0 | 1.5–2.0 | 1429 | $5,600 | $3.92 | 18d | 4 | 1.45mi |
| 3850 Galt Ocean Dr #1003 Fort Lauderdale, FL | 1.0 | 1.5 | 1050 | $3,300 | $3.14 | 25d | 1 | 1.46mi |
| 3800 Galt Ocean Dr Fort Lauderdale, FL | 1.0–2.0 | 1.5–2.0 | 1071 | $4,250 | $3.97 | 3d | 7 | 1.47mi |
| 3800 Galt Ocean Dr Fort Lauderdale, FL | 1.0–2.0 | 1.5–2.0 | 1071 | $4,500 | $4.20 | 5d | 6 | 1.47mi |
| 3800 Galt Ocean Dr Fort Lauderdale, FL | 1.0–2.0 | 1.5–2.0 | 1071 | $4,500 | $4.20 | 15d | 6 | 1.47mi |
| 4010 Galt Ocean Dr Fort Lauderdale, FL | 2.0–3.0 | 2.0 | 810 | $5,000 | $6.17 | 6d | 2 | 1.47mi |
| 4010 Galt Ocean Dr Fort Lauderdale, FL | 2.0–3.0 | 2.0 | 810 | $3,200 | $3.95 | 5d | 3 | 1.47mi |
| 3700 Galt Ocean Dr Fort Lauderdale, FL | 1.0–2.0 | 1.5–2.0 | 1025 | $3,790 | $3.70 | 25d | 2 | 1.47mi |
| 4013 N Ocean Dr #102 Fort Lauderdale, FL | 1.0 | 1.5 | 790 | $3,500 | $4.43 | 25d | 1 | 1.49mi |
| 3500 Galt Ocean Dr #2314 Fort Lauderdale, FL | 1.0 | 1.5 | 1088 | $4,500 | $4.14 | 5d | 1 | 1.49mi |
| 3500 Galt Ocean Dr #2314 Fort Lauderdale, FL | 1.0 | 1.5 | 1088 | $4,500 | $4.14 | 25d | 1 | 1.49mi |
| 3430 Galt Ocean Dr Fort Lauderdale, FL | 1.0–4.0 | 1.5–4.5 | 2873 | $6,320 | $2.20 | 8d | 4 | 1.49mi |
| 3430 Galt Ocean Dr Fort Lauderdale, FL | 1.0–2.0 | 1.5–2.0 | 1343 | $4,980 | $3.71 | 16d | 4 | 1.49mi |
HOA detail condo
- Monthly dues
- $881 · $10,572/yr
- Assessments
- None detected in remarks — confirm with the listing agent.
Listing history 12 events
-
2026-06-18days on market $224,000 Active 18 DOM
-
2026-06-17days on market $224,000 Active 17 DOM
-
2026-06-16days on market $224,000 Active 16 DOM
-
2026-06-15days on market $224,000 Active 15 DOM
-
2026-06-13days on market $224,000 Active 13 DOM
-
2026-06-09days on market $224,000 Active 9 DOM
-
2026-06-08days on market $224,000 Active 8 DOM
-
2026-06-07days on market $224,000 Active 7 DOM
-
2026-06-04days on market $224,000 Active 4 DOM
-
2026-06-03days on market $224,000 Active 3 DOM
-
2026-06-02days on market $224,000 Active 2 DOM
-
2026-06-01$224,000 Active 1 DOM
ⓘ Source: listings_history table (triggers on properties + properties_extension) + one-shot
backfill from property_details.listing_events for pre-trigger history.
Tax reassessment forecast FL · Resets to sale price
- Current annual tax
- $4,917 · $410/mo
- Projected year-2 tax
- $4,917 · $410/mo
- Expected delta
- $0/yr ($0/mo · 0.0%)
ⓘ Screening estimate from a state-policy table — verify with the county assessor before closing.
Climate risk First Street
- Flood 4/10 Moderate FEMA zone X (shaded) · 22% chance over 30 yrs
- Wildfire 1/10 Low
- Heat 10/10 Extreme 7 d/yr ≥105°F today · 27 d/yr by 30 yrs out
- Wind 10/10 Extreme 99% chance of damaging wind over 30 yrs
- Air quality 2/10 Low 1 unhealthy d/yr today · 2 by 30 yrs out
Nearby sold comps map
Loading sold comps map…
Walkable amenities ~0.75 mi
Loading nearby amenities…
Taxation est. · year 1
- Rental income
- $42,557
- − Mortgage interest
- −$12,547
- − Property taxes
- −$4,917
- − Insurance
- −$1,120
- − Repairs & maintenance
- −$3,405
- − Management
- −$3,405
- − HOA
- −$10,572
- − Depreciation
- −$6,516
- Taxable income
- $76
- Est. tax owed @ 24.0%
- −$18
- After-tax cash flow
- $2,897/yr
For passive investors: Depreciation is non-cash, so a rental often shows a tax loss while cash-flowing — sheltering income. Rental losses are passive: they offset passive income freely, and up to $25,000/yr can offset ordinary (W-2) income if you actively participate and your MAGI is under $100k (phasing out to $0 by $150k); unused losses carry forward. On sale, claimed depreciation is recaptured at up to 25%, and gains may owe capital-gains tax (a 1031 exchange can defer both). Figures are a year-1 estimate at your 24.0% rate — not tax advice; consult a CPA.
Schools (NCES district)
- District
- Broward
- NCES district ID
- 1200180
- Math proficiency
- 42% ▼ -18.00%
- Reading proficiency
- 53% ▼ -5.00%
- Median HH income
- $52,139
- Composite
- 40.88/100
- National rank
- #3621
- State rank
- #46 of 73 in FL
Livability — Oakland Park
- Score
- 77/100
- State rank
- #193
- US rank
- #3082
Category grades
Schools grade is shown separately in the Schools card above.
Census & demographics
- Census place
- Oakland Park, FL
- County
- Broward County · 1,963,430 people
- City population
- 68,410
- Metro
- Miami-Fort Lauderdale-Pompano Beach, FL
- Population (ZIP)
- 27,935
- Household income
- $93,879
- Rent vs Own
- Severe rent burden
- 912.0
Population outlook (Broward County) Hauer SSP2
- Today (2025)
- 2,207,033 people
- By 2030
- 2,360,704 · +7.0%
- By 2040
- 2,661,208 · +20.6%
- By 2050
- 2,946,698 · +33.5%
- By 2075
- 3,602,273 · +63.2%
- By 2100
- 3,970,984 · +79.9%
Race, ethnicity, and origin ACS 2023
- Neighborhood character
- Predominantly White (75%)
- Race & ethnicity
- White 75% Hispanic / Latino 16% Two or more races 14% Asian 3% Black 2%
- Hispanic origin (detail)
- Puerto Rican 2% Cuban 3%
- Common ancestry
- Romanian 4% Lithuanian 3% Scotch-Irish 3%
- Foreign-born
- 24% · Canada, Jamaica, Dominican Republic
- Languages at home
- 75% English-only · Spanish 14% Other Indo-European 5% Russian/Polish/Slavic 2%
Political lean MEDSL · Broward
- 2024 margin
- D (+17.0) · D 58.0% · R 41.0%
- 2008→2024 swing
- -17.8pp toward R · 2008: 34.7pp · 2024: 17.0pp
- All cycles
- 2024: D+17.0 2020: D+29.8 2016: D+35.0 2012: D+34.9 2008: D+34.7
Not yet ingested
- Civics
- —
Market trends
- HPI YoY
- ▼ -417.95%
- Current HPI
- 325.3902
- Rent YoY
- ▲ 3.63%
- Metro
- Miami-Fort Lauderdale-Pompano Beach, FL
- State GDP YoY
- ▲ 3.28%
- F500 in state
- 36
Industry mix (Fortune 500 HQ in FL)
| Industry | F500 HQs | Revenue |
|---|---|---|
| Industrial Technology | 2 | $29B |
|
||
| Insurance | 2 | $17B |
|
||
| Retail | 1 | $60B |
|
||
| Technology Distribution | 1 | $58B |
|
||
| Homebuilding | 1 | $35B |
|
||
| Technology Manufacturing | 1 | $35B |
|
||
Price history
+307.3% since first listed20 events — show timeline
- 2026-05-29 Listed $224,000 Beaches MLS
- 2025-05-06 Rental Removed $1,800 GFLMLS
- 2025-04-19 Listing Removed — Beaches MLS
- 2025-04-18 Listed for Rent $1,800 GFLMLS
- 2025-04-18 Rental Removed $1,800 RMLSFL
- 2025-04-18 Listed for Rent $1,800 RMLSFL
- 2025-04-17 Price Changed $200,000 Beaches MLS
- 2025-04-17 Relisted — Beaches MLS
- 2025-04-17 Listing Removed — Beaches MLS
- 2025-04-09 Listed $213,000 Beaches MLS
- 2025-04-02 Listing Removed — Beaches MLS
- 2025-03-21 Price Changed $215,000 Beaches MLS
- 2025-03-06 Price Changed $219,000 Beaches MLS
- 2025-01-27 Relisted — Beaches MLS
- 2025-01-16 Pending — Beaches MLS
- 2024-12-01 Listed $220,000 Beaches MLS
- 2009-09-01 Sold (Public Records) $99,500 Public Records
- 2004-08-03 Sold (Public Records) $160,000 Public Records
- 1999-06-23 Sold (Public Records) $46,000 Public Records
- 1982-01-01 Sold (Public Records) $55,000 Public Records
Property tax history
+7.5%/yrLatest (2025): $4,917 · +2.0% YoY. Source: county tax records.
Cash-flow waterfall
monthlySold comps — $/sqft
last 12 mo · ≤1 miLoading sold comps…