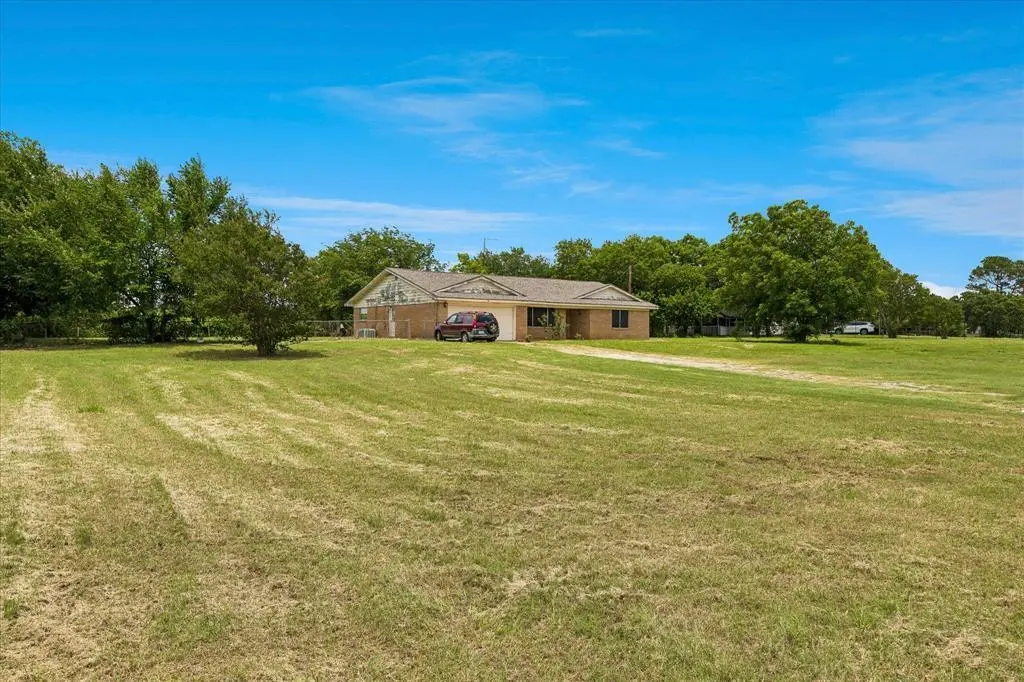
1955 E Renfro St · Burleson, TX
Flood risk 1/10 · Minimal
- FEMA flood zone
- X (unshaded)
- Chance of flooding over 30 yrs
- 0.0%
- Est. flood insurance / yr
- $507 – $1,088
Fire risk 5/10 · Moderate
- Est. fire insurance / yr
- $1,222 – $2,270
Heat risk 7/10 · Major
- Hot days now (above 110°F)
- 7 days/yr
- Hot days in 30 yrs
- 25 days/yr
Wind risk 6/10 · Moderate
- Chance of severe wind over 30 yrs
- 27.0%
Air-quality risk 2/10 · Minimal
- Unhealthy air days now
- 2 days/yr
- Unhealthy air days in 30 yrs
- 2 days/yr
Risk factors via First Street. Map © Google.
Why this score? — see what drove the B- grade
The composite is a weighted blend of 9 inputs, each scored 0–100. Each bar is that input's sub-score; the figure is the points it added to the 100-point composite (weight × sub-score).
- Cash flow +25.4/30.0
- ARV discount +15.0/15.0
- DSCR +8.4/10.0
- 1% rule +7.4/10.0
- Schools +4.0/10.0
- Livability +4.0/5.0
- Rent growth +2.9/5.0
- Condition / age +2.5/5.0
- Appreciation +0.0/10.0
$185,000
🖨 Deal sheet 📄 Offer letter ✓ Due diligence
Listing remarks MLS
Great location for this 3 bedroom, 2 bath brick home on approximately 1.45 acres. Two living areas and big brick fireplace with family room open to dining and kitchen. All bedrooms are good size and have walk-in closets. Covered patio with big fenced in back yard and nice shade tree. This home is being sold AS IS.
Key facts
- Brand-new roof
- 1.45 acre lot
- 2 garage spots
Tags
Property features AI
Finance
- Other: Survey available; No municipal utility district
- Financial info: Listing terms include cash and conventional financing
- HOA & community: No association
Exterior
- Parking: Covered parking for 2 vehicles; 2-car attached garage with garage door opener (garage faces front); Concrete driveway and additional parking
- Security: Video surveillance present
- Utilities: Asphalt access; Co-op water; Electricity available and connected; Septic system
- Home design: Single-family residence; Attached property; One story; Composition roof; Accessory unit on property
- Construction: Built in 1962 (preowned); Brick and wood construction; Slab foundation
- Exterior features: Covered porch(es); Covered patio/porch; Chain link fencing; Shed(s); Large backyard with grass; Acreage lot with few trees
Interior
- Kitchen: Disposal; Electric cooktop; Electric oven; Microwave; Built-in cabinets; Tile counters
- Bedrooms: 3 bedrooms total; Primary bedroom with ensuite bath and walk-in closet (main level)
- Flooring: Concrete flooring; Laminate flooring
- Bathrooms: 2 full bathrooms
- Heating & cooling: Propane heating; Window unit(s) for cooling
- Interior features: Cable TV available; High-speed internet available; Tile counters; Window coverings; 9 total rooms; Two living areas; One dining area; One level
- Laundry & utility: Accessory unit (approx. 200 sq ft) with separate utilities/equipment indicated
Neighborhood map
What this means for you Summary
Snapshot
- This is a 4-bed/2.0-bath single-family listed at $185k.
Deal economics
- At list price, monthly cash flow is $429 ($5k/yr) — positive.
- The deal already cash-flows at list — no discount required.
- Meets the 1% rule at list price ($2k rent vs $185k).
- Cap rate 9.1% vs local median 3.5% in Burleson — top-decile yield for the area; either an underpriced asset or a hidden risk that comps aren't pricing in. Stress-test before assuming the spread holds.
Location & tenants
- Location reads 79/100 on livability (#53 in TX, #2,133 nationally) — a middle-class / working-renter tenant base. Strengths: employment A+, cost of living A+, housing A+; Watch: amenities F, commute F.
- Burleson ISD (suburban): math 41% / reading 48% proficiency, ranked #236 of 826 in TX (top 29%) — families likely to look elsewhere, expect single-tenant / working-renter base with shorter leases.
- Zoned schools: William Stribling El (math 48% / reading 49%, grade D, #950 of 4,322 statewide, top 22%, 476 students, 33% FRL) — zoned schools at 33% FRL track the district average.
- Market conditions: Rents rising (+1.8%/yr); 679 active listings in the ZIP; 3 comparable units currently listed for rent nearby; rentals at typical pace (median 21d on market — plan ~3-4 weeks tenant-placement turnaround); solid renter incomes; 2,152 units permitted in Johnson County in 2024 (76 in 5+ unit buildings).
Forward outlook
- Local home prices are declining (-3.0%/yr); year-one equity from $1k of loan paydown is wiped out by about $6k of value loss. Plan a longer hold.
- Johnson County population projected at +24% by 2050 — long-run rental-demand tailwind backs the buy-and-hold thesis.
Negotiation context
- Only 4 days on market — expect competitive offers; lowballing is unlikely to land.
- 3 sale attempts since 14y ago with the ask held roughly flat each time — persistent listings suggest the price (not the market) is what's stuck; bring a comps-based counter.
Risks & watch-outs
- Climate carrying-cost: major wind risk, 27% chance of damaging wind over 30y; moderate wildfire risk; extreme-heat days projected 7→25/yr by 2055 (HVAC capex compounding) — expect insurance premiums to compound above CPI over the hold.
Questions for the listing agent
- Built in 1962 — when were the roof, HVAC, electrical panel, plumbing, and water heater last replaced?
- Is there a deadline driving the sale (1031 exchange, divorce, estate, relocation)? That informs how much negotiation room exists.
- What's the average days-on-market for RENTAL listings here right now (not sales)? A rising rental-DOM trend means longer vacancies and softer asking-rent achievability than the comps imply.
- What's the recent tenant-quality profile in this submarket — average credit score on applications, eviction rate, late-payment / NSF rate, and stable-employment percentage? A property-management company in the area should have these aggregated.
- How much new for-sale + rental construction is in the pipeline within 1–3 miles? Heavy new supply typically softens prices + rents 12–24 months out; constrained supply supports both.
Investment metrics
- 1% rule
- 1.24% ✓
- Cap rate
- 9.07%
- Cash-on-cash
- 9.93%
- DSCR
- 1.44
- GRM
- 6.7
CMA / ARV
- ARV (on-the-fly)
- $366,990
- Comps found
- 9
Show comp detail 9 sales within ~0.75 mi
| Address | Dist | Beds/Ba | Sqft | Sold | Price | $/sf | Match |
|---|---|---|---|---|---|---|---|
| 1929 Mary Ann Ln | 0.23mi | 3/2.0 (-1) | 1,845 (-2%) | 6mo | $342,000 | $185 | 76 |
| 1901 Mary Ann Ln | 0.23mi | 4/2.0 | 1,830 (-3%) | 21mo | $349,000 | $191 | 67 |
| 713 Stribling Dr | 0.15mi | 3/2.0 (-1) | 2,041 (+8%) | 16mo | $374,500 | $183 | 61 |
| 1925 Mary Ann Ln | 0.23mi | 3/2.0 (-1) | 1,772 (-6%) | 21mo | $344,999 | $195 | 57 |
| 2120 Ladonna Ct | 0.29mi | 4/2.0 | 2,055 (+9%) | 18mo | $474,900 | $231 | 56 |
| 2641 Donald Rd | 0.58mi | 4/2.0 | 2,024 (+8%) | 18mo | $615,000 | $304 | 45 |
| 649 Jacie Ct | 0.65mi | 3/2.0 (-1) | 2,018 (+7%) | 10mo | $382,500 | $190 | 44 |
| 632 Jacie Ct | 0.59mi | 3/2.0 (-1) | 1,928 (+2%) | 24mo | $375,000 | $195 | 43 |
| 2345 Christopher Ln | 0.60mi | 4/2.0 | 2,081 (+11%) | 15mo | $535,000 | $257 | 42 |
Match score weights: distance 35% · size 25% · config 20% · recency 20%. Top-matched comps best support the ARV.
Projected returns pro-forma
-3.0% appreciation · 1.78% rent growth · sell at horizon
- IRR
- -2.8%
- Equity multiple
- 0.90×
- Total profit
- $-5,360
- Equity at exit
- $27,584
- IRR
- 5.5%
- Equity multiple
- 1.38×
- Total profit
- $19,745
- Equity at exit
- $15,995
Cash invested: $51,800 (down + closing). Projections, not guarantees.
Landlord ↔ Tenant lean methodology
- Overall (STATE)
- 87 Strongly Landlord-Friendly
- State Texas
- 87 Strongly Landlord-Friendly · R+5
- County
- — inherits STATE
- City
- — inherits STATE
ZIP-level market 76028
- Home prices YoY
- -33.4%
- Rents YoY
- 1.8%
- Active inventory
- 679
- Price-to-rent
- 6.7×
Monthly cashflow live
- Estimated rent
- $2,297 medium interval (Pro) →
- Mortgage (P&I)
- −$970
- Tax from tax record
- −$339 /mo · $4,067/yr
- Insurance
- −$77
- HOA
- −$0
- Vacancy / Maint / Mgmt
- −$482
- Net cashflow
- $429
Break-even live
UW: 25.0% down · 7.5% · 30yr · 1.5% tax · 5.0% vac · 8.0% maint · 8.0% mgmt
Financing live
Cash to close
- Down payment
- $46,250
- Closing costs
- $5,550
- Reserves months
- —
- Total cash needed
- —
Loan-product check · same deal, 3 products live
Conventional
25% down · 7.5% · 30yr
- Down + closing
- —
- Monthly P&I
- —
- Monthly cashflow
- —
- DSCR
- —
- Eligible?
- —
Personal DTI + credit; lowest rate.
DSCR
20% down · 8.5% · 30yr
- Down + closing
- —
- Monthly P&I
- —
- Monthly cashflow
- —
- DSCR
- —
- Eligible?
- —
No personal income docs; deal must DSCR.
Hard money
10% down · 12.0% · 12mo
- Down + closing
- —
- Monthly P&I
- —
- Monthly cashflow
- —
- DSCR
- —
- Eligible?
- —
Short-term bridge; refi at stabilization.
Rent comps 3 comps
| Address | Beds | Baths | Sqft | Rent | $/sqft | DOM | Units | Dist |
|---|---|---|---|---|---|---|---|---|
| 1948 Lariat Ln Burleson, TX | 3.0 | 2.0 | 2128 | $1,675 | $0.79 | 20d | 1 | 0.32mi |
| 1125 Marigold Dr Burleson, TX | 3.0 | 2.0 | 2243 | $2,811 | $1.25 | 24d | 1 | 0.88mi |
| 1449 Bennett Dr Burleson, TX | 4.0 | 2.0 | 2617 | $2,850 | $1.09 | 1d | 1 | 1.13mi |
Listing history 6 events
-
2026-06-17status $185,000 Pending 4 DOM
-
2026-06-16days on market $185,000 Active 4 DOM
-
2026-06-15remarks 693-char remark
-
2026-06-15days on market $185,000 Active 3 DOM
-
2026-06-13remarks 675-char remark
-
2026-06-13$185,000 Active 1 DOM
ⓘ Source: listings_history table (triggers on properties + properties_extension) + one-shot
backfill from property_details.listing_events for pre-trigger history.
Tax reassessment forecast TX · Resets to sale price
- Current annual tax
- $4,067 · $339/mo
- Projected year-2 tax
- $4,067 · $339/mo
- Expected delta
- $0/yr ($0/mo · 0.0%)
ⓘ Screening estimate from a state-policy table — verify with the county assessor before closing.
Climate risk First Street
- Flood 1/10 Low FEMA zone X (unshaded) · 0% chance over 30 yrs
- Wildfire 5/10 Major
- Heat 7/10 Severe 7 d/yr ≥110°F today · 25 d/yr by 30 yrs out
- Wind 6/10 Major 27% chance of damaging wind over 30 yrs
- Air quality 2/10 Low 2 unhealthy d/yr today · 2 by 30 yrs out
Nearby sold comps map
Loading sold comps map…
Walkable amenities ~0.75 mi
Loading nearby amenities…
Taxation est. · year 1
- Rental income
- $27,567
- − Mortgage interest
- −$10,363
- − Property taxes
- −$4,067
- − Insurance
- −$925
- − Repairs & maintenance
- −$2,205
- − Management
- −$2,205
- − Depreciation
- −$5,382
- Taxable income
- $2,420
- Est. tax owed @ 24.0%
- −$581
- After-tax cash flow
- $4,564/yr
For passive investors: Depreciation is non-cash, so a rental often shows a tax loss while cash-flowing — sheltering income. Rental losses are passive: they offset passive income freely, and up to $25,000/yr can offset ordinary (W-2) income if you actively participate and your MAGI is under $100k (phasing out to $0 by $150k); unused losses carry forward. On sale, claimed depreciation is recaptured at up to 25%, and gains may owe capital-gains tax (a 1031 exchange can defer both). Figures are a year-1 estimate at your 24.0% rate — not tax advice; consult a CPA.
Schools (NCES district)
- District
- Burleson ISD
- NCES district ID
- 4812180
- Math proficiency
- 41% ▼ -8.00%
- Reading proficiency
- 48% ▼ -3.00%
- Median HH income
- $69,349
- Composite
- 40.05/100
- National rank
- #3818
- State rank
- #236 of 826 in TX
Livability — Burleson
- Score
- 79/100
- State rank
- #53
- US rank
- #2133
Category grades
Schools grade is shown separately in the Schools card above.
Census & demographics
- Census place
- Burleson, TX
- County
- Johnson County · 147,987 people
- City population
- 81,549
- Metro
- Dallas-Fort Worth-Arlington, TX
- Population (ZIP)
- 81,549
- Household income
- $101,138
- Rent vs Own
- Severe rent burden
- 1117.0
Population outlook (Johnson County) Hauer SSP2
- Today (2025)
- 179,678 people
- By 2030
- 189,208 · +5.3%
- By 2040
- 207,261 · +15.4%
- By 2050
- 223,064 · +24.1%
- By 2075
- 259,979 · +44.7%
- By 2100
- 275,395 · +53.3%
Race, ethnicity, and origin ACS 2023
- Neighborhood character
- Predominantly White (69%)
- Race & ethnicity
- White 69% Hispanic / Latino 19% Two or more races 11% Black 6% Asian 1%
- Hispanic origin (detail)
- Mexican 17%
- Common ancestry
- Lithuanian 2% Italian 2% Slovak 2%
- Foreign-born
- 5% · Canada
- Languages at home
- 88% English-only · Spanish 10% Other Indo-European 1%
Political lean MEDSL · Johnson
- 2024 margin
- Solid R (+51.4) · D 23.9% · R 75.3%
- 2008→2024 swing
- -3.9pp toward R · 2008: -47.5pp · 2024: -51.4pp
- All cycles
- 2024: R+51.4 2020: R+53.0 2016: R+58.3 2012: R+55.6 2008: R+47.5
Not yet ingested
- Civics
- —
Market trends
- HPI YoY
- ▼ -141.44%
- Current HPI
- 282.466
- Rent YoY
- ▲ 1.78%
- Metro
- Dallas-Fort Worth-Arlington, TX
- State GDP YoY
- ▲ 3.95%
- F500 in state
- 110
Industry mix (Fortune 500 HQ in TX)
| Industry | F500 HQs | Revenue |
|---|---|---|
| Energy | 16 | $1,198B |
|
||
| Technology | 5 | $198B |
|
||
| Engineering / Construction | 4 | $72B |
|
||
| Energy Services | 3 | $60B |
|
||
| Utilities | 3 | $41B |
|
||
| Healthcare | 2 | $330B |
|
||
Price history
+32.2% since first listed10 events — show timeline
- 2026-06-12 Listed $185,000 NTREIS
- 2012-10-15 Sold (Public Records) — Public Records
- 2012-10-15 Sold (MLS) — NTREIS
- 2012-09-18 Pending — NTREIS
- 2012-09-04 Contingent — NTREIS
- 2012-08-23 Price Changed $115,000 NTREIS
- 2012-08-15 Relisted — NTREIS
- 2012-07-26 Pending — NTREIS
- 2012-07-13 Contingent — NTREIS
- 2012-06-05 Listed $139,900 NTREIS
Property tax history
+2.5%/yrLatest (2025): $4,067 · +7.8% YoY. Source: county tax records.
Cash-flow waterfall
monthlySold comps — $/sqft
last 12 mo · ≤1 miLoading sold comps…