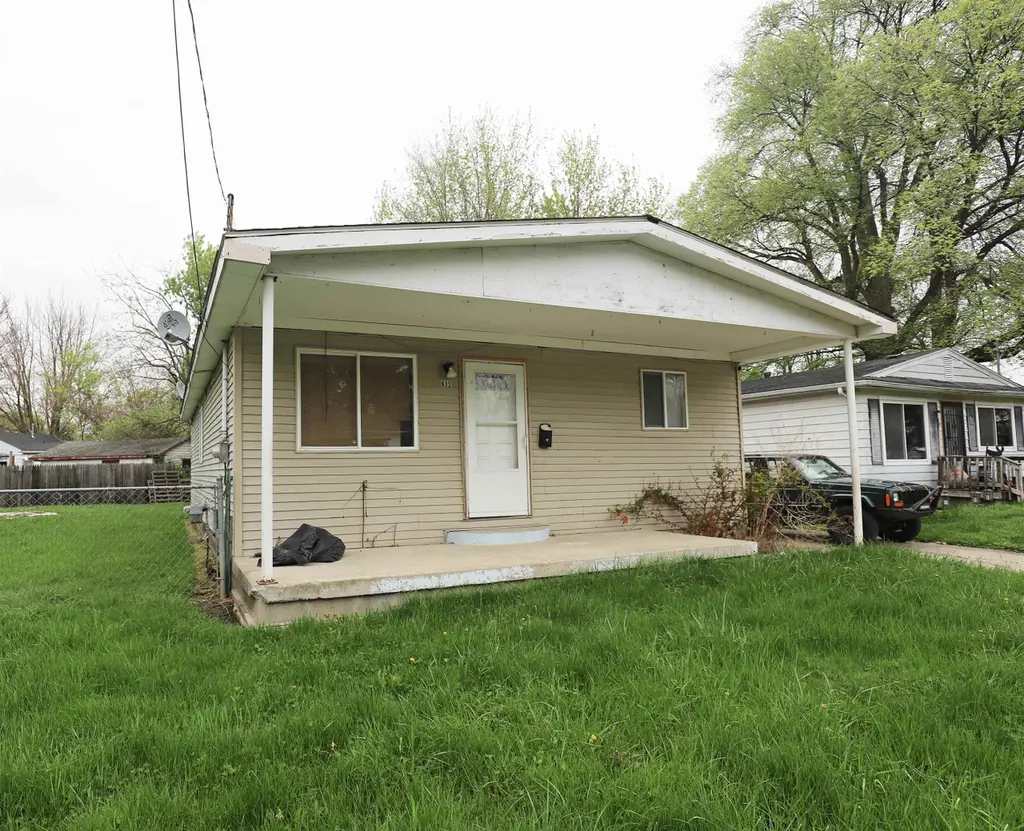
632 Monroe St · Flint, MI
Flood risk 1/10 · Minimal
- FEMA flood zone
- X (unshaded)
- Chance of flooding over 30 yrs
- 0.0%
- Est. flood insurance / yr
- $507 – $1,088
Fire risk 1/10 · Minimal
- Est. fire insurance / yr
- $784 – $1,456
Heat risk 2/10 · Minimal
- Hot days now (above 97°F)
- 7 days/yr
- Hot days in 30 yrs
- 15 days/yr
Wind risk 2/10 · Minimal
- Chance of severe wind over 30 yrs
- —
Air-quality risk 3/10 · Minor
- Unhealthy air days now
- 3 days/yr
- Unhealthy air days in 30 yrs
- 4 days/yr
Risk factors via First Street. Map © Google.
Why this score? — see what drove the C+ grade
The composite is a weighted blend of 9 inputs, each scored 0–100. Each bar is that input's sub-score; the figure is the points it added to the 100-point composite (weight × sub-score).
- Cash flow +30.0/30.0
- 1% rule +10.0/10.0
- DSCR +10.0/10.0
- Rent growth +5.0/5.0
- Livability +3.7/5.0
- Condition / age +2.5/5.0
- Schools +1.1/10.0
- ARV discount +0.0/15.0
- Appreciation +0.0/10.0
$45,000
🖨 Deal sheet 📄 Offer letter ✓ Due diligence
Listing remarks MLS
Great starter or investment ranch close to all amenities with spacious yard and charming covered front porch.
Key facts
- Spacious yard
- Covered front porch
- 4,792 sq ft lot
Tags
Property features AI
Finance
- Other: Located in the LaSalle Gardens subdivision; Cross street: North of Atherton / East of Fenton
- HOA & community: Homeowners association present
Exterior
- Utilities: Public water; Public sewer
- Home design: Single-family residence; One story
- Construction: Aluminum siding; Block foundation; Crawl space
- Exterior features: Front porch; Paved road access
Interior
- Kitchen: Refrigerator
- Bedrooms: 7 total rooms (bedroom count not specified)
- Bathrooms: 1 full bathroom
- Heating & cooling: Forced air heating (natural gas); No central cooling
- Interior features: High speed internet
- Laundry & utility: Washer; Dryer; Gas water heater
Neighborhood map
What this means for you Summary
Snapshot
- This is a 3-bed/1.0-bath single-family listed at $45k.
Deal economics
- At list price, monthly cash flow is $433 ($5k/yr) — positive.
- The deal already cash-flows at list — no discount required.
- Meets the 1% rule at list price ($963 rent vs $45k).
- Cap rate 17.8% vs local median 11.5% in Flint — top-decile yield for the area; either an underpriced asset or a hidden risk that comps aren't pricing in. Stress-test before assuming the spread holds.
Location & tenants
- Location reads 74/100 on livability (#196 in MI, #4,946 nationally) — a middle-class / working-renter tenant base. Strengths: commute A+, cost of living A+, housing A+; Watch: schools F, crime F, employment F.
- Flint School District (urban): math 7% / reading 13% proficiency, ranked #714 of 760 in MI (top 94%) — low school quality limits family demand, transient renter base, plan for 1-2y turnover; 83% free/reduced lunch — lower-income household profile, screen leases tightly.
- Market conditions: Rents rising fast (+12.3%/yr); 135 active listings in the ZIP; 6 comparable units currently listed for rent nearby; rentals leasing fast (median 13d on market — plan ~1-2 weeks tenant-placement turnaround); lower-income renter base — watch delinquency; 419 units permitted in Genesee County in 2024 (68 in 5+ unit buildings).
Forward outlook
- Local home prices are declining (-3.0%/yr); year-one equity from $311 of loan paydown is wiped out by about $1k of value loss. Plan a longer hold.
- Genesee County population projected at -27% by 2050 — secular population decline; favor cash flow + early exit over multi-decade hold.
- At projected returns (-3.0% appreciation + 8.0% rent growth), your $13k cash investment doubles in ~3 years — after that, you're playing with house money.
Negotiation context
- Only 9 days on market — expect competitive offers; lowballing is unlikely to land.
- 17 sale attempts since 28y ago with the ask held roughly flat each time — persistent listings suggest the price (not the market) is what's stuck; bring a comps-based counter.
- Current owner paid $12k; list at $45k implies a 291% gain — meaningful room to come down on a strong offer.
Questions for the listing agent
- Built in 1968 — when were the roof, HVAC, electrical panel, plumbing, and water heater last replaced?
- Is there a deadline driving the sale (1031 exchange, divorce, estate, relocation)? That informs how much negotiation room exists.
- Schools are F-rated, which usually means shorter tenancies and higher turnover. Who's the typical renter profile here, and what's been the actual vacancy rate?
- Crime grade is F in this area — have there been break-ins, vandalism, or insurance claims at this property in the last 3 years? What carrier currently insures it and at what premium?
- What's the average days-on-market for RENTAL listings here right now (not sales)? A rising rental-DOM trend means longer vacancies and softer asking-rent achievability than the comps imply.
- What's the recent tenant-quality profile in this submarket — average credit score on applications, eviction rate, late-payment / NSF rate, and stable-employment percentage? A property-management company in the area should have these aggregated.
- How much new for-sale + rental construction is in the pipeline within 1–3 miles? Heavy new supply typically softens prices + rents 12–24 months out; constrained supply supports both.
Investment metrics
- 1% rule
- 2.14% ✓
- Cap rate
- 17.84%
- Cash-on-cash
- 41.24%
- DSCR
- 2.83
- GRM
- 3.9
CMA / ARV
- ARV (on-the-fly)
- $32,457
- Comps found
- 12
Show comp detail 12 sales within ~0.75 mi
| Address | Dist | Beds/Ba | Sqft | Sold | Price | $/sf | Match |
|---|---|---|---|---|---|---|---|
| 2041 Warner Ave | 0.61mi | 3/1.0 | 1,001 (-4%) | 0mo | $24,000 | $24 | 64 |
| 2314 S Grand Traverse St | 0.09mi | 2/1.5 (-1) | 922 (-12%) | 7mo | $30,000 | $33 | 63 |
| 905 Victoria Ave | 0.60mi | 3/1.0 | 1,060 (+1%) | 9mo | $19,000 | $18 | 62 |
| 401 Monroe St | 0.20mi | 3/1.0 | 912 (-13%) | 13mo | $10,000 | $11 | 58 |
| 2021 Brooks St | 0.53mi | 2/1.0 (-1) | 987 (-6%) | 3mo | $55,000 | $56 | 58 |
| 609 Lippincott Blvd | 0.66mi | 3/1.0 | 1,080 (+3%) | 9mo | $40,000 | $37 | 56 |
| 825 Vermilya Ave | 0.69mi | 4/1.0 (+1) | 1,020 (-3%) | 3mo | $30,000 | $29 | 56 |
| 620 Simcoe Ave | 0.43mi | 4/1.5 (+1) | 1,000 (-4%) | 16mo | $42,000 | $42 | 52 |
| 142 E Belvidere Ave | 0.63mi | 3/1.0 | 1,000 (-4%) | 15mo | $32,690 | $33 | 51 |
| 2002 Ferris Ave | 0.68mi | 4/1.0 (+1) | 1,087 (+4%) | 8mo | $29,000 | $27 | 50 |
| 836 Victoria Ave | 0.54mi | 3/1.5 | 928 (-11%) | 12mo | $29,000 | $31 | 44 |
| 3405 Brunswick Ave | 0.71mi | 3/1.0 | 963 (-8%) | 14mo | $13,000 | $13 | 42 |
Match score weights: distance 35% · size 25% · config 20% · recency 20%. Top-matched comps best support the ARV.
Projected returns pro-forma
-3.0% appreciation · 8.0% rent growth · sell at horizon
- IRR
- 43.5%
- Equity multiple
- 3.02×
- Total profit
- $25,401
- Equity at exit
- $6,710
- IRR
- 51.8%
- Equity multiple
- 7.42×
- Total profit
- $80,902
- Equity at exit
- $3,891
Cash invested: $12,600 (down + closing). Projections, not guarantees.
Landlord ↔ Tenant lean methodology
- Overall (STATE)
- 62 Landlord-Friendly
- State Michigan
- 62 Landlord-Friendly · EVEN
- County
- — inherits STATE
- City
- — inherits STATE
ZIP-level market 48503
- Home prices YoY
- -27.7%
- Rents YoY
- 12.3%
- Active inventory
- 135
- Price-to-rent
- 3.9×
Monthly cashflow live
- Estimated rent
- $963 high interval (Pro) →
- Mortgage (P&I)
- −$236
- Tax from tax record
- −$73 /mo · $881/yr
- Insurance
- −$19
- HOA
- −$0
- Vacancy / Maint / Mgmt
- −$202
- Net cashflow
- $433
Break-even live
UW: 25.0% down · 7.5% · 30yr · 1.5% tax · 5.0% vac · 8.0% maint · 8.0% mgmt
Financing live
Cash to close
- Down payment
- $11,250
- Closing costs
- $1,350
- Reserves months
- —
- Total cash needed
- —
Loan-product check · same deal, 3 products live
Conventional
25% down · 7.5% · 30yr
- Down + closing
- —
- Monthly P&I
- —
- Monthly cashflow
- —
- DSCR
- —
- Eligible?
- —
Personal DTI + credit; lowest rate.
DSCR
20% down · 8.5% · 30yr
- Down + closing
- —
- Monthly P&I
- —
- Monthly cashflow
- —
- DSCR
- —
- Eligible?
- —
No personal income docs; deal must DSCR.
Hard money
10% down · 12.0% · 12mo
- Down + closing
- —
- Monthly P&I
- —
- Monthly cashflow
- —
- DSCR
- —
- Eligible?
- —
Short-term bridge; refi at stabilization.
Rent comps 6 comps
| Address | Beds | Baths | Sqft | Rent | $/sqft | DOM | Units | Dist |
|---|---|---|---|---|---|---|---|---|
| 410 Lippincott Blvd Flint, MI | 2.0 | 1.0 | 800 | $695 | $0.87 | 13d | 1 | 0.58mi |
| 912 Waldman Ave Flint, MI | 3.0 | 2.0 | 1223 | $675 | $0.55 | 13d | 1 | 0.85mi |
| 1426 Pettibone Ave Flint, MI | 2.0 | 1.0 | 750 | $900 | $1.20 | 20d | 1 | 1.07mi |
| 813 Alvord Ave Flint, MI | 2.0 | 1.0 | 724 | $850 | $1.17 | 13d | 1 | 1.08mi |
| 4428 Pengelly Rd Flint, MI | 4.0 | 2.0 | 1275 | $900 | $0.71 | 43d | 1 | 1.48mi |
| 4400 Kings Ln Burton, MI | 1.0–2.0 | 1.0–2.0 | 666 | $960 | $1.44 | 13d | 19 | 1.50mi |
Listing history 40 events
-
2026-05-08status Pending
Show marketing remark (109 chars)
Great starter or investment ranch close to all amenities with spacious yard and charming covered front porch.
-
2026-05-08status Pending 109-char remark
Show marketing remark (109 chars)
Great starter or investment ranch close to all amenities with spacious yard and charming covered front porch.
-
2026-04-28$45,000 Active
Show marketing remark (109 chars)
Great starter or investment ranch close to all amenities with spacious yard and charming covered front porch.
-
2026-04-28$45,000 Active 109-char remark
Show marketing remark (109 chars)
Great starter or investment ranch close to all amenities with spacious yard and charming covered front porch.
-
2019-01-18soldstatus $11,500 Sold 146-char remark
Show marketing remark (146 chars)
Wow! This is priced to sell quickly! Great starter home for the first time home buyer or investor building the portfolio. Seller Highly Motivated!
-
2019-01-18soldstatus $11,500 Closed
Show marketing remark (146 chars)
Wow! This is priced to sell quickly! Great starter home for the first time home buyer or investor building the portfolio. Seller Highly Motivated!
-
2019-01-11status Pending
Show marketing remark (146 chars)
Wow! This is priced to sell quickly! Great starter home for the first time home buyer or investor building the portfolio. Seller Highly Motivated!
-
2019-01-11status Pending 146-char remark
Show marketing remark (146 chars)
Wow! This is priced to sell quickly! Great starter home for the first time home buyer or investor building the portfolio. Seller Highly Motivated!
-
2019-01-07$11,900 Active 146-char remark
Show marketing remark (146 chars)
Wow! This is priced to sell quickly! Great starter home for the first time home buyer or investor building the portfolio. Seller Highly Motivated!
-
2019-01-07$11,900 Active
Show marketing remark (146 chars)
Wow! This is priced to sell quickly! Great starter home for the first time home buyer or investor building the portfolio. Seller Highly Motivated!
-
2014-08-14historical
-
2014-08-12historical
-
2014-08-11historical
-
2014-07-08$13,900
-
2014-02-14$13,900
-
2014-02-14$13,900
-
2011-03-22soldstatus $16,500
-
2011-03-22soldstatus $16,500
-
2011-03-22soldstatus $16,500
-
2011-03-22soldstatus $16,500
-
2011-03-15$16,500
-
2011-03-15$16,500
-
2011-03-07historical
-
2010-12-06historical
-
2010-09-08$16,500
-
2010-09-08$16,500
-
2010-04-01soldstatus $6,934
-
2009-01-05historical
-
2009-01-05historical
-
2008-09-23$24,900
-
2008-09-23$24,900
-
2006-05-10soldstatus $27,000
-
2006-01-13historical
-
2005-07-14$47,900
-
2005-07-14$47,900
-
1998-05-01soldstatus $27,000
-
1998-05-01soldstatus $27,000
-
1998-04-22historical
-
1998-04-21$29,900
-
1998-04-21$29,900
ⓘ Source: listings_history table (triggers on properties + properties_extension) + one-shot
backfill from property_details.listing_events for pre-trigger history.
Tax reassessment forecast MI · Partial reset (capped growth)
- Current annual tax
- $881 · $73/mo
- Projected year-2 tax
- $881 · $73/mo
- Expected delta
- $0/yr ($0/mo · 0.0%)
ⓘ Screening estimate from a state-policy table — verify with the county assessor before closing.
Climate risk First Street
- Flood 1/10 Low FEMA zone X (unshaded) · 0% chance over 30 yrs
- Wildfire 1/10 Low
- Heat 2/10 Low 7 d/yr ≥97°F today · 15 d/yr by 30 yrs out
- Wind 2/10 Low
- Air quality 3/10 Moderate 3 unhealthy d/yr today · 4 by 30 yrs out
Nearby sold comps map
Loading sold comps map…
Walkable amenities ~0.75 mi
Loading nearby amenities…
Taxation est. · year 1
- Rental income
- $11,561
- − Mortgage interest
- −$2,521
- − Property taxes
- −$881
- − Insurance
- −$225
- − Repairs & maintenance
- −$925
- − Management
- −$925
- − Depreciation
- −$1,309
- Taxable income
- $4,776
- Est. tax owed @ 24.0%
- −$1,146
- After-tax cash flow
- $4,049/yr
For passive investors: Depreciation is non-cash, so a rental often shows a tax loss while cash-flowing — sheltering income. Rental losses are passive: they offset passive income freely, and up to $25,000/yr can offset ordinary (W-2) income if you actively participate and your MAGI is under $100k (phasing out to $0 by $150k); unused losses carry forward. On sale, claimed depreciation is recaptured at up to 25%, and gains may owe capital-gains tax (a 1031 exchange can defer both). Figures are a year-1 estimate at your 24.0% rate — not tax advice; consult a CPA.
Schools (NCES district)
- District
- Flint School District
- NCES district ID
- 2614520
- Math proficiency
- 7% ▬ 0.00%
- Reading proficiency
- 13% ▲ 3.00%
- Median HH income
- $25,954
- Composite
- 10.97/100
- National rank
- #14642
- State rank
- #714 of 760 in MI
Livability — Flint
- Score
- 74/100
- State rank
- #196
- US rank
- #4946
Category grades
Schools grade is shown separately in the Schools card above.
Census & demographics
- Census place
- Flint, MI
- County
- Genesee County · 221,329 people
- City population
- 93,814
- Metro
- Flint, MI
- Population (ZIP)
- 22,347
- Household income
- $44,411
- Rent vs Own
- Severe rent burden
- 1293.0
Population outlook (Genesee County) Hauer SSP2
- Today (2025)
- 381,312 people
- By 2030
- 362,731 · -4.9%
- By 2040
- 321,550 · -15.7%
- By 2050
- 279,212 · -26.8%
- By 2075
- 193,336 · -49.3%
- By 2100
- 128,118 · -66.4%
Race, ethnicity, and origin ACS 2023
- Neighborhood character
- Diverse neighborhood (Simpson 0.56)
- Race & ethnicity
- Black 55% White 36% Two or more races 4% Hispanic / Latino 3%
- Common ancestry
- Romanian 2% Lithuanian 2% Slovak 1%
- Foreign-born
- 5% · China, Canada
- Languages at home
- 93% English-only · Arabic 4% Spanish 1% Chinese 1%
Political lean MEDSL · Genesee
- 2024 margin
- Toss-up / Even · D 51.4% · R 47.2% · Other 1.4%
- 2008→2024 swing
- -28.3pp toward R · 2008: 32.5pp · 2024: 4.2pp
- All cycles
- 2024: D+4.2 2020: D+9.3 2016: D+9.5 2012: D+28.2 2008: D+32.5
Not yet ingested
- Civics
- —
Market trends
- HPI YoY
- ▼ -49.84%
- Current HPI
- 130.1152
- Rent YoY
- ▲ 12.35%
- Metro
- Flint, MI
- State GDP YoY
- ▲ 1.37%
- F500 in state
- 28
Industry mix (Fortune 500 HQ in MI)
| Industry | F500 HQs | Revenue |
|---|---|---|
| Automotive Parts | 3 | $48B |
|
||
| Automotive | 2 | $372B |
|
||
| Chemicals | 1 | $45B |
|
||
| Automotive Retail | 1 | $29B |
|
||
| Healthcare / Medical Devices | 1 | $23B |
|
||
| Automotive Technology | 1 | $20B |
|
||
Price history
+50.5% since first listed40 events — show timeline
- 2026-05-08 Pending — REALCOMP
- 2026-05-08 Pending — MiRealSource-MiMLS
- 2026-04-28 Listed $45,000 MiRealSource-MiMLS
- 2026-04-28 Listed $45,000 REALCOMP
- 2019-01-18 Sold (MLS) $11,500 MiRealSource-MiMLS
- 2019-01-18 Sold (MLS) $11,500 REALCOMP
- 2019-01-11 Pending — MiRealSource-MiMLS
- 2019-01-11 Pending — REALCOMP
- 2019-01-07 Listed $11,900 MiRealSource-MiMLS
- 2019-01-07 Listed $11,900 REALCOMP
- 2014-08-14 Listing Removed — REALCOMP
- 2014-08-12 Listing Removed — MiRealSource-MiMLS
- 2014-08-11 Listing Removed — REALCOMP
- 2014-07-08 Listed $13,900 REALCOMP
- 2014-02-14 Listed $13,900 REALCOMP
- 2014-02-14 Listed $13,900 MiRealSource-MiMLS
- 2011-03-22 Sold (MLS) $16,500 REALCOMP
- 2011-03-22 Sold (MLS) $16,500 REALCOMP
- 2011-03-22 Sold (MLS) $16,500 MiRealSource-MiMLS
- 2011-03-22 Sold (MLS) $16,500 MiRealSource-MiMLS
- 2011-03-15 Listed $16,500 REALCOMP
- 2011-03-15 Listed $16,500 MiRealSource-MiMLS
- 2011-03-07 Listing Removed — MiRealSource-MiMLS
- 2010-12-06 Listing Removed — REALCOMP
- 2010-09-08 Listed $16,500 REALCOMP
- 2010-09-08 Listed $16,500 MiRealSource-MiMLS
- 2010-04-01 Sold (Public Records) $6,934 Public Records
- 2009-01-05 Listing Removed — REALCOMP
- 2009-01-05 Listing Removed — MiRealSource-MiMLS
- 2008-09-23 Listed $24,900 REALCOMP
- 2008-09-23 Listed $24,900 MiRealSource-MiMLS
- 2006-05-10 Sold (Public Records) $27,000 Public Records
- 2006-01-13 Listing Removed — MiRealSource-MiMLS
- 2005-07-14 Listed $47,900 MiRealSource-MiMLS
- 2005-07-14 Listed $47,900 REALCOMP
- 1998-05-01 Sold (MLS) $27,000 MiRealSource-MiMLS
- 1998-05-01 Sold (MLS) $27,000 REALCOMP
- 1998-04-22 Listing Removed — MiRealSource-MiMLS
- 1998-04-21 Listed $29,900 MiRealSource-MiMLS
- 1998-04-21 Listed $29,900 REALCOMP
Property tax history
+3.1%/yrLatest (2025): $881 · +1.6% YoY. Source: county tax records.
Cash-flow waterfall
monthlySold comps — $/sqft
last 12 mo · ≤1 miLoading sold comps…