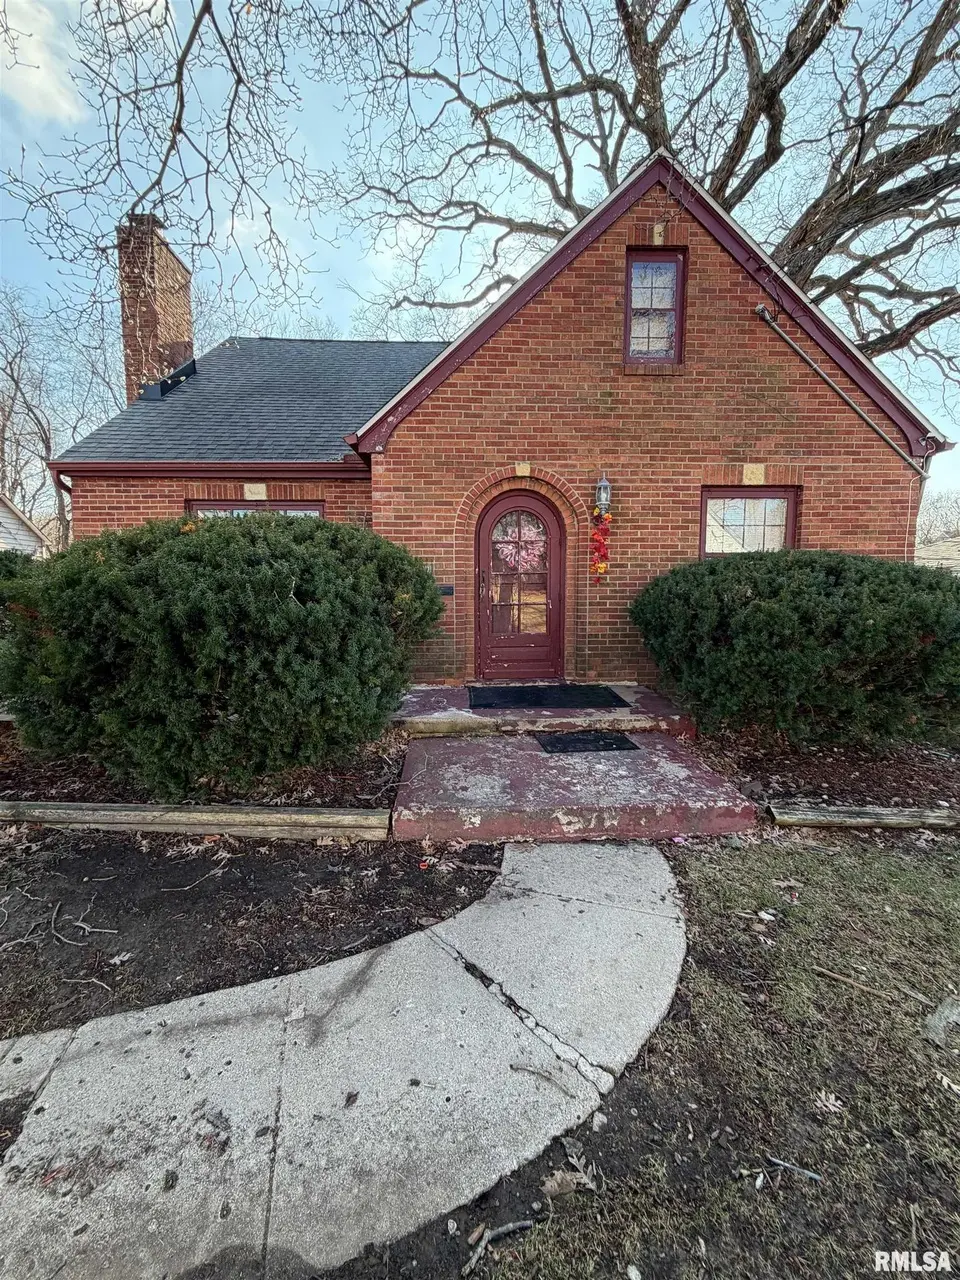
1018 Groveland Ave · Peoria, IL
Flood risk 1/10 · Minimal
- FEMA flood zone
- X
- Chance of flooding over 30 yrs
- 0.0%
- Est. flood insurance / yr
- $473 – $860
Fire risk 1/10 · Minimal
- Est. fire insurance / yr
- $804 – $1,492
Heat risk 3/10 · Minor
- Hot days now (above 105°F)
- 7 days/yr
- Hot days in 30 yrs
- 18 days/yr
Wind risk 2/10 · Minimal
- Chance of severe wind over 30 yrs
- 1.0%
Air-quality risk 3/10 · Minor
- Unhealthy air days now
- 1 days/yr
- Unhealthy air days in 30 yrs
- 3 days/yr
Risk factors via First Street. Map © Google.
Why this score? — see what drove the D+ grade
The composite is a weighted blend of 9 inputs, each scored 0–100. Each bar is that input's sub-score; the figure is the points it added to the 100-point composite (weight × sub-score).
- Cash flow +22.5/30.0
- DSCR +7.2/10.0
- 1% rule +6.0/10.0
- Livability +3.7/5.0
- Rent growth +3.1/5.0
- Condition / age +2.5/5.0
- Schools +1.1/10.0
- ARV discount +0.0/15.0
- Appreciation +0.0/10.0
$119,900
🖨 Deal sheet 📄 Offer letter ✓ Due diligence
Listing remarks MLS
LOTS OF NATURAL WOODWORK IN THIS LARGE 4/5 BEDROOM BRICK HOME. NEWER WATER HEATER, ROOF, FURANCE, C/A. HOME RENTS ON SECTION 8 FOR 1,500.00 A MONTH. MUST WALK THRU OFFICE/DEN ON UPPER LEVEL TO GET TO THE BATHROOM, IT IS BETWEEN BOTH BEDROOMS.
Key facts
- 6,350 sq ft lot
- Garage
- Built 1940
Neighborhood map
What this means for you Summary
Snapshot
- This is a 3-bed/1.0-bath single-family listed at $120k.
Deal economics
- At list price, monthly cash flow is $203 ($2k/yr) — positive.
- The deal already cash-flows at list — no discount required.
- Meets the 1% rule at list price ($1k rent vs $120k).
- Recommended offer: $106k (12.0% below list) — sets the bar for market timing.
- Cap rate 8.3% vs local median 5.6% in Peoria — top-decile yield for the area; either an underpriced asset or a hidden risk that comps aren't pricing in. Stress-test before assuming the spread holds.
Location & tenants
- Location reads 73/100 on livability (#270 in IL) — a middle-class / working-renter tenant base. Strengths: commute A+, cost of living A+, housing A+; Watch: employment D+, schools F, crime F.
- Peoria SD 150 (urban): math 11% / reading 14% proficiency, ranked #554 of 620 in IL (top 89%) — low school quality limits family demand, transient renter base, plan for 1-2y turnover; 70% free/reduced lunch — lower-income household profile, screen leases tightly.
- Market conditions: Rents rising (+2.3%/yr); 180 active listings in the ZIP; 10 comparable units currently listed for rent nearby; rentals at typical pace (median 21d on market — plan ~3-4 weeks tenant-placement turnaround); 40% of comp listings sitting > 30 days — soft ceiling on asking rent; 73 units permitted in Peoria County in 2024 (0 in 5+ unit buildings).
- This rent runs 30% of the median local income ($52k/yr) — at the standard rent-burdened threshold; future hikes will face affordability resistance.
Forward outlook
- Local home prices are declining (-3.0%/yr); year-one equity from $829 of loan paydown is wiped out by about $4k of value loss. Plan a longer hold.
- Peoria County population projected at -11% by 2050 — secular population decline; favor cash flow + early exit over multi-decade hold.
Negotiation context
- It's been on market 155 days — a 12% lower offer ($106k) is reasonable based on typical stale-listing flexibility.
Risks & watch-outs
- Watch-outs: built in 1940 — expect roof / HVAC / electrical / plumbing capex.
Questions for the listing agent
- It's been on market 155 days. Have you received any prior offers? Is the seller open to a 12% concession, seller financing, or rate buy-down credit?
- Built in 1940 — when were the roof, HVAC, electrical panel, plumbing, and water heater last replaced?
- Why hasn't it sold? Are there any deal-killer items the seller is aware of (foundation, flood, title, zoning, code violations)?
- Is there a deadline driving the sale (1031 exchange, divorce, estate, relocation)? That informs how much negotiation room exists.
- Schools are F-rated, which usually means shorter tenancies and higher turnover. Who's the typical renter profile here, and what's been the actual vacancy rate?
- Crime grade is F in this area — have there been break-ins, vandalism, or insurance claims at this property in the last 3 years? What carrier currently insures it and at what premium?
- The area grade is low — what's the realistic commute time and amenity access for the typical tenant pool here? Any planned neighborhood developments (good or bad) we should know about?
- What's the average days-on-market for RENTAL listings here right now (not sales)? A rising rental-DOM trend means longer vacancies and softer asking-rent achievability than the comps imply.
- What's the recent tenant-quality profile in this submarket — average credit score on applications, eviction rate, late-payment / NSF rate, and stable-employment percentage? A property-management company in the area should have these aggregated.
- How much new for-sale + rental construction is in the pipeline within 1–3 miles? Heavy new supply typically softens prices + rents 12–24 months out; constrained supply supports both.
Investment metrics
- 1% rule
- 1.10% ✓
- Cap rate
- 8.32%
- Cash-on-cash
- 7.24%
- DSCR
- 1.32
- GRM
- 7.6
CMA / ARV
- ARV (median comp)
- $98,099
- List price
- $119,900
- Delta
- 22.22%
- Verdict
- OVERPRICED
- Comps
- 20 within 1.0 mi
Show comp detail 12 sales within ~0.75 mi
| Address | Dist | Beds/Ba | Sqft | Sold | Price | $/sf | Match |
|---|---|---|---|---|---|---|---|
| 803 W Meadows Pl | 0.26mi | 4/1.5 (+1) | 1,924 (-3%) | 1mo | $165,000 | $86 | 75 |
| 1213 W Armstrong Ave | 0.46mi | 3/1.5 | 2,064 (+4%) | 3mo | $64,000 | $31 | 67 |
| 2304 N Ellis Ave | 0.50mi | 3/1.0 | 1,907 (-4%) | 4mo | $76,000 | $40 | 67 |
| 917 W Brons Ave | 0.23mi | 3/2.0 | 2,240 (+13%) | 1mo | $22,000 | $10 | 62 |
| 1321 N Ellis St | 0.62mi | 3/2.5 | 1,870 (-6%) | 0mo | $143,000 | $76 | 56 |
| 2719 N University St | 0.72mi | 3/1.5 | 1,893 (-4%) | 3mo | $125,000 | $66 | 54 |
| 1410 N Douglas St | 0.50mi | 2/2.0 (-1) | 1,845 (-7%) | 5mo | $38,500 | $21 | 52 |
| 1404 N Amber Pl | 0.68mi | 3/1.5 | 1,792 (-10%) | 1mo | $175,000 | $98 | 50 |
| 1309 W Columbia Ter | 0.58mi | 4/3.0 (+1) | 2,128 (+7%) | 1mo | $183,500 | $86 | 47 |
| 1027 N University St | 0.74mi | 4/2.5 (+1) | 2,070 (+4%) | 4mo | $235,000 | $114 | 44 |
| 1112 W Columbia Ter | 0.57mi | 4/1.0 (+1) | 1,726 (-13%) | 5mo | $114,000 | $66 | 43 |
| 720 W Loucks Ave | 0.67mi | 4/1.5 (+1) | 1,711 (-14%) | 4mo | $119,000 | $70 | 36 |
Match score weights: distance 35% · size 25% · config 20% · recency 20%. Top-matched comps best support the ARV.
Projected returns pro-forma
-3.0% appreciation · 2.3% rent growth · sell at horizon
- IRR
- -6.0%
- Equity multiple
- 0.78×
- Total profit
- $-7,419
- Equity at exit
- $17,877
- IRR
- 2.8%
- Equity multiple
- 1.19×
- Total profit
- $6,535
- Equity at exit
- $10,367
Cash invested: $33,572 (down + closing). Projections, not guarantees.
Landlord ↔ Tenant lean methodology
- Overall (STATE)
- 43 Moderately Tenant-Leaning
- State Illinois
- 43 Moderately Tenant-Leaning · D+7
- County
- — inherits STATE
- City
- — inherits STATE
ZIP-level market 61604
- Home prices YoY
- -24.6%
- Rents YoY
- 2.3%
- Active inventory
- 180
- Price-to-rent
- 7.6×
Monthly cashflow live
- Estimated rent
- $1,318 high interval (Pro) →
- Mortgage (P&I)
- −$629
- Tax from tax record
- −$160 /mo · $1,918/yr
- Insurance
- −$50
- HOA
- −$0
- Vacancy / Maint / Mgmt
- −$277
- Net cashflow
- $203
Break-even live
UW: 25.0% down · 7.5% · 30yr · 1.5% tax · 5.0% vac · 8.0% maint · 8.0% mgmt
Financing live
Cash to close
- Down payment
- $29,975
- Closing costs
- $3,597
- Reserves months
- —
- Total cash needed
- —
Loan-product check · same deal, 3 products live
Conventional
25% down · 7.5% · 30yr
- Down + closing
- —
- Monthly P&I
- —
- Monthly cashflow
- —
- DSCR
- —
- Eligible?
- —
Personal DTI + credit; lowest rate.
DSCR
20% down · 8.5% · 30yr
- Down + closing
- —
- Monthly P&I
- —
- Monthly cashflow
- —
- DSCR
- —
- Eligible?
- —
No personal income docs; deal must DSCR.
Hard money
10% down · 12.0% · 12mo
- Down + closing
- —
- Monthly P&I
- —
- Monthly cashflow
- —
- DSCR
- —
- Eligible?
- —
Short-term bridge; refi at stabilization.
Rent comps 10 comps
| Address | Beds | Baths | Sqft | Rent | $/sqft | DOM | Units | Dist |
|---|---|---|---|---|---|---|---|---|
| 913 W McClure Ave Peoria, IL | 3.0 | 1.0 | 1400 | $1,200 | $0.86 | 20d | 1 | 0.50mi |
| 501 W Columbia Ter Unit 3 Peoria, IL | 3.0 | 1.0 | 1500 | $1,400 | $0.93 | 43d | 1 | 0.71mi |
| 1413 W Gilbert Ave Peoria, IL | 2.0 | 2.0 | 1428 | $1,500 | $1.05 | 13d | 1 | 0.84mi |
| 2210 Knoxville Ave #2212 Peoria, IL | 2.0 | 1.0 | 1284 | $950 | $0.74 | 43d | 1 | 0.90mi |
| 1019 N Farmington Rd Unit 1017 Peoria, IL | 3.0 | 1.0 | 1304 | $1,600 | $1.23 | 43d | 1 | 0.93mi |
| 1806 N Peoria Ave Peoria, IL | 4.0 | 1.5 | 1668 | $894 | $0.54 | 13d | 1 | 0.99mi |
| 818 W Moss Ave Peoria, IL | 2.0 | 2.0 | 1580 | $1,800 | $1.14 | 13d | 1 | 1.05mi |
| 308 E Archer Ave Peoria, IL | 3.0 | 1.0 | 1444 | $950 | $0.66 | 13d | 1 | 1.08mi |
| 2523 W Nebraska Ave Peoria, IL | 3.0 | 2.0 | 1600 | $1,450 | $0.91 | 20d | 1 | 1.24mi |
| 1816 W Callender Ave Peoria, IL | 3.0 | 2.0 | 1628 | $1,650 | $1.01 | 43d | 1 | 1.37mi |
Listing history 18 events
-
2026-06-19days on market $119,900 Active 155 DOM
-
2026-06-18days on market $119,900 Active 154 DOM
-
2026-06-17days on market $119,900 Active 153 DOM
-
2026-06-16days on market $119,900 Active 152 DOM
-
2026-06-15days on market $119,900 Active 151 DOM
-
2026-06-14days on market $119,900 Active 149 DOM
-
2026-06-13days on market $119,900 Active 148 DOM
-
2026-06-10pricedays on market $119,900 Active 146 DOM
-
2026-06-09days on market $129,900 Active 145 DOM
-
2026-06-08days on market $129,900 Active 144 DOM
-
2026-06-07days on market $129,900 Active 143 DOM
-
2026-06-03days on market $129,900 Active 139 DOM
-
2026-06-02days on market $129,900 Active 138 DOM
-
2026-06-01days on market $129,900 Active 137 DOM
-
2026-05-31days on market $129,900 Active 136 DOM
-
2026-05-30days on market $129,900 Active 135 DOM
-
2026-05-08price $129,900 243-char remark
Show marketing remark (243 chars)
LOTS OF NATURAL WOODWORK IN THIS LARGE 4/5 BEDROOM BRICK HOME. NEWER WATER HEATER, ROOF, FURANCE, C/A. HOME RENTS ON SECTION 8 FOR 1,500.00 A MONTH. MUST WALK THRU OFFICE/DEN ON UPPER LEVEL TO GET TO THE BATHROOM, IT IS BETWEEN BOTH BEDROOMS.
-
2026-01-14$139,900 Active 243-char remark
Show marketing remark (243 chars)
LOTS OF NATURAL WOODWORK IN THIS LARGE 4/5 BEDROOM BRICK HOME. NEWER WATER HEATER, ROOF, FURANCE, C/A. HOME RENTS ON SECTION 8 FOR 1,500.00 A MONTH. MUST WALK THRU OFFICE/DEN ON UPPER LEVEL TO GET TO THE BATHROOM, IT IS BETWEEN BOTH BEDROOMS.
ⓘ Source: listings_history table (triggers on properties + properties_extension) + one-shot
backfill from property_details.listing_events for pre-trigger history.
Tax reassessment forecast IL · Partial reset (capped growth)
- Current annual tax
- $1,918 · $160/mo
- Projected year-2 tax
- $2,320 · $193/mo
- Expected delta
- +$402/yr (+$34/mo · 21.0%)
ⓘ Screening estimate from a state-policy table — verify with the county assessor before closing.
Climate risk First Street
- Flood 1/10 Low FEMA zone X · 0% chance over 30 yrs
- Wildfire 1/10 Low
- Heat 3/10 Moderate 7 d/yr ≥105°F today · 18 d/yr by 30 yrs out
- Wind 2/10 Low 100% chance of damaging wind over 30 yrs
- Air quality 3/10 Moderate 1 unhealthy d/yr today · 3 by 30 yrs out
Nearby sold comps map
Loading sold comps map…
Walkable amenities ~0.75 mi
Loading nearby amenities…
Taxation est. · year 1
- Rental income
- $15,815
- − Mortgage interest
- −$6,716
- − Property taxes
- −$1,918
- − Insurance
- −$600
- − Repairs & maintenance
- −$1,265
- − Management
- −$1,265
- − Depreciation
- −$3,488
- Taxable income
- $563
- Est. tax owed @ 24.0%
- −$135
- After-tax cash flow
- $2,296/yr
For passive investors: Depreciation is non-cash, so a rental often shows a tax loss while cash-flowing — sheltering income. Rental losses are passive: they offset passive income freely, and up to $25,000/yr can offset ordinary (W-2) income if you actively participate and your MAGI is under $100k (phasing out to $0 by $150k); unused losses carry forward. On sale, claimed depreciation is recaptured at up to 25%, and gains may owe capital-gains tax (a 1031 exchange can defer both). Figures are a year-1 estimate at your 24.0% rate — not tax advice; consult a CPA.
Schools (NCES district)
- District
- Peoria SD 150
- NCES district ID
- 1731230
- Math proficiency
- 11% ▼ -5.00%
- Reading proficiency
- 14% ▼ -4.00%
- Median HH income
- $41,951
- Composite
- 10.92/100
- National rank
- #9751
- State rank
- #554 of 620 in IL
Livability — Peoria
- Score
- 73/100
- State rank
- #270
- US rank
- #5096
Category grades
Schools grade is shown separately in the Schools card above.
Census & demographics
- Census place
- Peoria, IL
- County
- Peoria County · 120,495 people
- City population
- 114,670
- Metro
- Peoria, IL
- Population (ZIP)
- 28,313
- Household income
- $52,414
- Rent vs Own
- Severe rent burden
- 815.0
Population outlook (Peoria County) Hauer SSP2
- Today (2025)
- 183,007 people
- By 2030
- 179,643 · -1.8%
- By 2040
- 171,782 · -6.1%
- By 2050
- 163,508 · -10.7%
- By 2075
- 140,178 · -23.4%
- By 2100
- 114,493 · -37.4%
Race, ethnicity, and origin ACS 2023
- Neighborhood character
- Diverse neighborhood (Simpson 0.61)
- Race & ethnicity
- White 55% Black 29% Two or more races 10% Hispanic / Latino 7% Asian 2%
- Hispanic origin (detail)
- Mexican 5%
- Common ancestry
- Italian 2% Slovak 1% Iranian 1%
- Foreign-born
- 6% · Canada, China
- Languages at home
- 92% English-only · Spanish 4% Chinese 1% French/Haitian/Cajun 1%
Political lean MEDSL · Peoria
- 2024 margin
- Toss-up / Even · D 51.5% · R 46.9% · Other 1.6%
- 2008→2024 swing
- -9.2pp toward R · 2008: 13.9pp · 2024: 4.7pp
- All cycles
- 2024: D+4.7 2020: D+6.3 2016: D+2.8 2012: D+4.4 2008: D+13.9
Not yet ingested
- Civics
- —
Market trends
- HPI YoY
- ▼ -54.15%
- Current HPI
- 165.8838
- Rent YoY
- ▲ 2.30%
- Metro
- Peoria, IL
- State GDP YoY
- ▲ 1.59%
- F500 in state
- 60
Industry mix (Fortune 500 HQ in IL)
| Industry | F500 HQs | Revenue |
|---|---|---|
| Insurance | 4 | $201B |
|
||
| Consumer Goods | 4 | $87B |
|
||
| Industrial Machinery | 3 | $64B |
|
||
| Healthcare | 2 | $55B |
|
||
| Retail / Pharmacy | 1 | $148B |
|
||
| Agriculture / Food | 1 | $86B |
|
||
Price history
-7.1% since first listed2 events — show timeline
- 2026-05-08 Price Changed $129,900 RMLSA as Distributed by MLS Grid
- 2026-01-14 Listed $139,900 RMLSA as Distributed by MLS Grid
Property tax history
+5.1%/yrLatest (2024): $1,918 · +4.8% YoY. Source: county tax records.
Cash-flow waterfall
monthlySold comps — $/sqft
last 12 mo · ≤1 miLoading sold comps…