7603 Ashor Dr · Huntsville, AL
Flood risk 1/10 · Minimal
- FEMA flood zone
- X (unshaded)
- Chance of flooding over 30 yrs
- 0.0%
- Est. flood insurance / yr
- $507 – $1,088
Fire risk 3/10 · Minor
- Est. fire insurance / yr
- $916 – $1,700
Heat risk 6/10 · Moderate
- Hot days now (above 104°F)
- 7 days/yr
- Hot days in 30 yrs
- 20 days/yr
Wind risk 4/10 · Minor
- Chance of severe wind over 30 yrs
- 17.0%
Air-quality risk 2/10 · Minimal
- Unhealthy air days now
- 0 days/yr
- Unhealthy air days in 30 yrs
- 1 days/yr
Risk factors via First Street. Map © Google.
Why this score? — see what drove the D grade
The composite is a weighted blend of 9 inputs, each scored 0–100. Each bar is that input's sub-score; the figure is the points it added to the 100-point composite (weight × sub-score).
- Appreciation +10.0/10.0
- ARV discount +9.1/15.0
- Cash flow +6.7/30.0
- Livability +4.1/5.0
- Rent growth +3.1/5.0
- Schools +2.9/10.0
- Condition / age +2.5/5.0
- 1% rule +1.0/10.0
- DSCR +1.0/10.0
$326,900
🖨 Deal sheet 📄 Offer letter ✓ Due diligence
Listing remarks MLS
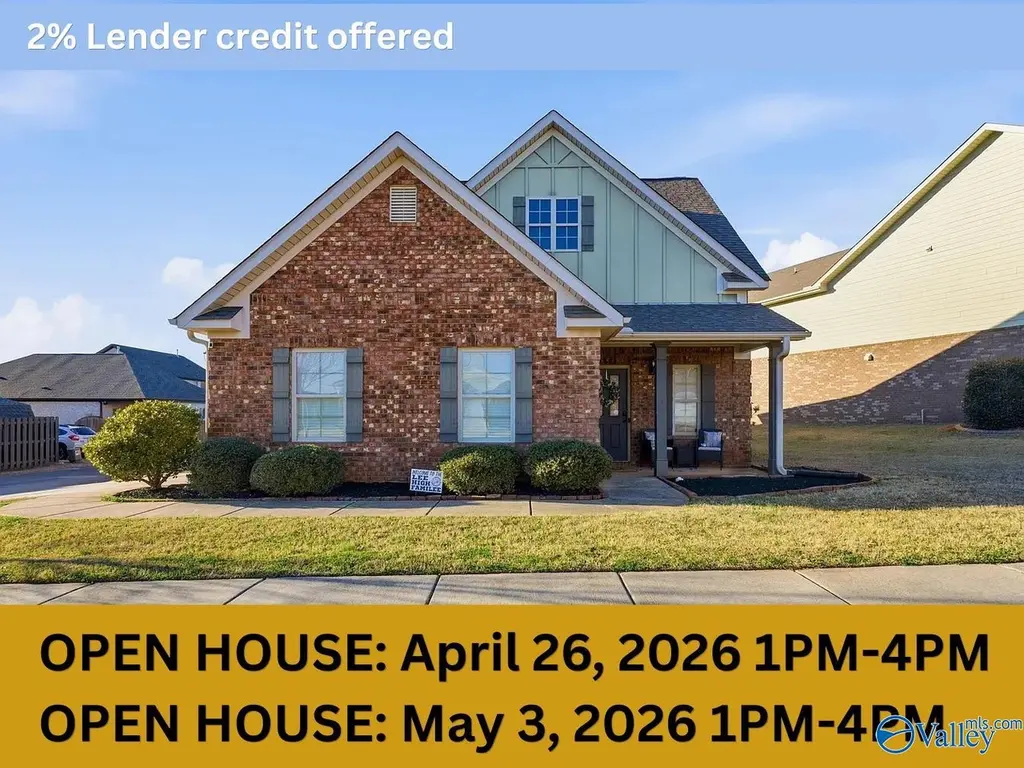
Two (2%) percent lender credit available for those who qualify. Welcome to 7603 Ashor Dr., where comfort, convenience, & character come together. Built in 2014, this well maintained, move-in ready 3-bedroom, 3-bath home, w/loft & flex space, offers a spacious layout perfect for everyday living & entertaining. It's where charm meets modern design. In addition to the bedrooms, you'll find a versatile flex room, ideal for a home office, playroom, workout space, or media room. Enjoy neighborhood amenities including a community pool, playground, and pickleball/basketball court. Located just minutes from Redstone Arsenal, dining & entertainment of Downtown Huntsville. Book a showing TODAY!
Key facts
- 7,840 sq ft lot
- 2 garage spots
- Community pool
Neighborhood map
What this means for you Summary
Snapshot
- This is a 3-bed/1.5-bath single-family listed at $327k.
Deal economics
- At list price, monthly cash flow is $-518 ($-6k/yr) — negative.
- To cash-flow at today's rent, offer at most $235k (28.0% below list).
- To meet the 1% rule (rent ≥ 1% of price), the offer needs to be $195k (40.3% below list).
- Recommended offer: $195k (40.3% below list) — sets the bar for 1% rule.
Location & tenants
- Location reads 82/100 on livability (#3 in AL, #1,082 nationally) — a professional / high-income tenant draw. Strengths: commute A+, cost of living A+, housing A+; Watch: crime F.
- Huntsville City (urban): math 21% / reading 46% proficiency, ranked #48 of 129 in AL (top 37%) — families likely to look elsewhere, expect single-tenant / working-renter base with shorter leases.
- Market conditions: Rents rising (+2.6%/yr); 213 active listings in the ZIP; 7 comparable units currently listed for rent nearby; rentals lingering (median 44d on market — plan ~5-8 weeks vacancy on turnover, expect pricing pressure); 57% of comp listings sitting > 30 days — soft ceiling on asking rent; solid renter incomes; 4,709 units permitted in Madison County in 2024 (1,186 in 5+ unit buildings).
Forward outlook
- In year one you build about $35k of equity ($2k loan paydown + $33k appreciation (10.0% local appreciation)).
- Madison County population projected at +18% by 2050 — long-run rental-demand tailwind backs the buy-and-hold thesis.
- By year 2, paydown + projected appreciation supports a ~$56k cash-out refi (75% LTV) — recoverable capital for the next deal without selling this one.
Negotiation context
- It's been on market 112 days — a 9% lower offer ($297k) is reasonable based on typical stale-listing flexibility.
- 2 sale attempts since 12y ago; this cycle's ask has dropped $18k (5%) from the opening price — seller is motivated, your offer sets the floor, not the list.
- Current owner paid $196k; list at $327k implies a 67% gain — meaningful room to come down on a strong offer.
Risks & watch-outs
- Climate carrying-cost: extreme-heat days projected 7→20/yr by 2055 (HVAC capex compounding) — expect insurance premiums to compound above CPI over the hold.
Questions for the listing agent
- What do current leases actually rent for vs. the listed asking? Can we see a recent rent roll and the last 12 months of T-12 income?
- It's been on market 112 days. Have you received any prior offers? Is the seller open to a 40% concession, seller financing, or rate buy-down credit?
- What does the HOA fee cover, when was the last increase, and are there any pending special assessments or reserve-fund shortfalls?
- Why hasn't it sold? Are there any deal-killer items the seller is aware of (foundation, flood, title, zoning, code violations)?
- Is there a deadline driving the sale (1031 exchange, divorce, estate, relocation)? That informs how much negotiation room exists.
- Crime grade is F in this area — have there been break-ins, vandalism, or insurance claims at this property in the last 3 years? What carrier currently insures it and at what premium?
- The area grade is low — what's the realistic commute time and amenity access for the typical tenant pool here? Any planned neighborhood developments (good or bad) we should know about?
- What's the average days-on-market for RENTAL listings here right now (not sales)? A rising rental-DOM trend means longer vacancies and softer asking-rent achievability than the comps imply.
- What's the recent tenant-quality profile in this submarket — average credit score on applications, eviction rate, late-payment / NSF rate, and stable-employment percentage? A property-management company in the area should have these aggregated.
- How much new for-sale + rental construction is in the pipeline within 1–3 miles? Heavy new supply typically softens prices + rents 12–24 months out; constrained supply supports both.
Investment metrics
- 1% rule
- 0.60% ✗
- Cap rate
- 4.39%
- Cash-on-cash
- -6.80%
- DSCR
- 0.70
- GRM
- 14.0
CMA / ARV
- ARV (median comp)
- $338,944
- List price
- $326,900
- Delta
- -3.55%
- Verdict
- FAIR
- Comps
- 20 within 1.0 mi
Show comp detail 12 sales within ~0.75 mi
| Address | Dist | Beds/Ba | Sqft | Sold | Price | $/sf | Match |
|---|---|---|---|---|---|---|---|
| 8210 Stone Mill Dr NW | 0.04mi | 3/2.5 | 2,094 (-11%) | 6mo | $310,000 | $148 | 71 |
| 6018 Taramore Ln NW | 0.54mi | 4/2.5 (+1) | 2,303 (-2%) | 2mo | $332,000 | $144 | 61 |
| 6525 Moon Crest Ln | 0.57mi | 4/3.0 (+1) | 2,371 (+1%) | 4mo | $355,000 | $150 | 57 |
| 8307 Stillwater Cir NW | 0.12mi | 4/2.5 (+1) | 2,020 (-14%) | 7mo | $290,000 | $144 | 56 |
| 6608 Shearleaf Rd NW | 0.36mi | 4/3.0 (+1) | 2,019 (-14%) | 3mo | $366,008 | $181 | 47 |
| 6233 NW Taramore Ln | 0.53mi | 4/2.5 (+1) | 2,077 (-11%) | 1mo | $282,782 | $136 | 46 |
| 6229 NW Taramore Ln #091 | 0.53mi | 4/2.5 (+1) | 2,077 (-11%) | 2mo | $283,832 | $137 | 46 |
| 6221 NW Taramore Ln | 0.53mi | 4/2.5 (+1) | 2,077 (-11%) | 2mo | $279,850 | $135 | 46 |
| 7004 Oakleigh Rose Dr | 0.53mi | 4/3.0 (+1) | 2,124 (-9%) | 4mo | $355,000 | $167 | 45 |
| 7203 Chatfield Way NW | 0.67mi | 4/2.5 (+1) | 2,047 (-13%) | 3mo | $290,000 | $142 | 36 |
| 6032 Barringer Ct | 0.71mi | 4/2.5 (+1) | 2,119 (-10%) | 8mo | $261,000 | $123 | 36 |
| 6612 Cotton Creek Rd | 0.72mi | 4/2.5 (+1) | 2,024 (-14%) | 5mo | $260,000 | $128 | 31 |
Match score weights: distance 35% · size 25% · config 20% · recency 20%. Top-matched comps best support the ARV.
Projected returns pro-forma
10.0% appreciation · 2.57% rent growth · sell at horizon
- IRR
- 19.4%
- Equity multiple
- 2.57×
- Total profit
- $144,093
- Equity at exit
- $294,497
- IRR
- 17.8%
- Equity multiple
- 5.90×
- Total profit
- $448,429
- Equity at exit
- $635,095
Cash invested: $91,532 (down + closing). Projections, not guarantees.
Landlord ↔ Tenant lean methodology
- Overall (STATE)
- 90 Strongly Landlord-Friendly
- State Alabama
- 90 Strongly Landlord-Friendly · R+15
- County
- — inherits STATE
- City
- — inherits STATE
ZIP-level market 35806
- Home prices YoY
- 20.0%
- Rents YoY
- 2.6%
- Active inventory
- 213
- Price-to-rent
- 14.0×
Monthly cashflow live
- Estimated rent
- $1,952 high interval (Pro) →
- Mortgage (P&I)
- −$1,714
- Tax from tax record
- −$177 /mo · $2,127/yr
- Insurance
- −$136
- HOA
- −$33
- Vacancy / Maint / Mgmt
- −$410
- Net cashflow
- $-518
Break-even live
UW: 25.0% down · 7.5% · 30yr · 1.5% tax · 5.0% vac · 8.0% maint · 8.0% mgmt
Financing live
Cash to close
- Down payment
- $81,725
- Closing costs
- $9,807
- Reserves months
- —
- Total cash needed
- —
Loan-product check · same deal, 3 products live
Conventional
25% down · 7.5% · 30yr
- Down + closing
- —
- Monthly P&I
- —
- Monthly cashflow
- —
- DSCR
- —
- Eligible?
- —
Personal DTI + credit; lowest rate.
DSCR
20% down · 8.5% · 30yr
- Down + closing
- —
- Monthly P&I
- —
- Monthly cashflow
- —
- DSCR
- —
- Eligible?
- —
No personal income docs; deal must DSCR.
Hard money
10% down · 12.0% · 12mo
- Down + closing
- —
- Monthly P&I
- —
- Monthly cashflow
- —
- DSCR
- —
- Eligible?
- —
Short-term bridge; refi at stabilization.
Rent comps 7 comps
| Address | Beds | Baths | Sqft | Rent | $/sqft | DOM | Units | Dist |
|---|---|---|---|---|---|---|---|---|
| 8223 Stone Mill Dr NW Huntsville, AL | 3.0 | 2.5 | 2046 | $2,300 | $1.12 | 43d | 1 | 0.10mi |
| 7601 Discovery Point Dr NW Huntsville, AL | 3.0 | 2.5 | 1720 | $1,720 | $1.00 | 43d | 1 | 0.18mi |
| 7502 Discovery Point Dr NW Huntsville, AL | 3.0 | 2.5 | 1626 | $1,825 | $1.12 | 43d | 1 | 0.39mi |
| 7203 Chatfield Way NW Huntsville, AL | 4.0 | 2.5 | 2047 | $1,799 | $0.88 | 43d | 1 | 0.70mi |
| 171 Kingswood Dr Huntsville, AL | 4.0 | 2.5 | 2850 | $2,500 | $0.88 | 13d | 1 | 1.19mi |
| 1012 Scarlet Woods Huntsville, AL | 2.0 | 2.0 | 1626 | $1,699 | $1.04 | 21d | 1 | 1.24mi |
| 351 Lofton Rd NW Huntsville, AL | 4.0 | 2.5 | 2186 | $2,315 | $1.06 | 13d | 1 | 1.29mi |
HOA detail
- Monthly dues
- $33 · $396/yr
- Likely covers
- pool
Listing history 18 events
-
2026-06-18days on market $326,900 Active 112 DOM
-
2026-06-17days on market $326,900 Active 111 DOM
-
2026-06-16days on market $326,900 Active 110 DOM
-
2026-06-15days on market $326,900 Active 109 DOM
-
2026-06-14pricedays on market $326,900 Active 107 DOM
-
2026-06-10days on market $339,900 Active 104 DOM
-
2026-06-09days on market $339,900 Active 103 DOM
-
2026-06-08days on market $339,900 Active 102 DOM
-
2026-06-07days on market $339,900 Active 101 DOM
-
2026-06-03days on market $339,900 Active 97 DOM
-
2026-06-02days on market $339,900 Active 96 DOM
-
2026-06-01days on market $339,900 Active 95 DOM
-
2026-05-31days on market $339,900 Active 94 DOM
-
2026-05-30days on market $339,900 Active 93 DOM
-
2026-04-19price $344,900 711-char remark
Show marketing remark (711 chars)
Two (2%) percent lender credit available for those who qualify. Welcome to 7603 Ashor Dr., where comfort, convenience, & character come together. Built in 2014, this well maintained, move-in ready 3-bedroom, 3-bath home, w/loft & flex space, offers a spacious layout perfect for everyday living & entertaining. It's where charm meets modern design. In addition to the bedrooms, you'll find a versatile flex room, ideal for a home office, playroom, workout space, or media room. Enjoy neighborhood amenities including a community pool, playground, and pickleball/basketball court. Located just minutes from Redstone Arsenal, dining & entertainment of Downtown Huntsville. Book a showing TODAY!
-
2026-02-27$345,000 Active 711-char remark
Show marketing remark (711 chars)
Two (2%) percent lender credit available for those who qualify. Welcome to 7603 Ashor Dr., where comfort, convenience, & character come together. Built in 2014, this well maintained, move-in ready 3-bedroom, 3-bath home, w/loft & flex space, offers a spacious layout perfect for everyday living & entertaining. It's where charm meets modern design. In addition to the bedrooms, you'll find a versatile flex room, ideal for a home office, playroom, workout space, or media room. Enjoy neighborhood amenities including a community pool, playground, and pickleball/basketball court. Located just minutes from Redstone Arsenal, dining & entertainment of Downtown Huntsville. Book a showing TODAY!
-
2014-12-30soldstatus $195,500 532-char remark
Show marketing remark (532 chars)
The Thomas by Valor Communities features over 1,800 heated sq.ft. of amazing living space. This is a beautiful open plan with custom detail throughout. Kitchen includes an island and opens to the dining and great room with a fireplace. Secluded master suite on main level features trey ceilings & spacious master bath and huge master closet. Additional features include recessed lighting, 5" hand-scraped hardwood floors in the foyer, kitchen & dining and a great selection of granite counter tops. ASK ABOUT FALL PROMO
-
2014-09-17$195,900 532-char remark
Show marketing remark (532 chars)
The Thomas by Valor Communities features over 1,800 heated sq.ft. of amazing living space. This is a beautiful open plan with custom detail throughout. Kitchen includes an island and opens to the dining and great room with a fireplace. Secluded master suite on main level features trey ceilings & spacious master bath and huge master closet. Additional features include recessed lighting, 5" hand-scraped hardwood floors in the foyer, kitchen & dining and a great selection of granite counter tops. ASK ABOUT FALL PROMO
ⓘ Source: listings_history table (triggers on properties + properties_extension) + one-shot
backfill from property_details.listing_events for pre-trigger history.
Tax reassessment forecast AL · Resets to sale price
- Current annual tax
- $2,127 · $177/mo
- Projected year-2 tax
- $2,127 · $177/mo
- Expected delta
- $0/yr ($0/mo · 0.0%)
ⓘ Screening estimate from a state-policy table — verify with the county assessor before closing.
Climate risk First Street
- Flood 1/10 Low FEMA zone X (unshaded) · 0% chance over 30 yrs
- Wildfire 3/10 Moderate
- Heat 6/10 Major 7 d/yr ≥104°F today · 20 d/yr by 30 yrs out
- Wind 4/10 Moderate 17% chance of damaging wind over 30 yrs
- Air quality 2/10 Low 0 unhealthy d/yr today · 1 by 30 yrs out
Nearby sold comps map
Loading sold comps map…
Walkable amenities ~0.75 mi
Loading nearby amenities…
Taxation est. · year 1
- Rental income
- $23,430
- − Mortgage interest
- −$18,311
- − Property taxes
- −$2,127
- − Insurance
- −$1,634
- − Repairs & maintenance
- −$1,874
- − Management
- −$1,874
- − HOA
- −$396
- − Depreciation
- −$9,510
- Taxable loss
- −$12,298
- Est. tax savings @ 24.0%
- +$2,952
- After-tax cash flow
- $-3,268/yr
For passive investors: Depreciation is non-cash, so a rental often shows a tax loss while cash-flowing — sheltering income. Rental losses are passive: they offset passive income freely, and up to $25,000/yr can offset ordinary (W-2) income if you actively participate and your MAGI is under $100k (phasing out to $0 by $150k); unused losses carry forward. On sale, claimed depreciation is recaptured at up to 25%, and gains may owe capital-gains tax (a 1031 exchange can defer both). Figures are a year-1 estimate at your 24.0% rate — not tax advice; consult a CPA.
Schools (NCES district)
- District
- Huntsville City
- NCES district ID
- 0101800
- Math proficiency
- 21% ▼ -23.00%
- Reading proficiency
- 46% ▬ 0.00%
- Median HH income
- $48,264
- Composite
- 28.84/100
- National rank
- #6647
- State rank
- #48 of 129 in AL
Livability — Huntsville
- Score
- 82/100
- State rank
- #3
- US rank
- #1082
Category grades
Schools grade is shown separately in the Schools card above.
Census & demographics
- Census place
- Huntsville, AL
- County
- Madison County · 380,832 people
- City population
- 220,435
- Metro
- Huntsville, AL
- Population (ZIP)
- 29,161
- Household income
- $86,768
- Rent vs Own
- Severe rent burden
- 1249.0
Population outlook (Madison County) Hauer SSP2
- Today (2025)
- 392,086 people
- By 2030
- 409,788 · +4.5%
- By 2040
- 440,557 · +12.4%
- By 2050
- 460,990 · +17.6%
- By 2075
- 502,872 · +28.3%
- By 2100
- 513,623 · +31.0%
Race, ethnicity, and origin ACS 2023
- Neighborhood character
- Diverse neighborhood (Simpson 0.57)
- Race & ethnicity
- White 58% Black 30% Hispanic / Latino 5% Two or more races 5% Asian 4%
- Hispanic origin (detail)
- Mexican 2% Puerto Rican 2%
- Common ancestry
- Slovak 2% Italian 2% Serbian 2%
- Foreign-born
- 7% · Canada, Vietnam, China
- Languages at home
- 93% English-only · Spanish 2% Other Indo-European 1% Other Asian/Pacific 1%
Political lean MEDSL · Madison
- 2024 margin
- Lean R (+9.0) · D 44.7% · R 53.7% · Other 1.6%
- 2008→2024 swing
- +6.0pp toward D · 2008: -14.9pp · 2024: -9.0pp
- All cycles
- 2024: R+9.0 2020: R+8.0 2016: R+16.8 2012: R+18.7 2008: R+14.9
Not yet ingested
- Civics
- —
Market trends
- HPI YoY
- ▲ 71.67%
- Current HPI
- 430.5866
- Rent YoY
- ▲ 2.57%
- Metro
- Huntsville, AL
- State GDP YoY
- ▲ 2.94%
- F500 in state
- 4
Industry mix (Fortune 500 HQ in AL)
| Industry | F500 HQs | Revenue |
|---|---|---|
| Financial Services | 1 | $8B |
|
||
| Healthcare | 1 | $5B |
|
||
Price history
+76.1% since first listed4 events — show timeline
- 2026-04-19 Price Changed $344,900 VMLS
- 2026-02-27 Listed $345,000 VMLS
- 2014-12-30 Sold (MLS) $195,500 VMLS
- 2014-09-17 Listed $195,900 VMLS
Property tax history
+19.8%/yrLatest (2024): $2,127 · +2.3% YoY. Source: county tax records.
Cash-flow waterfall
monthlySold comps — $/sqft
last 12 mo · ≤1 miLoading sold comps…