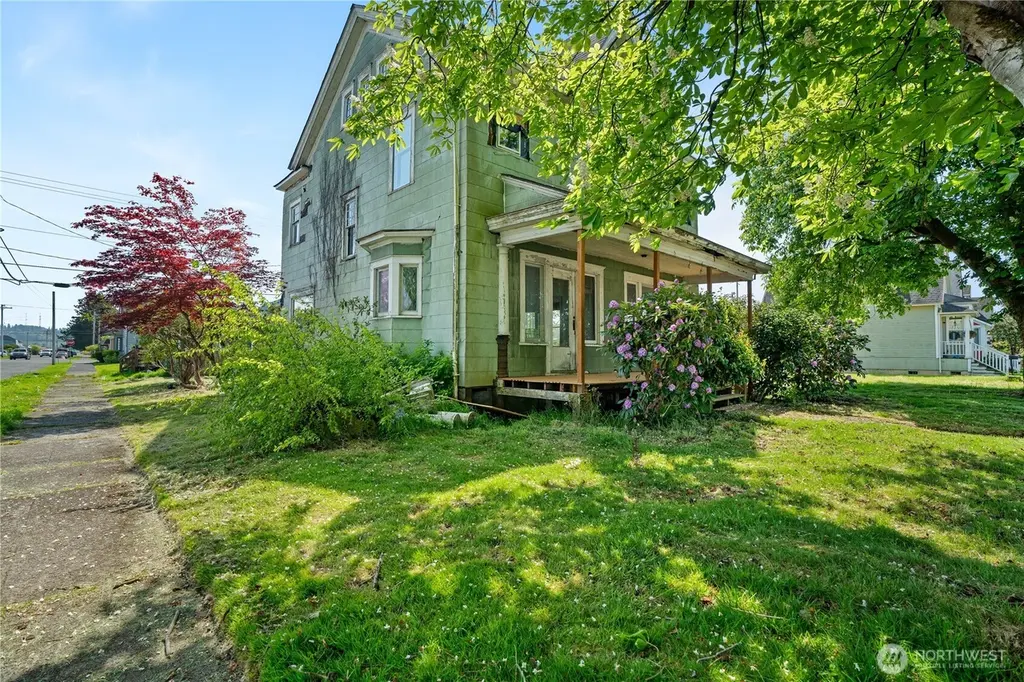
901 W Market St · Aberdeen, WA
Flood risk 6/10 · Moderate
- FEMA flood zone
- AE
- Chance of flooding over 30 yrs
- 0.86%
- Est. flood insurance / yr
- $1,737 – $8,500
Fire risk 1/10 · Minimal
- Est. fire insurance / yr
- $604 – $1,122
Heat risk 1/10 · Minimal
- Hot days now (above 77°F)
- 8 days/yr
- Hot days in 30 yrs
- 17 days/yr
Wind risk 1/10 · Minimal
- Chance of severe wind over 30 yrs
- —
Air-quality risk 6/10 · Moderate
- Unhealthy air days now
- 7 days/yr
- Unhealthy air days in 30 yrs
- 7 days/yr
Risk factors via First Street. Map © Google.
Why this score? — see what drove the B+ grade
The composite is a weighted blend of 9 inputs, each scored 0–100. Each bar is that input's sub-score; the figure is the points it added to the 100-point composite (weight × sub-score).
- Cash flow +30.0/30.0
- ARV discount +15.0/15.0
- DSCR +10.0/10.0
- 1% rule +8.0/10.0
- Livability +4.0/5.0
- Rent growth +3.6/5.0
- Schools +3.6/10.0
- Condition / age +2.5/5.0
- Appreciation +0.0/10.0
$160,000
🖨 Deal sheet 📄 Offer letter ✓ Due diligence
Listing remarks
Calling all investors and visionaries! This 2,000+ sq ft home is a full rehab opportunity packed with potential. Featuring tall ceilings, original wood floors, and a kitchen with butler’s pantry, this property is rich with old-world charm including original servant stairs and a beautifully detailed formal staircase. A full-height attic with staircase offers even more room to expand. Bring your vision and tools to restore this diamond in the rough!
Key facts
- Servant stairs
- Original wood floors
- Formal staircase
Tags
Property features AI
Finance
- Other: Living area reported as 2,044; Lot size approximately 0.1157 acres; MLS status: Active
- Financial info: Listing terms: Cash
Exterior
- Parking: Off-street parking
- Security: Partially fenced
- Utilities: Public water; Sewer connected; Electric service; Water and sewer provided by City of Aberdeen; Power provided by GH PUD
- Home design: Single-family house; Two stories; Main-level entry; Built on lot; Corner lot with sidewalk; Facing: not specified
- Construction: Wood construction; Composition roof; Pillar/post/pier foundation; Effective year built 1907
- Exterior features: Partially fenced yard; Wood exterior
Interior
- Kitchen: Refrigerator included
- Bedrooms: 4 bedrooms
- Flooring: Hardwood flooring
- Bathrooms: One three-quarter bathroom; One half bathroom; One main-level bathroom
- Heating & cooling: No central heating listed; No central cooling listed
- Interior features: Dining room; Fireplace
- Laundry & utility: Water heater located in mudroom
Neighborhood map
What this means for you Summary
Snapshot
- This is a 4-bed/1.5-bath single-family listed at $160k.
Deal economics
- At list price, monthly cash flow is $211 ($3k/yr) — positive.
- The deal already cash-flows at list — no discount required.
- Meets the 1% rule at list price ($2k rent vs $160k).
- Recommended offer: $155k (3.0% below list) — sets the bar for market timing.
- Cap rate 11.1% vs local median 4.1% in Aberdeen — top-decile yield for the area; either an underpriced asset or a hidden risk that comps aren't pricing in. Stress-test before assuming the spread holds.
Location & tenants
- Location reads 81/100 on livability (#73 in WA, #1,320 nationally) — a professional / high-income tenant draw. Strengths: amenities A+, commute A+, cost of living A+; Watch: crime D-, employment F.
- Aberdeen School District (town): math 35% / reading 45% proficiency, ranked #222 of 291 in WA (top 76%) — families likely to look elsewhere, expect single-tenant / working-renter base with shorter leases; 61% free/reduced lunch — lower-income household profile, screen leases tightly.
- Zoned schools: J M Weatherwax High School (916 students, 63% FRL) — zoned schools at 63% FRL track the district average.
- Market conditions: Rents rising fast (+4.3%/yr); 257 active listings in the ZIP; 2 comparable units currently listed for rent nearby; 297 units permitted in Grays Harbor County in 2024 (17 in 5+ unit buildings).
- This rent runs 43% of the median local income ($58k/yr) — at the standard rent-burdened threshold; future hikes will face affordability resistance.
Forward outlook
- Local home prices are declining (-3.0%/yr); year-one equity from $1k of loan paydown is wiped out by about $5k of value loss. Plan a longer hold.
- Grays Harbor County population projected at -24% by 2050 — secular population decline; favor cash flow + early exit over multi-decade hold.
Negotiation context
- It's been on market 45 days — a 3% lower offer ($155k) is reasonable based on typical stale-listing flexibility.
- 4 sale attempts since 5y ago with the ask held roughly flat each time — persistent listings suggest the price (not the market) is what's stuck; bring a comps-based counter.
- Current owner paid $135k; 19% above their basis — modest negotiation headroom, anchor on the comps not their cost.
Risks & watch-outs
- Watch-outs: flood insurance adds $427/mo; built in 1907 — expect roof / HVAC / electrical / plumbing capex.
- Climate carrying-cost: in FEMA flood zone AE (mandatory federal flood insurance) — expect insurance premiums to compound above CPI over the hold.
Questions for the listing agent
- It's been on market 45 days. Have you received any prior offers? Is the seller open to a 3% concession, seller financing, or rate buy-down credit?
- Built in 1907 — when were the roof, HVAC, electrical panel, plumbing, and water heater last replaced?
- What's the actual annual flood-insurance premium (NFIP or private), and is the property in a SFHA with mandatory coverage?
- Is there a deadline driving the sale (1031 exchange, divorce, estate, relocation)? That informs how much negotiation room exists.
- Schools are D-rated, which usually means shorter tenancies and higher turnover. Who's the typical renter profile here, and what's been the actual vacancy rate?
- Crime grade is D in this area — have there been break-ins, vandalism, or insurance claims at this property in the last 3 years? What carrier currently insures it and at what premium?
- What's the average days-on-market for RENTAL listings here right now (not sales)? A rising rental-DOM trend means longer vacancies and softer asking-rent achievability than the comps imply.
- What's the recent tenant-quality profile in this submarket — average credit score on applications, eviction rate, late-payment / NSF rate, and stable-employment percentage? A property-management company in the area should have these aggregated.
- How much new for-sale + rental construction is in the pipeline within 1–3 miles? Heavy new supply typically softens prices + rents 12–24 months out; constrained supply supports both.
Investment metrics
- 1% rule
- 1.30% ✓
- Cap rate
- 11.08%
- Cash-on-cash
- 17.08%
- DSCR
- 1.76
- GRM
- 6.4
CMA / ARV
- ARV (median comp)
- $245,956
- List price
- $160,000
- Delta
- -34.95%
- Verdict
- UNDERPRICED
- Comps
- 20 within 1.0 mi
Show comp detail 12 sales within ~0.75 mi
| Address | Dist | Beds/Ba | Sqft | Sold | Price | $/sf | Match |
|---|---|---|---|---|---|---|---|
| 709 W 2nd St | 0.18mi | 4/1.0 | 1,992 (-2%) | 8mo | $245,000 | $123 | 79 |
| 602 W 2nd St | 0.27mi | 3/1.0 (-1) | 1,882 (-8%) | 3mo | $250,000 | $133 | 65 |
| 410 W 4th St | 0.45mi | 3/2.0 (-1) | 2,021 (-1%) | 11mo | $385,000 | $190 | 61 |
| 1520 W Market St | 0.34mi | 3/1.0 (-1) | 1,863 (-9%) | 4mo | $187,500 | $101 | 59 |
| 1314 W Market St | 0.20mi | 3/3.0 (-1) | 1,828 (-11%) | 4mo | $325,000 | $178 | 59 |
| 1519 Pacific Ave | 0.39mi | 3/1.5 (-1) | 1,816 (-11%) | 1mo | $262,500 | $145 | 58 |
| 620 N Michigan St | 0.48mi | 4/2.0 | 2,200 (+8%) | 8mo | $340,000 | $155 | 56 |
| 954 N Division St | 0.71mi | 4/2.0 | 2,104 (+3%) | 13mo | $299,000 | $142 | 49 |
| 612 N Alder St | 0.43mi | 4/1.0 | 1,792 (-12%) | 10mo | $135,000 | $75 | 49 |
| 1309 W 5th St | 0.55mi | 3/1.5 (-1) | 1,870 (-8%) | 9mo | $355,000 | $190 | 48 |
| 2122 Bay Ave | 0.72mi | 3/2.5 (-1) | 2,028 (-1%) | 12mo | $346,000 | $171 | 46 |
| 809 N K St | 0.70mi | 3/2.0 (-1) | 2,307 (+13%) | 10mo | $400,000 | $173 | 30 |
Match score weights: distance 35% · size 25% · config 20% · recency 20%. Top-matched comps best support the ARV.
Projected returns pro-forma
-3.0% appreciation · 4.35% rent growth · sell at horizon
- IRR
- -5.5%
- Equity multiple
- 0.79×
- Total profit
- $-9,373
- Equity at exit
- $23,857
- IRR
- 6.2%
- Equity multiple
- 1.50×
- Total profit
- $22,208
- Equity at exit
- $13,834
Cash invested: $44,800 (down + closing). Projections, not guarantees.
Landlord ↔ Tenant lean methodology
- Overall (STATE)
- 28 Tenant-Leaning
- State Washington
- 28 Tenant-Leaning · D+8
- County
- — inherits STATE
- City
- — inherits STATE
ZIP-level market 98520
- Rents YoY
- 4.3%
- Active inventory
- 257
- Price-to-rent
- 6.4×
Monthly cashflow live
- Estimated rent
- $2,084 medium interval (Pro) →
- Mortgage (P&I)
- −$839
- Tax from tax record
- −$103 /mo · $1,232/yr
- Insurance
- −$67
- Flood insurance flood zone
- −$427 /mo · $5,118/yr
- HOA
- −$0
- Vacancy / Maint / Mgmt
- −$438
- Net cashflow
- $211
Break-even live
UW: 25.0% down · 7.5% · 30yr · 1.5% tax · 5.0% vac · 8.0% maint · 8.0% mgmt
Financing live
Cash to close
- Down payment
- $40,000
- Closing costs
- $4,800
- Reserves months
- —
- Total cash needed
- —
Loan-product check · same deal, 3 products live
Conventional
25% down · 7.5% · 30yr
- Down + closing
- —
- Monthly P&I
- —
- Monthly cashflow
- —
- DSCR
- —
- Eligible?
- —
Personal DTI + credit; lowest rate.
DSCR
20% down · 8.5% · 30yr
- Down + closing
- —
- Monthly P&I
- —
- Monthly cashflow
- —
- DSCR
- —
- Eligible?
- —
No personal income docs; deal must DSCR.
Hard money
10% down · 12.0% · 12mo
- Down + closing
- —
- Monthly P&I
- —
- Monthly cashflow
- —
- DSCR
- —
- Eligible?
- —
Short-term bridge; refi at stabilization.
Rent comps 2 comps
| Address | Beds | Baths | Sqft | Rent | $/sqft | DOM | Units | Dist |
|---|---|---|---|---|---|---|---|---|
| 1619 W 6th St Aberdeen, WA | 4.0 | 2.0 | 1750 | $2,295 | $1.31 | 43d | 1 | 0.72mi |
| 908 E 1st St Aberdeen, WA | 3.0 | 1.0 | 1608 | $2,100 | $1.31 | 43d | 1 | 1.13mi |
Listing history 24 events
-
2026-06-19days on market $160,000 Active 45 DOM
-
2026-06-18days on market $160,000 Active 44 DOM
-
2026-06-17days on market $160,000 Active 43 DOM
-
2026-06-16days on market $160,000 Active 42 DOM
-
2026-06-15days on market $160,000 Active 41 DOM
-
2026-06-14days on market $160,000 Active 39 DOM
-
2026-06-12days on market $160,000 Active 38 DOM
-
2026-06-09days on market $160,000 Active 35 DOM
-
2026-06-08days on market $160,000 Active 34 DOM
-
2026-06-07days on market $160,000 Active 33 DOM
-
2026-06-03days on market $160,000 Active 29 DOM
-
2026-06-02days on market $160,000 Active 28 DOM
-
2026-06-01days on market $160,000 Active 27 DOM
-
2026-05-31days on market $160,000 Active 26 DOM
-
2026-05-30days on market $160,000 Active 25 DOM
-
2026-05-05$160,000 Active
-
2024-12-31soldstatus $135,000 Closed
-
2024-11-21status Pending
-
2024-11-08status Active
-
2024-10-27status Pending
-
2024-10-23$135,000 Active
-
2021-05-19soldstatus $128,500 Closed
-
2021-05-05status Pending
-
2021-04-14$79,500 Active
ⓘ Source: listings_history table (triggers on properties + properties_extension) + one-shot
backfill from property_details.listing_events for pre-trigger history.
Tax reassessment forecast WA · Resets to sale price
- Current annual tax
- $1,232 · $103/mo
- Projected year-2 tax
- $1,568 · $131/mo
- Expected delta
- +$336/yr (+$28/mo · 27.3%)
ⓘ Screening estimate from a state-policy table — verify with the county assessor before closing.
Climate risk First Street
- Flood 6/10 Major FEMA zone AE · 86% chance over 30 yrs
- Wildfire 1/10 Low
- Heat 1/10 Low 8 d/yr ≥77°F today · 17 d/yr by 30 yrs out
- Wind 1/10 Low
- Air quality 6/10 Major 7 unhealthy d/yr today · 7 by 30 yrs out
Nearby sold comps map
Loading sold comps map…
Walkable amenities ~0.75 mi
Loading nearby amenities…
Taxation est. · year 1
- Rental income
- $25,005
- − Mortgage interest
- −$8,962
- − Property taxes
- −$1,232
- − Insurance
- −$5,918
- − Repairs & maintenance
- −$2,000
- − Management
- −$2,000
- − Depreciation
- −$4,655
- Taxable income
- $236
- Est. tax owed @ 24.0%
- −$57
- After-tax cash flow
- $2,478/yr
For passive investors: Depreciation is non-cash, so a rental often shows a tax loss while cash-flowing — sheltering income. Rental losses are passive: they offset passive income freely, and up to $25,000/yr can offset ordinary (W-2) income if you actively participate and your MAGI is under $100k (phasing out to $0 by $150k); unused losses carry forward. On sale, claimed depreciation is recaptured at up to 25%, and gains may owe capital-gains tax (a 1031 exchange can defer both). Figures are a year-1 estimate at your 24.0% rate — not tax advice; consult a CPA.
Schools (NCES district)
- District
- Aberdeen School District
- NCES district ID
- 5300030
- Math proficiency
- 35% ▼ -1.00%
- Reading proficiency
- 45% ▬ 0.00%
- Median HH income
- $41,896
- Composite
- 36.13/100
- National rank
- #9477
- State rank
- #222 of 291 in WA
Livability — Aberdeen
- Score
- 81/100
- State rank
- #73
- US rank
- #1320
Category grades
Schools grade is shown separately in the Schools card above.
Census & demographics
- Census place
- Aberdeen, WA
- County
- Grays Harbor County · 44,693 people
- City population
- 24,888
- Metro
- Aberdeen, WA
- Population (ZIP)
- 24,888
- Household income
- $58,153
- Rent vs Own
- Severe rent burden
- 635.0
Population outlook (Grays Harbor County) Hauer SSP2
- Today (2025)
- 66,443 people
- By 2030
- 63,255 · -4.8%
- By 2040
- 56,466 · -15.0%
- By 2050
- 50,516 · -24.0%
- By 2075
- 39,296 · -40.9%
- By 2100
- 31,142 · -53.1%
Race, ethnicity, and origin ACS 2023
- Neighborhood character
- Predominantly White (70%)
- Race & ethnicity
- White 70% Hispanic / Latino 16% Two or more races 9% Black 4% Native American 3% Asian 1% Pacific Islander 1%
- Hispanic origin (detail)
- Mexican 11%
- Common ancestry
- Portuguese 4% Italian 3% Lithuanian 2%
- Foreign-born
- 7% · Canada
- Languages at home
- 87% English-only · Spanish 10% Other Asian/Pacific 1% German/W. Germanic 1%
Political lean MEDSL · Grays Harbor
- 2024 margin
- Lean R (+6.0) · D 45.6% · R 51.6% · Other 2.8%
- 2008→2024 swing
- -20.6pp toward R · 2008: 14.6pp · 2024: -6.0pp
- All cycles
- 2024: R+6.0 2020: R+6.6 2016: R+7.1 2012: D+14.0 2008: D+14.6
Not yet ingested
- Civics
- —
Market trends
- HPI YoY
- ▼ -138.75%
- Current HPI
- 207.7393
- Rent YoY
- ▲ 4.35%
- Metro
- Aberdeen, WA
- State GDP YoY
- ▲ 4.65%
- F500 in state
- 22
Industry mix (Fortune 500 HQ in WA)
| Industry | F500 HQs | Revenue |
|---|---|---|
| Retail | 2 | $269B |
|
||
| Technology / Retail | 1 | $638B |
|
||
| Technology | 1 | $245B |
|
||
| Telecommunications | 1 | $38B |
|
||
| Food / Beverage | 1 | $36B |
|
||
| Automotive / Trucks | 1 | $34B |
|
||
Price history
+101.3% since first listed9 events — show timeline
- 2026-05-05 Listed $160,000 NWMLS as Distributed by MLS Grid
- 2024-12-31 Sold (MLS) $135,000 NWMLS as Distributed by MLS Grid
- 2024-11-21 Pending — NWMLS as Distributed by MLS Grid
- 2024-11-08 Relisted — NWMLS as Distributed by MLS Grid
- 2024-10-27 Pending — NWMLS as Distributed by MLS Grid
- 2024-10-23 Listed $135,000 NWMLS as Distributed by MLS Grid
- 2021-05-19 Sold (MLS) $128,500 NWMLS as Distributed by MLS Grid
- 2021-05-05 Pending — NWMLS as Distributed by MLS Grid
- 2021-04-14 Listed $79,500 NWMLS as Distributed by MLS Grid
Property tax history
+0.4%/yrLatest (2026): $1,232 · -22.1% YoY. Source: county tax records.
Cash-flow waterfall
monthlySold comps — $/sqft
last 12 mo · ≤1 miLoading sold comps…