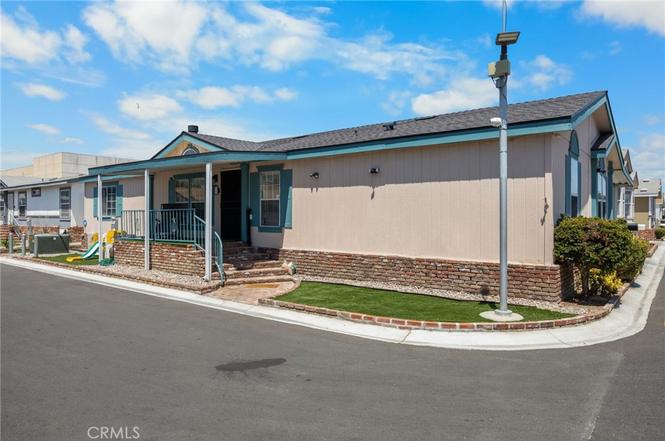
19127 Pioneer Blvd #63 · Artesia, CA
Flood risk 3/10 · Minor
- FEMA flood zone
- X
- Chance of flooding over 30 yrs
- 0.07%
- Est. flood insurance / yr
- $507 – $1,088
Fire risk 1/10 · Minimal
- Est. fire insurance / yr
- $659 – $1,223
Heat risk 5/10 · Moderate
- Hot days now (above 89°F)
- 7 days/yr
- Hot days in 30 yrs
- 23 days/yr
Wind risk 1/10 · Minimal
- Chance of severe wind over 30 yrs
- —
Air-quality risk 5/10 · Moderate
- Unhealthy air days now
- 7 days/yr
- Unhealthy air days in 30 yrs
- 9 days/yr
Risk factors via First Street. Map © Google.
Why this score? — see what drove the B+ grade
The composite is a weighted blend of 9 inputs, each scored 0–100. Each bar is that input's sub-score; the figure is the points it added to the 100-point composite (weight × sub-score).
- Cash flow +30.0/30.0
- ARV discount +12.6/15.0
- 1% rule +10.0/10.0
- DSCR +10.0/10.0
- Schools +7.3/10.0
- Livability +3.4/5.0
- Rent growth +2.5/5.0
- Condition / age +2.5/5.0
- Appreciation +0.0/10.0
$225,000
🖨 Deal sheet 📄 Offer letter ✓ Due diligence
Listing remarks MLS
"This is an incredible opportunity—don’t wait! Move into your new home just in time for Summer! Perfect for a growing family, this spacious Manufactured Home features: 4 bedrooms, 2 full bathrooms, a large family room, and a separate living room with a cozy fireplace for chilly nights. Enjoy high ceilings, an inside laundry room, and central heating and air conditioning for year-round comfort. The kitchen has freshly repainted cabinets, new laminate flooring in the bedrooms, and a master suite with a generous walk-in closet. With parking for three cars and plenty of space to entertain, this home is located in the highly desirable ABC School District, near Cerritos Mall, top restaurants, shops, transportation, and easy access to the 91 and 605 freeways. A must-see
Key facts
- Cozy fireplace
- Largest floor plans
- Corner lot
Tags
Property features AI
Finance
- Other: Park name: LeBelle Chateau
- Financial info: Land lease amount: $2,600
- HOA & community: Land lease community (LeBelle Chateau); Street lighting in community; Manager approval required for residency; Pets allowed with breed restrictions
Exterior
- Parking: Carport with space for 3 vehicles
- Utilities: Public sewer; District/public water
- Home design: Single-story mobile home; Mobile home remains on site; Mobile dimensions approximately 27' x 60'; Entry on level 1
- Construction: Brick skirting; Year built reported by builder
- Exterior features: Front porch with brick accents; Community pool; Corner lot
Interior
- Bedrooms: One level home
- Flooring: Laminate flooring
- Bathrooms: 2 full bathrooms; Bathtub
- Heating & cooling: Central heating (furnace); Central cooling; dual systems
- Interior features: Ceiling fan; Double-pane windows; Community spa
- Laundry & utility: Dedicated laundry room
Neighborhood map
What this means for you Summary
Snapshot
- This is a 4-bed/2.0-bath manufactured listed at $225k.
Deal economics
- At list price, monthly cash flow is $2k ($23k/yr) — positive.
- The deal already cash-flows at list — no discount required.
- Meets the 1% rule at list price ($4k rent vs $225k).
- Cap rate 16.4% vs local median 2.7% in Artesia — top-decile yield for the area; either an underpriced asset or a hidden risk that comps aren't pricing in. Stress-test before assuming the spread holds.
Location & tenants
- Location reads 67/100 on livability (#311 in CA) — a middle-class / working-renter tenant base. Strengths: amenities A+, commute A, employment B+; Watch: crime F, cost of living F, health & safety F.
- Abc Unified (suburban): math 77% / reading 90% proficiency, ranked #24 of 517 in CA (top 5%) — strong family-tenant draw, lease renewals of 3-5y typical.
- Market conditions: 20 active listings in the ZIP; 23 comparable units currently listed for rent nearby; rentals leasing fast (median 7d on market — plan ~1-2 weeks tenant-placement turnaround); 19,697 units permitted in Los Angeles County in 2024 (9,426 in 5+ unit buildings).
Forward outlook
- Local home prices are declining (-3.0%/yr); year-one equity from $2k of loan paydown is wiped out by about $7k of value loss. Plan a longer hold.
- Los Angeles County population projected at +9% by 2050 — modest demand growth; plan on rents tracking national, not racing it.
- At projected returns (-3.0% appreciation + 3.0% rent growth), your $63k cash investment doubles in ~4 years — after that, you're playing with house money.
Negotiation context
- Only 1 days on market — expect competitive offers; lowballing is unlikely to land.
- 7 sale attempts since 20y ago with the ask held roughly flat each time — persistent listings suggest the price (not the market) is what's stuck; bring a comps-based counter.
Risks & watch-outs
- Climate carrying-cost: extreme-heat days projected 7→23/yr by 2055 (HVAC capex compounding) — expect insurance premiums to compound above CPI over the hold.
Questions for the listing agent
- Is there a deadline driving the sale (1031 exchange, divorce, estate, relocation)? That informs how much negotiation room exists.
- Crime grade is F in this area — have there been break-ins, vandalism, or insurance claims at this property in the last 3 years? What carrier currently insures it and at what premium?
- What's the average days-on-market for RENTAL listings here right now (not sales)? A rising rental-DOM trend means longer vacancies and softer asking-rent achievability than the comps imply.
- What's the recent tenant-quality profile in this submarket — average credit score on applications, eviction rate, late-payment / NSF rate, and stable-employment percentage? A property-management company in the area should have these aggregated.
- How much new for-sale + rental construction is in the pipeline within 1–3 miles? Heavy new supply typically softens prices + rents 12–24 months out; constrained supply supports both.
Investment metrics
- 1% rule
- 1.82% ✓
- Cap rate
- 16.39%
- Cash-on-cash
- 36.05%
- DSCR
- 2.60
- GRM
- 4.6
CMA / ARV
- ARV (on-the-fly)
- $253,680
- Comps found
- 4
Show comp detail 4 sales within ~0.75 mi
| Address | Dist | Beds/Ba | Sqft | Sold | Price | $/sf | Match |
|---|---|---|---|---|---|---|---|
| 19127 Pioneer Blvd #63 | 0.00mi | 4/2.0 | 1,620 (-4%) | 14mo | $208,700 | $129 | 83 |
| 19127 Pioneer Blvd #16 | 0.00mi | 3/2.0 (-1) | 1,512 (-10%) | 20mo | $187,000 | $124 | 61 |
| 19127 Pioneer Blvd #53 | 0.00mi | 3/2.5 (-1) | 1,560 (-7%) | 24mo | $255,000 | $163 | 61 |
| 19127 Pioneer Blvd #40 | 0.00mi | 3/2.0 (-1) | 1,456 (-13%) | 20mo | $220,000 | $151 | 56 |
Match score weights: distance 35% · size 25% · config 20% · recency 20%. Top-matched comps best support the ARV.
Projected returns pro-forma
-3.0% appreciation · 3.0% rent growth · sell at horizon
- IRR
- 31.7%
- Equity multiple
- 2.33×
- Total profit
- $84,005
- Equity at exit
- $33,548
- IRR
- 38.8%
- Equity multiple
- 4.62×
- Total profit
- $228,085
- Equity at exit
- $19,454
Cash invested: $63,000 (down + closing). Projections, not guarantees.
Landlord ↔ Tenant lean methodology
- Overall (STATE)
- 18 Strongly Tenant-Friendly
- State California
- 18 Strongly Tenant-Friendly · D+13
- County
- — inherits STATE
- City
- — inherits STATE
ZIP-level market 90701
- Active inventory
- 20
- Price-to-rent
- 4.6×
Monthly cashflow live
- Estimated rent
- $4,100 high interval (Pro) →
- Mortgage (P&I)
- −$1,180
- Tax from tax record
- −$73 /mo · $877/yr
- Insurance
- −$94
- HOA
- −$0
- Vacancy / Maint / Mgmt
- −$861
- Net cashflow
- $1,892
Break-even live
UW: 25.0% down · 7.5% · 30yr · 1.5% tax · 5.0% vac · 8.0% maint · 8.0% mgmt
Financing live
Cash to close
- Down payment
- $56,250
- Closing costs
- $6,750
- Reserves months
- —
- Total cash needed
- —
Loan-product check · same deal, 3 products live
Conventional
25% down · 7.5% · 30yr
- Down + closing
- —
- Monthly P&I
- —
- Monthly cashflow
- —
- DSCR
- —
- Eligible?
- —
Personal DTI + credit; lowest rate.
DSCR
20% down · 8.5% · 30yr
- Down + closing
- —
- Monthly P&I
- —
- Monthly cashflow
- —
- DSCR
- —
- Eligible?
- —
No personal income docs; deal must DSCR.
Hard money
10% down · 12.0% · 12mo
- Down + closing
- —
- Monthly P&I
- —
- Monthly cashflow
- —
- DSCR
- —
- Eligible?
- —
Short-term bridge; refi at stabilization.
Rent comps 23 comps
| Address | Beds | Baths | Sqft | Rent | $/sqft | DOM | Units | Dist |
|---|---|---|---|---|---|---|---|---|
| 18811 S Prado Ct Cerritos, CA | 4.0 | 3.5 | 1849 | $4,300 | $2.33 | 16d | 1 | 0.31mi |
| 11821 E Solana Pl Cerritos, CA | 3.0 | 2.5 | 1849 | $4,350 | $2.35 | 24d | 1 | 0.32mi |
| 11450 186th St Artesia, CA | 3.0 | 2.5 | 1617 | $4,000 | $2.47 | 1d | 1 | 0.52mi |
| 11884 Bertha St Cerritos, CA | 4.0 | 2.0 | 1574 | $4,500 | $2.86 | 24d | 1 | 0.52mi |
| 11417 183rd St Artesia, CA | 3.0 | 3.0 | 1972 | $4,500 | $2.28 | 1d | 1 | 0.75mi |
| 11839 205th St Lakewood, CA | 3.0 | 1.0 | 1060 | $4,500 | $4.25 | 7d | 1 | 0.84mi |
| 18113 Elaine Ave Artesia, CA | 3.0 | 2.0 | 1530 | $4,200 | $2.75 | 1d | 1 | 0.85mi |
| 11733 207th St Lakewood, CA | 3.0 | 2.5 | 1200 | $3,350 | $2.79 | 43d | 1 | 0.93mi |
| 17923 Horst Ave Artesia, CA | 4.0 | 2.0 | 1615 | $4,450 | $2.76 | 2d | 1 | 0.98mi |
| 20726 Seine Ave Lakewood, CA | 3.0 | 2.0 | 1354 | $3,400 | $2.51 | 20d | 1 | 1.07mi |
| 17508 Jersey Ave Artesia, CA | 3.0 | 2.0 | 1440 | $3,600 | $2.50 | 7d | 1 | 1.09mi |
| 11754 Walcroft St Lakewood, CA | 3.0 | 2.0 | 1050 | $3,200 | $3.05 | 43d | 1 | 1.09mi |
| 12022 207th St Lakewood, CA | 3.0 | 2.0 | 1088 | $3,950 | $3.63 | 7d | 1 | 1.10mi |
| 12022 207th St Lakewood, CA | 3.0 | 2.0 | 1088 | $3,950 | $3.63 | 24d | 1 | 1.10mi |
| 11424 Curry Ln Artesia, CA | 3.0 | 2.5 | 1860 | $3,500 | $1.88 | 43d | 1 | 1.13mi |
| 17721 Norwalk Blvd #3 Artesia, CA | 3.0 | 3.0 | 1478 | $3,900 | $2.64 | 43d | 1 | 1.19mi |
| 17320 Mapes Ave Cerritos, CA | 3.0 | 2.0 | 1550 | $4,100 | $2.65 | 1d | 1 | 1.26mi |
| 21003 Longworth Ave Lakewood, CA | 3.0 | 2.0 | 1155 | $3,900 | $3.38 | 43d | 1 | 1.31mi |
| 21003 Longworth Ave Lakewood, CA | 3.0 | 2.0 | 1155 | $3,725 | $3.23 | 2d | 1 | 1.31mi |
| 10751 Andy St Cerritos, CA | 3.0 | 2.0 | 1311 | $4,195 | $3.20 | 1d | 1 | 1.32mi |
| 10751 Andy St Cerritos, CA | 3.0 | 2.0 | 1311 | $4,195 | $3.20 | 7d | 1 | 1.32mi |
| 20817 Ely Ave Lakewood, CA | 3.0 | 1.0 | 1102 | $3,550 | $3.22 | 1d | 1 | 1.41mi |
| 18316 Santana Ave Cerritos, CA | 4.0 | 2.0 | 1515 | $4,500 | $2.97 | 24d | 1 | 1.43mi |
Listing history 2 events
-
2026-06-18remarks 693-char remark
-
2026-06-18$225,000 Active 1 DOM
ⓘ Source: listings_history table (triggers on properties + properties_extension) + one-shot
backfill from property_details.listing_events for pre-trigger history.
Tax reassessment forecast CA · Resets to sale price
- Current annual tax
- $877 · $73/mo
- Projected year-2 tax
- $1,710 · $142/mo
- Expected delta
- +$833/yr (+$69/mo · 94.9%)
ⓘ Screening estimate from a state-policy table — verify with the county assessor before closing.
Climate risk First Street
- Flood 3/10 Moderate FEMA zone X · 7% chance over 30 yrs
- Wildfire 1/10 Low
- Heat 5/10 Major 7 d/yr ≥89°F today · 23 d/yr by 30 yrs out
- Wind 1/10 Low
- Air quality 5/10 Major 7 unhealthy d/yr today · 9 by 30 yrs out
Nearby sold comps map
Loading sold comps map…
Walkable amenities ~0.75 mi
Loading nearby amenities…
Taxation est. · year 1
- Rental income
- $49,203
- − Mortgage interest
- −$12,603
- − Property taxes
- −$877
- − Insurance
- −$1,125
- − Repairs & maintenance
- −$3,936
- − Management
- −$3,936
- − Depreciation
- −$6,545
- Taxable income
- $20,180
- Est. tax owed @ 24.0%
- −$4,843
- After-tax cash flow
- $17,866/yr
For passive investors: Depreciation is non-cash, so a rental often shows a tax loss while cash-flowing — sheltering income. Rental losses are passive: they offset passive income freely, and up to $25,000/yr can offset ordinary (W-2) income if you actively participate and your MAGI is under $100k (phasing out to $0 by $150k); unused losses carry forward. On sale, claimed depreciation is recaptured at up to 25%, and gains may owe capital-gains tax (a 1031 exchange can defer both). Figures are a year-1 estimate at your 24.0% rate — not tax advice; consult a CPA.
Schools (NCES district)
- District
- Abc Unified
- NCES district ID
- 0601620
- Math proficiency
- 77% ▲ 22.00%
- Reading proficiency
- 90% ▲ 24.00%
- Median HH income
- $70,852
- Composite
- 72.51/100
- National rank
- #199
- State rank
- #24 of 517 in CA
Livability — Artesia
- Score
- 67/100
- State rank
- #311
- US rank
- #10525
Category grades
Schools grade is shown separately in the Schools card above.
Census & demographics
- Census place
- Artesia, CA
- City population
- 16,044
- Population (ZIP)
- 16,044
Population outlook (Los Angeles County) Hauer SSP2
- Today (2025)
- 10,940,515 people
- By 2030
- 11,256,481 · +2.9%
- By 2040
- 11,729,929 · +7.2%
- By 2050
- 11,948,407 · +9.2%
- By 2075
- 11,818,114 · +8.0%
- By 2100
- 10,842,928 · -0.9%
Race, ethnicity, and origin ACS 2023
- Neighborhood character
- Diverse neighborhood (Simpson 0.68)
- Race & ethnicity
- Asian 43% Hispanic / Latino 34% White 14% Two or more races 11% Black 5% Pacific Islander 3%
- Hispanic origin (detail)
- Mexican 29%
- Common ancestry
- Russian 7% Iranian 1% Italian 1%
- Foreign-born
- 49% · Canada, South Korea, China
- Languages at home
- 33% English-only · Spanish 25% Other Indo-European 19% Tagalog/Filipino 11%
Political lean MEDSL · Los Angeles
- 2024 margin
- Solid D (+32.9) · D 64.8% · R 31.9% · Other 3.3%
- 2008→2024 swing
- -7.4pp toward R · 2008: 40.4pp · 2024: 32.9pp
- All cycles
- 2024: D+32.9 2020: D+44.2 2016: D+48.0 2012: D+40.0 2008: D+40.4
Not yet ingested
- Civics
- —
Market trends
- HPI YoY
- ▼ -636.45%
- Current HPI
- 447.9791
- Rent YoY
- —
- Metro
- —
- State GDP YoY
- ▲ 3.21%
- F500 in state
- 116
Industry mix (Fortune 500 HQ in CA)
| Industry | F500 HQs | Revenue |
|---|---|---|
| Technology | 27 | $1,492B |
|
||
| Financial Services | 3 | $174B |
|
||
| Retail | 3 | $44B |
|
||
| Insurance | 3 | $26B |
|
||
| Media / Entertainment | 2 | $115B |
|
||
| Pharmaceuticals / Biotech | 2 | $62B |
|
||
Price history
+66.7% since first listed16 events — show timeline
- 2026-06-17 Listed $225,000 CRMLS
- 2025-04-30 Sold (MLS) $208,700 CRMLS
- 2025-03-23 Contingent — CRMLS
- 2025-03-12 Listed $225,000 CRMLS
- 2021-05-14 Sold (MLS) $135,000 CRMLS
- 2021-04-15 Pending — CRMLS
- 2020-11-21 Price Changed $135,000 CRMLS
- 2020-09-18 Listing Removed — CRMLS
- 2020-09-18 Listed $150,000 CRMLS
- 2020-02-27 Listed $160,000 CRMLS
- 2017-08-25 Sold (MLS) $127,000 CRMLS
- 2017-06-29 Relisted — CRMLS
- 2017-06-27 Listing Removed — CRMLS
- 2017-06-20 Listed $127,000 CRMLS
- 2006-04-24 Sold (MLS) $130,000 CRMLS
- 2006-04-04 Listed $135,000 CRMLS
Property tax history
+3.6%/yrLatest (2025): $877 · +3.6% YoY. Source: county tax records.
Cash-flow waterfall
monthlySold comps — $/sqft
last 12 mo · ≤1 miLoading sold comps…