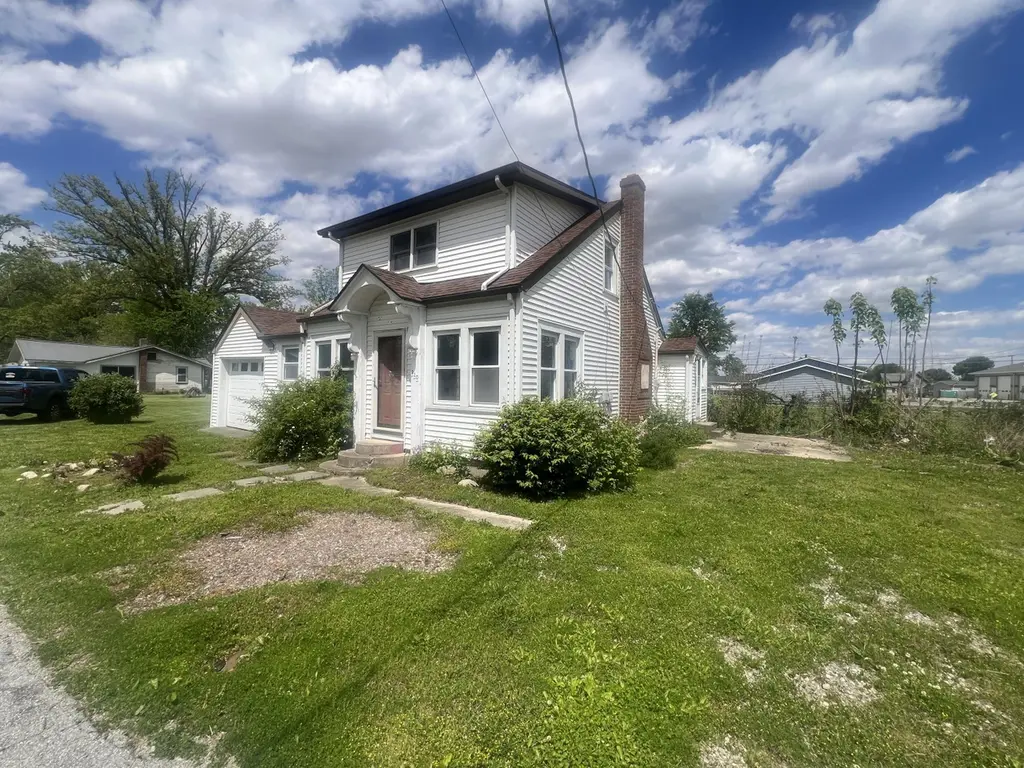
310 Park Ave · Lakeview, OH
Flood risk 6/10 · Moderate
- FEMA flood zone
- X (unshaded)
- Chance of flooding over 30 yrs
- 0.68%
- Est. flood insurance / yr
- $507 – $1,088
Fire risk 1/10 · Minimal
- Est. fire insurance / yr
- $713 – $1,323
Heat risk 3/10 · Minor
- Hot days now (above 100°F)
- 7 days/yr
- Hot days in 30 yrs
- 18 days/yr
Wind risk 2/10 · Minimal
- Chance of severe wind over 30 yrs
- —
Air-quality risk 2/10 · Minimal
- Unhealthy air days now
- 1 days/yr
- Unhealthy air days in 30 yrs
- 2 days/yr
Risk factors via First Street. Map © Google.
Why this score? — see what drove the B+ grade
The composite is a weighted blend of 9 inputs, each scored 0–100. Each bar is that input's sub-score; the figure is the points it added to the 100-point composite (weight × sub-score).
- Cash flow +30.0/30.0
- ARV discount +15.0/15.0
- DSCR +10.0/10.0
- 1% rule +8.3/10.0
- Schools +5.3/10.0
- Livability +3.2/5.0
- Rent growth +2.5/5.0
- Condition / age +2.5/5.0
- Appreciation +0.0/10.0
$104,900
🖨 Deal sheet 📄 Offer letter ✓ Due diligence
Listing remarks MLS
Occupancy at closing! Come check out this cute 2 bedroom bungalow at Indian Lake. Features include a Nice open floor plan, semi-cover patio area, all new plumbing, manicured landscaping and some new flooring! Call today for a private tour. Ask how this home can be purchased with ZERO money down!
Key facts
- Fenced in rear
- Partially gutted
- Updated roof
Tags
Property features AI
Exterior
- Parking: Attached garage with workshop; Garage door opener; 1 garage space
- Utilities: Public sewer; Supplied water
- Home design: Single-family residence; Residential property; Built in 1945
- Construction: Vinyl siding; House structure type
- Exterior features: Porch; Lake-related waterfront; Residential lot (35 x 120)
Interior
- Kitchen: Kitchen (14 x 7)
- Bedrooms: Bedroom 1 (13 x 10); Bedroom 2 (20 x 8); Bedroom 3 (14 x 9)
- Flooring: Hardwood; Laminate
- Bathrooms: 1 full bathroom (11 x 8)
- Heating & cooling: Forced air heating (natural gas); Central air conditioning
- Interior features: Attic; Crawl space basement; 8 total rooms
- Laundry & utility: Utility room (12 x 6)
Neighborhood map
What this means for you Summary
Snapshot
- This is a 3-bed/1.0-bath single-family listed at $105k.
Deal economics
- At list price, monthly cash flow is $390 ($5k/yr) — positive.
- The deal already cash-flows at list — no discount required.
- Meets the 1% rule at list price ($1k rent vs $105k).
- Recommended offer: $102k (3.0% below list) — sets the bar for market timing.
- Cap rate 10.8% vs local median 5.8% in Lakeview — top-decile yield for the area; either an underpriced asset or a hidden risk that comps aren't pricing in. Stress-test before assuming the spread holds.
Location & tenants
- Location reads 63/100 on livability (#836 in OH) — a middle-class / working-renter tenant base. Strengths: crime A+, cost of living A+, housing A+; Watch: schools F, amenities F, commute F.
- Indian Lake Local (rural): math 59% / reading 66% proficiency, ranked #261 of 656 in OH (top 40%) — acceptable for families but not a draw, mixed tenant base, ~2y average lease.
- Market conditions: 112 active listings in the ZIP; 1 comparable units currently listed for rent nearby; 121 units permitted in Logan County in 2024 (0 in 5+ unit buildings).
Forward outlook
- Local home prices are declining (-3.0%/yr); year-one equity from $725 of loan paydown is wiped out by about $3k of value loss. Plan a longer hold.
- Logan County population projected at -15% by 2050 — secular population decline; favor cash flow + early exit over multi-decade hold.
- At projected returns (-3.0% appreciation + 3.0% rent growth), your $29k cash investment doubles in ~8 years — after that, you're playing with house money.
Negotiation context
- It's been on market 37 days — a 3% lower offer ($102k) is reasonable based on typical stale-listing flexibility.
- 4 sale attempts since 12y ago with the ask held roughly flat each time — persistent listings suggest the price (not the market) is what's stuck; bring a comps-based counter.
- Current owner paid $70k; 50% above their basis — modest negotiation headroom, anchor on the comps not their cost.
Risks & watch-outs
- Watch-outs: built in 1945 — expect roof / HVAC / electrical / plumbing capex.
- Climate carrying-cost: major flood risk — expect insurance premiums to compound above CPI over the hold.
Questions for the listing agent
- It's been on market 37 days. Have you received any prior offers? Is the seller open to a 3% concession, seller financing, or rate buy-down credit?
- Built in 1945 — when were the roof, HVAC, electrical panel, plumbing, and water heater last replaced?
- Is there a deadline driving the sale (1031 exchange, divorce, estate, relocation)? That informs how much negotiation room exists.
- Schools are F-rated, which usually means shorter tenancies and higher turnover. Who's the typical renter profile here, and what's been the actual vacancy rate?
- What's the average days-on-market for RENTAL listings here right now (not sales)? A rising rental-DOM trend means longer vacancies and softer asking-rent achievability than the comps imply.
- What's the recent tenant-quality profile in this submarket — average credit score on applications, eviction rate, late-payment / NSF rate, and stable-employment percentage? A property-management company in the area should have these aggregated.
- How much new for-sale + rental construction is in the pipeline within 1–3 miles? Heavy new supply typically softens prices + rents 12–24 months out; constrained supply supports both.
Investment metrics
- 1% rule
- 1.33% ✓
- Cap rate
- 10.76%
- Cash-on-cash
- 15.94%
- DSCR
- 1.71
- GRM
- 6.2
CMA / ARV
- ARV (median comp)
- $135,053
- List price
- $104,900
- Delta
- -22.33%
- Verdict
- UNDERPRICED
- Comps
- 20 within 1.0 mi
Show comp detail 8 sales within ~0.75 mi
| Address | Dist | Beds/Ba | Sqft | Sold | Price | $/sf | Match |
|---|---|---|---|---|---|---|---|
| 180 &170 Church St | 0.35mi | 3/1.0 | 1,071 (-0%) | 8mo | $140,000 | $131 | 77 |
| 345 S Main St | 0.45mi | 2/1.0 (-1) | 1,047 (-2%) | 1mo | $145,000 | $138 | 69 |
| 420 W Harrison St | 0.39mi | 2/1.0 (-1) | 1,058 (-2%) | 17mo | $23,000 | $22 | 60 |
| 195 Midway Ave | 0.14mi | 2/1.5 (-1) | 952 (-11%) | 12mo | $180,000 | $189 | 58 |
| 360 Park Ave | 0.08mi | 2/1.0 (-1) | 928 (-14%) | 14mo | $125,000 | $135 | 57 |
| 150 Church St | 0.33mi | 3/1.0 | 1,216 (+13%) | 23mo | $177,500 | $146 | 43 |
| 10958 State St | 0.72mi | 2/1.0 (-1) | 1,084 (+1%) | 23mo | $270,000 | $249 | 40 |
| 10925 Pine Cir #30 | 0.67mi | 2/2.0 (-1) | 952 (-11%) | 8mo | $65,000 | $68 | 34 |
Match score weights: distance 35% · size 25% · config 20% · recency 20%. Top-matched comps best support the ARV.
Projected returns pro-forma
-3.0% appreciation · 3.0% rent growth · sell at horizon
- IRR
- 6.9%
- Equity multiple
- 1.27×
- Total profit
- $7,862
- Equity at exit
- $15,641
- IRR
- 16.2%
- Equity multiple
- 2.32×
- Total profit
- $38,901
- Equity at exit
- $9,070
Cash invested: $29,372 (down + closing). Projections, not guarantees.
Landlord ↔ Tenant lean methodology
- Overall (STATE)
- 73 Landlord-Friendly
- State Ohio
- 73 Landlord-Friendly · R+6
- County
- — inherits STATE
- City
- — inherits STATE
ZIP-level market 43331
- Home prices YoY
- -30.0%
- Active inventory
- 112
- Price-to-rent
- 6.2×
Monthly cashflow live
- Estimated rent
- $1,400 medium interval (Pro) →
- Mortgage (P&I)
- −$550
- Tax from tax record
- −$122 /mo · $1,465/yr
- Insurance
- −$44
- HOA
- −$0
- Vacancy / Maint / Mgmt
- −$294
- Net cashflow
- $390
Break-even live
UW: 25.0% down · 7.5% · 30yr · 1.5% tax · 5.0% vac · 8.0% maint · 8.0% mgmt
Financing live
Cash to close
- Down payment
- $26,225
- Closing costs
- $3,147
- Reserves months
- —
- Total cash needed
- —
Loan-product check · same deal, 3 products live
Conventional
25% down · 7.5% · 30yr
- Down + closing
- —
- Monthly P&I
- —
- Monthly cashflow
- —
- DSCR
- —
- Eligible?
- —
Personal DTI + credit; lowest rate.
DSCR
20% down · 8.5% · 30yr
- Down + closing
- —
- Monthly P&I
- —
- Monthly cashflow
- —
- DSCR
- —
- Eligible?
- —
No personal income docs; deal must DSCR.
Hard money
10% down · 12.0% · 12mo
- Down + closing
- —
- Monthly P&I
- —
- Monthly cashflow
- —
- DSCR
- —
- Eligible?
- —
Short-term bridge; refi at stabilization.
Rent comps 1 comps
| Address | Beds | Baths | Sqft | Rent | $/sqft | DOM | Units | Dist |
|---|---|---|---|---|---|---|---|---|
| 11900 Duff Rd Lakeview, OH | 3.0 | 2.0 | 1344 | $1,400 | $1.04 | 1d | 1 | 0.69mi |
Listing history 23 events
-
2026-06-18days on market $104,900 Active 37 DOM
-
2026-06-17days on market $104,900 Active 36 DOM
-
2026-06-16days on market $104,900 Active 35 DOM
-
2026-06-15days on market $104,900 Active 34 DOM
-
2026-06-13days on market $104,900 Active 32 DOM
-
2026-06-12days on market $104,900 Active 31 DOM
-
2026-06-09days on market $104,900 Active 28 DOM
-
2026-06-08days on market $104,900 Active 27 DOM
-
2026-06-08days on market $104,900 Active 26 DOM
-
2026-06-07days on market $104,900 Active 25 DOM
-
2026-06-04days on market $104,900 Active 22 DOM
-
2026-06-02days on market $104,900 Active 21 DOM
-
2026-06-01days on market $104,900 Active 20 DOM
-
2026-05-31days on market $104,900 Active 19 DOM
-
2026-05-12$104,900 Active 1159-char remark
-
2018-09-07soldstatus $70,000
-
2018-09-06soldstatus $70,000 296-char remark
Show marketing remark (296 chars)
Occupancy at closing! Come check out this cute 2 bedroom bungalow at Indian Lake. Features include a Nice open floor plan, semi-cover patio area, all new plumbing, manicured landscaping and some new flooring! Call today for a private tour. Ask how this home can be purchased with ZERO money down!
-
2018-07-24$73,900 296-char remark
Show marketing remark (296 chars)
Occupancy at closing! Come check out this cute 2 bedroom bungalow at Indian Lake. Features include a Nice open floor plan, semi-cover patio area, all new plumbing, manicured landscaping and some new flooring! Call today for a private tour. Ask how this home can be purchased with ZERO money down!
-
2017-02-10soldstatus $60,900
Show marketing remark (411 chars)
Larger than it looks 2 bedroom 1 bath 2 story featuring galley style kitchen, great room / dining room combination, spacious bedrooms, first floor bathroom and laundry room and attached 1 car garage with workshop room. Exterior features include low maintenance vinyl siding, additional parking and a fenced courtyard with paver patio. Located close to US 33 for easy access to shopping, dining and entertainment
-
2015-06-10$64,900
Show marketing remark (411 chars)
Larger than it looks 2 bedroom 1 bath 2 story featuring galley style kitchen, great room / dining room combination, spacious bedrooms, first floor bathroom and laundry room and attached 1 car garage with workshop room. Exterior features include low maintenance vinyl siding, additional parking and a fenced courtyard with paver patio. Located close to US 33 for easy access to shopping, dining and entertainment
-
2015-04-15historical
-
2014-10-17$64,900
-
1990-05-30soldstatus $34,200
ⓘ Source: listings_history table (triggers on properties + properties_extension) + one-shot
backfill from property_details.listing_events for pre-trigger history.
Tax reassessment forecast OH · Partial reset (capped growth)
- Current annual tax
- $1,465 · $122/mo
- Projected year-2 tax
- $1,551 · $129/mo
- Expected delta
- +$86/yr (+$7/mo · 5.8%)
ⓘ Screening estimate from a state-policy table — verify with the county assessor before closing.
Climate risk First Street
- Flood 6/10 Major FEMA zone X (unshaded) · 68% chance over 30 yrs
- Wildfire 1/10 Low
- Heat 3/10 Moderate 7 d/yr ≥100°F today · 18 d/yr by 30 yrs out
- Wind 2/10 Low
- Air quality 2/10 Low 1 unhealthy d/yr today · 2 by 30 yrs out
Nearby sold comps map
Loading sold comps map…
Walkable amenities ~0.75 mi
Loading nearby amenities…
Taxation est. · year 1
- Rental income
- $16,800
- − Mortgage interest
- −$5,876
- − Property taxes
- −$1,465
- − Insurance
- −$524
- − Repairs & maintenance
- −$1,344
- − Management
- −$1,344
- − Depreciation
- −$3,052
- Taxable income
- $3,195
- Est. tax owed @ 24.0%
- −$767
- After-tax cash flow
- $3,914/yr
For passive investors: Depreciation is non-cash, so a rental often shows a tax loss while cash-flowing — sheltering income. Rental losses are passive: they offset passive income freely, and up to $25,000/yr can offset ordinary (W-2) income if you actively participate and your MAGI is under $100k (phasing out to $0 by $150k); unused losses carry forward. On sale, claimed depreciation is recaptured at up to 25%, and gains may owe capital-gains tax (a 1031 exchange can defer both). Figures are a year-1 estimate at your 24.0% rate — not tax advice; consult a CPA.
Schools (NCES district)
- District
- Indian Lake Local
- NCES district ID
- 3904808
- Math proficiency
- 59% ▼ -14.00%
- Reading proficiency
- 66% ▼ -4.00%
- Median HH income
- $44,496
- Composite
- 52.6/100
- National rank
- #1559
- State rank
- #261 of 656 in OH
Livability — Lakeview
- Score
- 63/100
- State rank
- #836
- US rank
- #15632
Category grades
Schools grade is shown separately in the Schools card above.
Census & demographics
- Census place
- Lakeview, OH
- County
- Logan · 47,256 people
- Population (ZIP)
- 4,012
- Household income
- $60,159
- Rent vs Own
- Severe rent burden
- 16.1
Population outlook (Logan County) Hauer SSP2
- Today (2025)
- 44,240 people
- By 2030
- 43,166 · -2.4%
- By 2040
- 40,495 · -8.5%
- By 2050
- 37,511 · -15.2%
- By 2075
- 30,453 · -31.2%
- By 2100
- 23,081 · -47.8%
Race, ethnicity, and origin ACS 2023
- Neighborhood character
- Predominantly White (94%)
- Race & ethnicity
- White 94% Hispanic / Latino 4% Two or more races 2% Black 1%
- Common ancestry
- Lithuanian 2% Slovak 2% Iranian 1%
- Foreign-born
- 2% · Canada
- Languages at home
- 96% English-only · Spanish 4%
Political lean MEDSL · Logan
- 2024 margin
- Solid R (+56.2) · D 21.5% · R 77.7%
- 2008→2024 swing
- -29.6pp toward R · 2008: -26.6pp · 2024: -56.2pp
- All cycles
- 2024: R+56.2 2020: R+55.2 2016: R+52.6 2012: R+31.8 2008: R+26.6
Not yet ingested
- Civics
- —
Market trends
- HPI YoY
- ▼ -109.75%
- Current HPI
- 256.2406
- Rent YoY
- —
- Metro
- —
- State GDP YoY
- ▲ 1.98%
- F500 in state
- 48
Industry mix (Fortune 500 HQ in OH)
| Industry | F500 HQs | Revenue |
|---|---|---|
| Insurance | 3 | $145B |
|
||
| Industrial Machinery | 3 | $49B |
|
||
| Financial Services | 3 | $24B |
|
||
| Consumer Goods | 2 | $93B |
|
||
| Aerospace / Defense | 2 | $47B |
|
||
| Utilities | 2 | $33B |
|
||
Price history
+206.7% since first listed9 events — show timeline
- 2026-05-12 Listed $104,900 WRIST
- 2018-09-07 Sold (Public Records) $70,000 Public Records
- 2018-09-06 Sold (MLS) $70,000 WRIST
- 2018-07-24 Listed $73,900 WRIST
- 2017-02-10 Sold (MLS) $60,900 WRIST
- 2015-06-10 Listed $64,900 WRIST
- 2015-04-15 Listing Removed — WRIST
- 2014-10-17 Listed $64,900 WRIST
- 1990-05-30 Sold (Public Records) $34,200 Public Records
Property tax history
+8.9%/yrLatest (2025): $1,465 · +34.9% YoY. Source: county tax records.
Cash-flow waterfall
monthlySold comps — $/sqft
last 12 mo · ≤1 miLoading sold comps…