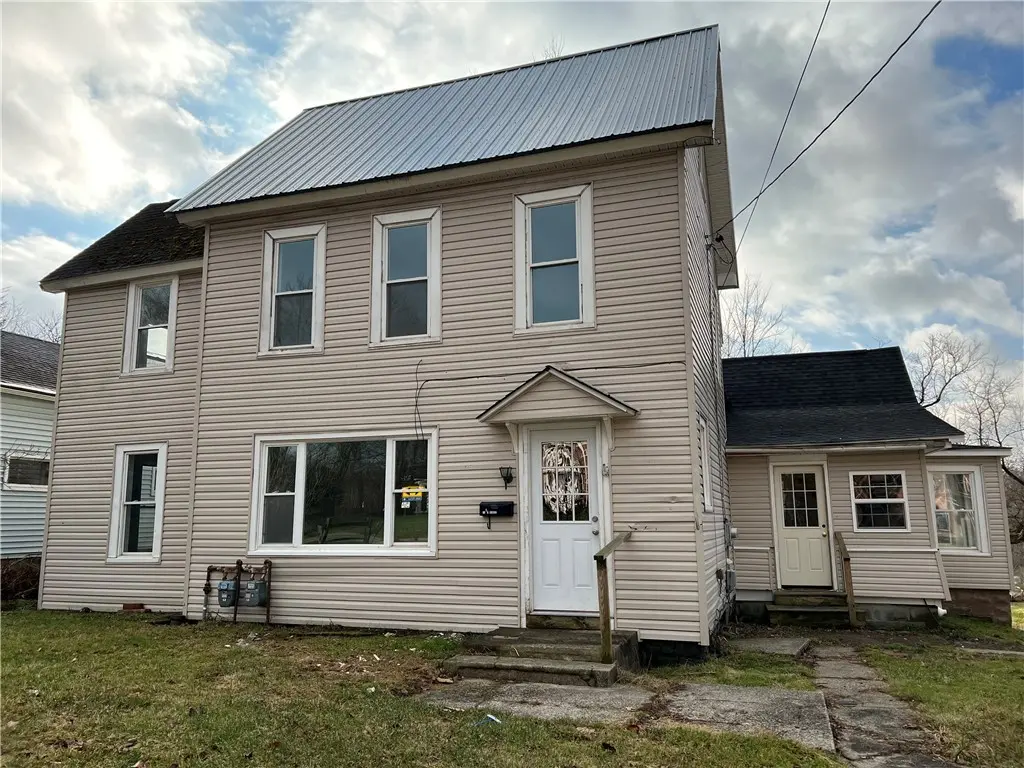
66 Market St · Union City, PA
Flood risk 1/10 · Minimal
- FEMA flood zone
- X (unshaded)
- Chance of flooding over 30 yrs
- 0.0%
- Est. flood insurance / yr
- $473 – $860
Fire risk 1/10 · Minimal
- Est. fire insurance / yr
- $511 – $949
Heat risk 2/10 · Minimal
- Hot days now (above 91°F)
- 7 days/yr
- Hot days in 30 yrs
- 18 days/yr
Wind risk 1/10 · Minimal
- Chance of severe wind over 30 yrs
- —
Air-quality risk 2/10 · Minimal
- Unhealthy air days now
- 1 days/yr
- Unhealthy air days in 30 yrs
- 2 days/yr
Risk factors via First Street. Map © Google.
Why this score? — see what drove the B- grade
The composite is a weighted blend of 9 inputs, each scored 0–100. Each bar is that input's sub-score; the figure is the points it added to the 100-point composite (weight × sub-score).
- Cash flow +30.0/30.0
- 1% rule +10.0/10.0
- DSCR +10.0/10.0
- ARV discount +7.5/15.0
- Schools +3.6/10.0
- Livability +3.6/5.0
- Rent growth +2.5/5.0
- Condition / age +2.5/5.0
- Appreciation +0.0/10.0
$74,900
🖨 Deal sheet 📄 Offer letter ✓ Due diligence
Listing remarks MLS
Excellent investment opportunity! Occupy one unit while renting the other out or enjoy a turnkey investment. Duplex on a large lot, newer windows and roof, hardwood floors. Decent size backyard, deep lot.
Key facts
- Newer roof
- Large lot
- Turnkey investment
Tags
Property features AI
Finance
- Financial info: Annual tax listed
Exterior
- Parking: 4 parking spaces
- Utilities: Public water; Public sewer
- Home design: Duplex residential income property
- Construction: Frame construction with vinyl siding; Composition and metal roofing
- Exterior features: Paved road access; R-2 zoning
Interior
- Kitchen: Range/oven (Unit 1); Range/oven and refrigerator (Unit 2)
- Bedrooms: Unit 1: 2 bedrooms; Unit 2: 3 bedrooms
- Bathrooms: Unit 1: 1 bathroom; Unit 2: 2 bathrooms
- Heating & cooling: Forced air heating; No cooling
- Interior features: Forced air heating
- Laundry & utility: Laundry facilities in Unit 2
Neighborhood map
What this means for you Summary
Snapshot
- This is a 3-bed/2.0-bath single-family listed at $75k.
Deal economics
- At list price, monthly cash flow is $540 ($6k/yr) — positive.
- The deal already cash-flows at list — no discount required.
- Meets the 1% rule at list price ($1k rent vs $75k).
Location & tenants
- Location reads 71/100 on livability (#707 in PA) — a middle-class / working-renter tenant base. Strengths: crime A+, cost of living A+, housing A+; Watch: amenities F, commute F, employment F.
- Union City Area SD (town): math 34% / reading 51% proficiency, ranked #323 of 539 in PA (top 60%) — families likely to look elsewhere, expect single-tenant / working-renter base with shorter leases.
- Market conditions: 41 active listings in the ZIP; 364 units permitted in Erie County in 2024 (188 in 5+ unit buildings).
Forward outlook
- Local home prices are declining (-3.0%/yr); year-one equity from $518 of loan paydown is wiped out by about $2k of value loss. Plan a longer hold.
- Erie County population projected at -14% by 2050 — secular population decline; favor cash flow + early exit over multi-decade hold.
- At projected returns (-3.0% appreciation + 3.0% rent growth), your $21k cash investment doubles in ~4 years — after that, you're playing with house money.
Negotiation context
- Only 10 days on market — expect competitive offers; lowballing is unlikely to land.
- 2 sale attempts since 3y ago with the ask held roughly flat each time — persistent listings suggest the price (not the market) is what's stuck; bring a comps-based counter.
- Current owner paid $64k; 17% above their basis — modest negotiation headroom, anchor on the comps not their cost.
Risks & watch-outs
- Watch-outs: built in 1900 — expect roof / HVAC / electrical / plumbing capex.
Questions for the listing agent
- Built in 1900 — when were the roof, HVAC, electrical panel, plumbing, and water heater last replaced?
- Is there a deadline driving the sale (1031 exchange, divorce, estate, relocation)? That informs how much negotiation room exists.
- What's the average days-on-market for RENTAL listings here right now (not sales)? A rising rental-DOM trend means longer vacancies and softer asking-rent achievability than the comps imply.
- What's the recent tenant-quality profile in this submarket — average credit score on applications, eviction rate, late-payment / NSF rate, and stable-employment percentage? A property-management company in the area should have these aggregated.
- How much new for-sale + rental construction is in the pipeline within 1–3 miles? Heavy new supply typically softens prices + rents 12–24 months out; constrained supply supports both.
Investment metrics
- 1% rule
- 1.72% ✓
- Cap rate
- 14.95%
- Cash-on-cash
- 30.92%
- DSCR
- 2.38
- GRM
- 4.8
CMA / ARV
- ARV (on-the-fly)
- $192,888
- Comps found
- 5
Show comp detail 5 sales within ~0.75 mi
| Address | Dist | Beds/Ba | Sqft | Sold | Price | $/sf | Match |
|---|---|---|---|---|---|---|---|
| 27 2nd Ave | 0.42mi | 3/2.0 | 1,960 (-4%) | 4mo | $198,000 | $101 | 70 |
| 46 Putnam St | 0.12mi | 3/2.0 | 1,859 (-9%) | 12mo | $180,000 | $97 | 69 |
| 41 Warden St | 0.25mi | 2/1.0 (-1) | 1,854 (-10%) | 10mo | $28,000 | $15 | 54 |
| 108 S Main St | 0.64mi | 3/2.0 | 2,257 (+10%) | 5mo | $139,000 | $62 | 50 |
| 133 E High St | 0.44mi | 4/2.5 (+1) | 1,958 (-5%) | 20mo | $185,000 | $94 | 49 |
Match score weights: distance 35% · size 25% · config 20% · recency 20%. Top-matched comps best support the ARV.
Projected returns pro-forma
-3.0% appreciation · 3.0% rent growth · sell at horizon
- IRR
- 25.7%
- Equity multiple
- 2.06×
- Total profit
- $22,274
- Equity at exit
- $11,168
- IRR
- 33.4%
- Equity multiple
- 4.04×
- Total profit
- $63,695
- Equity at exit
- $6,476
Cash invested: $20,972 (down + closing). Projections, not guarantees.
Landlord ↔ Tenant lean methodology
- Overall (STATE)
- 62 Landlord-Friendly
- State Pennsylvania
- 62 Landlord-Friendly · EVEN
- County
- — inherits STATE
- City
- — inherits STATE
ZIP-level market 16438
- Home prices YoY
- -9.8%
- Active inventory
- 41
- Price-to-rent
- 4.8×
Monthly cashflow live
- Estimated rent
- $1,291 medium interval (Pro) →
- Mortgage (P&I)
- −$393
- Tax from tax record
- −$56 /mo · $669/yr
- Insurance
- −$31
- HOA
- −$0
- Vacancy / Maint / Mgmt
- −$271
- Net cashflow
- $540
Break-even live
UW: 25.0% down · 7.5% · 30yr · 1.5% tax · 5.0% vac · 8.0% maint · 8.0% mgmt
Financing live
Cash to close
- Down payment
- $18,725
- Closing costs
- $2,247
- Reserves months
- —
- Total cash needed
- —
Loan-product check · same deal, 3 products live
Conventional
25% down · 7.5% · 30yr
- Down + closing
- —
- Monthly P&I
- —
- Monthly cashflow
- —
- DSCR
- —
- Eligible?
- —
Personal DTI + credit; lowest rate.
DSCR
20% down · 8.5% · 30yr
- Down + closing
- —
- Monthly P&I
- —
- Monthly cashflow
- —
- DSCR
- —
- Eligible?
- —
No personal income docs; deal must DSCR.
Hard money
10% down · 12.0% · 12mo
- Down + closing
- —
- Monthly P&I
- —
- Monthly cashflow
- —
- DSCR
- —
- Eligible?
- —
Short-term bridge; refi at stabilization.
Listing history 10 events
-
2026-06-18days on market $74,900 Active 10 DOM
-
2026-06-17days on market $74,900 Active 9 DOM
-
2026-06-16days on market $74,900 Active 8 DOM
-
2026-06-16remarks 210-char remark
-
2026-06-15days on market $74,900 Active 7 DOM
-
2026-06-13remarks 207-char remark
-
2026-06-13days on market $74,900 Active 5 DOM
-
2026-06-12days on market $74,900 Active 4 DOM
-
2026-06-09remarks 204-char remark
-
2026-06-09$74,900 Active 1 DOM
ⓘ Source: listings_history table (triggers on properties + properties_extension) + one-shot
backfill from property_details.listing_events for pre-trigger history.
Tax reassessment forecast PA · Partial reset (capped growth)
- Current annual tax
- $669 · $56/mo
- Projected year-2 tax
- $926 · $77/mo
- Expected delta
- +$257/yr (+$21/mo · 38.5%)
ⓘ Screening estimate from a state-policy table — verify with the county assessor before closing.
Climate risk First Street
- Flood 1/10 Low FEMA zone X (unshaded) · 0% chance over 30 yrs
- Wildfire 1/10 Low
- Heat 2/10 Low 7 d/yr ≥91°F today · 18 d/yr by 30 yrs out
- Wind 1/10 Low
- Air quality 2/10 Low 1 unhealthy d/yr today · 2 by 30 yrs out
Nearby sold comps map
Loading sold comps map…
Walkable amenities ~0.75 mi
Loading nearby amenities…
Taxation est. · year 1
- Rental income
- $15,494
- − Mortgage interest
- −$4,196
- − Property taxes
- −$669
- − Insurance
- −$374
- − Repairs & maintenance
- −$1,240
- − Management
- −$1,240
- − Depreciation
- −$2,179
- Taxable income
- $5,598
- Est. tax owed @ 24.0%
- −$1,343
- After-tax cash flow
- $5,141/yr
For passive investors: Depreciation is non-cash, so a rental often shows a tax loss while cash-flowing — sheltering income. Rental losses are passive: they offset passive income freely, and up to $25,000/yr can offset ordinary (W-2) income if you actively participate and your MAGI is under $100k (phasing out to $0 by $150k); unused losses carry forward. On sale, claimed depreciation is recaptured at up to 25%, and gains may owe capital-gains tax (a 1031 exchange can defer both). Figures are a year-1 estimate at your 24.0% rate — not tax advice; consult a CPA.
Schools (NCES district)
- District
- Union City Area SD
- NCES district ID
- 4224090
- Math proficiency
- 34% ▼ -10.00%
- Reading proficiency
- 51% ▼ -9.00%
- Median HH income
- $44,275
- Composite
- 35.96/100
- National rank
- #4797
- State rank
- #323 of 539 in PA
Livability — Union City
- Score
- 71/100
- State rank
- #707
- US rank
- #6992
Category grades
Schools grade is shown separately in the Schools card above.
Census & demographics
- Census place
- Union City, PA
- City population
- 7,489
- Population (ZIP)
- 7,489
Population outlook (Erie County) Hauer SSP2
- Today (2025)
- 272,159 people
- By 2030
- 266,299 · -2.2%
- By 2040
- 250,987 · -7.8%
- By 2050
- 234,925 · -13.7%
- By 2075
- 199,164 · -26.8%
- By 2100
- 162,985 · -40.1%
Race, ethnicity, and origin ACS 2023
- Neighborhood character
- Predominantly White (92%)
- Race & ethnicity
- White 92% Two or more races 5% Hispanic / Latino 4%
- Common ancestry
- Romanian 7% Slovak 3% Iranian 2%
- Foreign-born
- 1% · Canada
- Languages at home
- 98% English-only · Spanish 1% German/W. Germanic 1%
Political lean MEDSL · Erie
- 2024 margin
- Toss-up / Even · D 49.0% · R 50.0%
- 2008→2024 swing
- -20.9pp toward R · 2008: 19.9pp · 2024: -1.0pp
- All cycles
- 2024: R+1.0 2020: D+1.0 2016: R+2.0 2012: D+16.9 2008: D+19.9
Not yet ingested
- Civics
- —
Market trends
- HPI YoY
- ▼ -23.30%
- Current HPI
- 215.3389
- Rent YoY
- —
- Metro
- —
- State GDP YoY
- ▲ 1.68%
- F500 in state
- 34
Industry mix (Fortune 500 HQ in PA)
| Industry | F500 HQs | Revenue |
|---|---|---|
| Healthcare | 2 | $309B |
|
||
| Insurance | 2 | $27B |
|
||
| Telecommunications / Media | 1 | $124B |
|
||
| Industrial Distribution | 1 | $22B |
|
||
| Financial Services | 1 | $20B |
|
||
| Chemicals / Materials | 1 | $18B |
|
||
Price history
+149.7% since first listed8 events — show timeline
- 2026-06-08 Listed $74,900 GEBOR
- 2023-03-28 Sold (Public Records) $64,000 Public Records
- 2023-03-27 Sold (MLS) $64,000 GEBOR
- 2023-02-28 Pending — GEBOR
- 2023-02-26 Price Changed $64,900 GEBOR
- 2023-01-25 Price Changed $69,900 GEBOR
- 2023-01-06 Listed $74,900 GEBOR
- 1992-12-30 Sold (Public Records) $30,000 Public Records
Property tax history
-1.0%/yrLatest (2026): $669 · -29.8% YoY. Source: county tax records.
Cash-flow waterfall
monthlySold comps — $/sqft
last 12 mo · ≤1 miLoading sold comps…