5100 N Highway 99 #17 · Morada, CA
Flood risk 1/10 · Minimal
- FEMA flood zone
- X
- Chance of flooding over 30 yrs
- 0.0%
- Est. flood insurance / yr
- $507 – $1,088
Fire risk 6/10 · Moderate
- Est. fire insurance / yr
- $659 – $1,223
Heat risk 7/10 · Major
- Hot days now (above 102°F)
- 7 days/yr
- Hot days in 30 yrs
- 15 days/yr
Wind risk 1/10 · Minimal
- Chance of severe wind over 30 yrs
- —
Air-quality risk 10/10 · Severe
- Unhealthy air days now
- 27 days/yr
- Unhealthy air days in 30 yrs
- 29 days/yr
Risk factors via First Street. Map © Google.
Why this score? — see what drove the C+ grade
The composite is a weighted blend of 9 inputs, each scored 0–100. Each bar is that input's sub-score; the figure is the points it added to the 100-point composite (weight × sub-score).
- Cash flow +30.0/30.0
- 1% rule +10.0/10.0
- DSCR +10.0/10.0
- Livability +3.0/5.0
- Condition / age +2.8/5.0
- ARV discount +2.7/15.0
- Schools +2.7/10.0
- Rent growth +2.5/5.0
- Appreciation +0.0/10.0
$125,900
🖨 Deal sheet 📄 Offer letter ✓ Due diligence
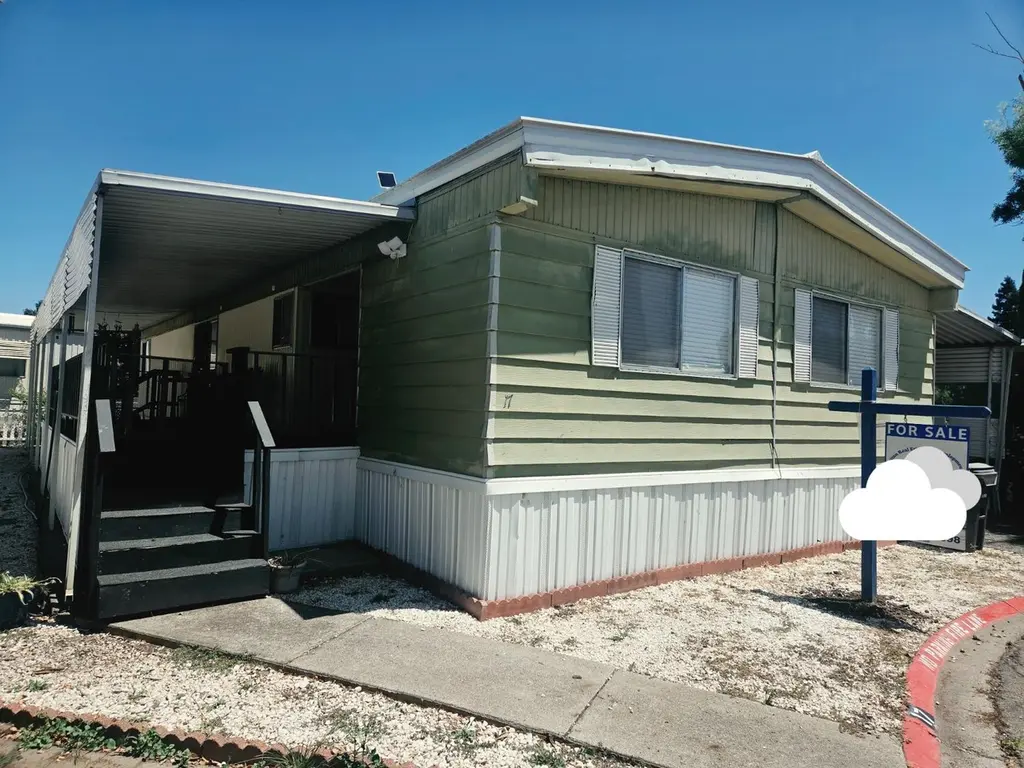
Listing remarks
Welcome to your new home! Located in the sought after Shadow Lake Park! ALL AGE PARK! Features a newer ROOF! Newer CENTRAL HEAT & AIR CONDITIONING! It's tastefully upgraded in the kitchen and has a BEAUTIFUL WALK-IN MASTER SHOWER! It's an affordable home when most of the market is difficult to afford. Perfect for downsizing but still has great SQFT at 1,440! HUGE front room for family gatherings, holidays, etc! It's located on a LARGE LOT. The lot size makes it feel like a residential lot! Plenty of parking, garden, or whatever you envision! Comes with a storage shed that will be staying! The park has a laundry room, 2 pools, and a duck pond. Large covered back porch perfect for enjo
Key facts
- Newer roof
- Laundry room
- Upgraded kitchen
Tags
Property features AI
Finance
- HOA & community: No homeowners association; Not a senior community; Land lease: No (listed land lease amount present but property marked No)
Exterior
- Parking: Off-street parking; Attached parking
- Utilities: Natural gas connected; Public water; Public sewer; 220 volts available in laundry
- Home design: Manufactured home located in a park; Double wide; Built in 1976
- Construction: Aluminum skirting; Composition roof
- Exterior features: Front yard
Interior
- Kitchen: Free standing gas range; Free standing gas oven; Hood over range; Dishwasher; Microwave; Kitchen/Family combo and formal dining area
- Bedrooms: 2 bedrooms (including master bedroom)
- Flooring: Carpet; Tile; Linoleum
- Bathrooms: 2 full bathrooms with tile and shower stall(s)
- Heating & cooling: Central heating; Central air conditioning
- Interior features: Great room living area; Island and stone countertops in the kitchen; Storage area
- Laundry & utility: Indoor laundry room with hookups; 220V outlet in laundry
Neighborhood map
What this means for you Summary
Snapshot
- This is a 2-bed/2.0-bath manufactured listed at $126k. Condition is rated average.
Deal economics
- At list price, monthly cash flow is $2k ($20k/yr) — positive.
- The deal already cash-flows at list — no discount required.
- Meets the 1% rule at list price ($3k rent vs $126k).
- Cap rate 22.1% vs local median 2.7% in Morada — top-decile yield for the area; either an underpriced asset or a hidden risk that comps aren't pricing in. Stress-test before assuming the spread holds.
Location & tenants
- Location reads 60/100 on livability (#596 in CA) — a middle-class / working-renter tenant base. Strengths: crime A+, employment A+, housing A+; Watch: amenities F, commute F, cost of living F.
- Lodi Unified (urban): math 24% / reading 36% proficiency, ranked #325 of 517 in CA (top 63%) — families likely to look elsewhere, expect single-tenant / working-renter base with shorter leases.
- Market conditions: 160 active listings in the ZIP; 7 comparable units currently listed for rent nearby; rentals at typical pace (median 14d on market — plan ~3-4 weeks tenant-placement turnaround); high-income renter base; 3,779 units permitted in San Joaquin County in 2024 (0 in 5+ unit buildings).
- This rent runs 34% of the median local income ($112k/yr) — at the standard rent-burdened threshold; future hikes will face affordability resistance.
Forward outlook
- Local home prices are declining (-3.0%/yr); year-one equity from $870 of loan paydown is wiped out by about $4k of value loss. Plan a longer hold.
- San Joaquin County population projected at +17% by 2050 — long-run rental-demand tailwind backs the buy-and-hold thesis.
- At projected returns (-3.0% appreciation + 3.0% rent growth), your $35k cash investment doubles in ~3 years — after that, you're playing with house money.
Negotiation context
- Only 9 days on market — expect competitive offers; lowballing is unlikely to land.
Risks & watch-outs
- Climate carrying-cost: major wildfire risk; extreme-heat days projected 7→15/yr by 2055 (HVAC capex compounding) — expect insurance premiums to compound above CPI over the hold.
Questions for the listing agent
- Built in 1976 — when were the roof, HVAC, electrical panel, plumbing, and water heater last replaced?
- Is there a deadline driving the sale (1031 exchange, divorce, estate, relocation)? That informs how much negotiation room exists.
- What's the average days-on-market for RENTAL listings here right now (not sales)? A rising rental-DOM trend means longer vacancies and softer asking-rent achievability than the comps imply.
- What's the recent tenant-quality profile in this submarket — average credit score on applications, eviction rate, late-payment / NSF rate, and stable-employment percentage? A property-management company in the area should have these aggregated.
- How much new for-sale + rental construction is in the pipeline within 1–3 miles? Heavy new supply typically softens prices + rents 12–24 months out; constrained supply supports both.
Investment metrics
- 1% rule
- 2.54% ✓
- Cap rate
- 22.05%
- Cash-on-cash
- 56.28%
- DSCR
- 3.50
- GRM
- 3.3
CMA / ARV
- ARV (on-the-fly)
- $113,760
- Comps found
- 12
Show comp detail 12 sales within ~0.75 mi
| Address | Dist | Beds/Ba | Sqft | Sold | Price | $/sf | Match |
|---|---|---|---|---|---|---|---|
| 5100 N Hwy 99 #159 | 0.00mi | 3/2.0 (+1) | 1,440 (0%) | 2mo | $100,000 | $69 | 94 |
| 4900 N Hwy 99 #65 | 0.00mi | 3/2.0 (+1) | 1,440 (0%) | 8mo | $94,000 | $65 | 88 |
| 4900 N Highway 99 #185 | 0.00mi | 2/2.0 | 1,440 (0%) | 16mo | $55,000 | $38 | 87 |
| 5100 N Highway 99 #194 | 0.00mi | 3/2.0 (+1) | 1,344 (-7%) | 3mo | $129,900 | $97 | 82 |
| 5100 N Highway 99 #172 | 0.00mi | 3/2.0 (+1) | 1,440 (0%) | 18mo | $50,000 | $35 | 80 |
| 5100 N Highway 99 #8 | 0.01mi | 3/2.0 (+1) | 1,560 (+8%) | 8mo | $130,000 | $83 | 74 |
| 4900 N Highway 99 #197 | 0.00mi | 2/3.0 | 1,536 (+7%) | 14mo | $145,000 | $94 | 73 |
| 5100 N Hwy 99 #182 | 0.00mi | 3/2.0 (+1) | 1,560 (+8%) | 10mo | $164,000 | $105 | 73 |
| 9454 N Highway 99 #20 | 0.06mi | 2/2.0 | 1,296 (-10%) | 13mo | $80,000 | $62 | 70 |
| 4900 Hwy 99 #199 | 0.01mi | 2/2.0 | 1,600 (+11%) | 19mo | $118,000 | $74 | 65 |
| 5100 N Highway 99 #103 | 0.00mi | 3/2.0 (+1) | 1,584 (+10%) | 17mo | $125,000 | $79 | 64 |
| 5100 N Highway 99 #202 | 0.00mi | 3/2.0 (+1) | 1,625 (+13%) | 12mo | $160,000 | $98 | 63 |
Match score weights: distance 35% · size 25% · config 20% · recency 20%. Top-matched comps best support the ARV.
Projected returns pro-forma
-3.0% appreciation · 3.0% rent growth · sell at horizon
- IRR
- 54.7%
- Equity multiple
- 3.41×
- Total profit
- $84,955
- Equity at exit
- $18,772
- IRR
- 59.8%
- Equity multiple
- 6.95×
- Total profit
- $209,775
- Equity at exit
- $10,886
Cash invested: $35,252 (down + closing). Projections, not guarantees.
Landlord ↔ Tenant lean methodology
- Overall (STATE)
- 18 Strongly Tenant-Friendly
- State California
- 18 Strongly Tenant-Friendly · D+13
- County
- — inherits STATE
- City
- — inherits STATE
ZIP-level market 95212
- Active inventory
- 160
- Price-to-rent
- 3.3×
Monthly cashflow live
- Estimated rent
- $3,194 high interval (Pro) →
- Mortgage (P&I)
- −$660
- Tax est. 1.5%
- −$157 /mo · $1,888/yr
- Insurance
- −$52
- HOA
- −$0
- Vacancy / Maint / Mgmt
- −$671
- Net cashflow
- $1,653
Break-even live
UW: 25.0% down · 7.5% · 30yr · 1.5% tax · 5.0% vac · 8.0% maint · 8.0% mgmt
Financing live
Cash to close
- Down payment
- $31,475
- Closing costs
- $3,777
- Reserves months
- —
- Total cash needed
- —
Loan-product check · same deal, 3 products live
Conventional
25% down · 7.5% · 30yr
- Down + closing
- —
- Monthly P&I
- —
- Monthly cashflow
- —
- DSCR
- —
- Eligible?
- —
Personal DTI + credit; lowest rate.
DSCR
20% down · 8.5% · 30yr
- Down + closing
- —
- Monthly P&I
- —
- Monthly cashflow
- —
- DSCR
- —
- Eligible?
- —
No personal income docs; deal must DSCR.
Hard money
10% down · 12.0% · 12mo
- Down + closing
- —
- Monthly P&I
- —
- Monthly cashflow
- —
- DSCR
- —
- Eligible?
- —
Short-term bridge; refi at stabilization.
Rent comps 7 comps
| Address | Beds | Baths | Sqft | Rent | $/sqft | DOM | Units | Dist |
|---|---|---|---|---|---|---|---|---|
| 3461 Sina Ct Stockton, CA | 3.0 | 2.0 | 1335 | $3,000 | $2.25 | 43d | 1 | 0.80mi |
| 4006 Angelina Ln Stockton, CA | 3.0 | 2.5 | 1775 | $2,750 | $1.55 | 2d | 1 | 0.86mi |
| 10424 Skynyrd Way Stockton, CA | 3.0 | 2.0 | 1509 | $4,500 | $2.98 | 23d | 1 | 0.93mi |
| 10400 Skynyrd Way Stockton, CA | 3.0 | 2.0 | 1342 | $4,500 | $3.35 | 14d | 1 | 0.94mi |
| 4142 E Morada Ln Stockton, CA | 2.0 | 2.0 | 1063 | $2,314 | $2.18 | 21d | 1 | 1.34mi |
| 4030 E Morada Ln Stockton, CA | 2.0 | 1.0–2.0 | 811 | $2,340 | $2.88 | 2d | 26 | 1.39mi |
| 9326 Lembert Dome Cir Stockton, CA | 3.0 | 2.0 | 1490 | $2,645 | $1.78 | 2d | 1 | 1.43mi |
Listing history 7 events
-
2026-06-18days on market $125,900 Active 9 DOM
-
2026-06-17days on market $125,900 Active 8 DOM
-
2026-06-16days on market $125,900 Active 7 DOM
-
2026-06-15days on market $125,900 Active 6 DOM
-
2026-06-14days on market $125,900 Active 4 DOM
-
2026-06-10remarks 695-char remark
-
2026-06-10$125,900 Active 1 DOM
ⓘ Source: listings_history table (triggers on properties + properties_extension) + one-shot
backfill from property_details.listing_events for pre-trigger history.
Climate risk First Street
- Flood 1/10 Low FEMA zone X · 0% chance over 30 yrs
- Wildfire 6/10 Major
- Heat 7/10 Severe 7 d/yr ≥102°F today · 15 d/yr by 30 yrs out
- Wind 1/10 Low
- Air quality 10/10 Extreme 27 unhealthy d/yr today · 29 by 30 yrs out
Nearby sold comps map
Loading sold comps map…
Walkable amenities ~0.75 mi
Loading nearby amenities…
Taxation est. · year 1
- Rental income
- $38,332
- − Mortgage interest
- −$7,052
- − Property taxes
- −$1,888
- − Insurance
- −$630
- − Repairs & maintenance
- −$3,067
- − Management
- −$3,067
- − Depreciation
- −$3,663
- Taxable income
- $18,966
- Est. tax owed @ 24.0%
- −$4,552
- After-tax cash flow
- $15,289/yr
For passive investors: Depreciation is non-cash, so a rental often shows a tax loss while cash-flowing — sheltering income. Rental losses are passive: they offset passive income freely, and up to $25,000/yr can offset ordinary (W-2) income if you actively participate and your MAGI is under $100k (phasing out to $0 by $150k); unused losses carry forward. On sale, claimed depreciation is recaptured at up to 25%, and gains may owe capital-gains tax (a 1031 exchange can defer both). Figures are a year-1 estimate at your 24.0% rate — not tax advice; consult a CPA.
Condition & rehab AI · 1 photo
This manufactured home is in average condition with some cosmetic updates needed, particularly to the exterior siding. It has a newer roof and HVAC system, making it a good investment opportunity.
Repairs flagged
- Minor Exterior siding — Weathered appearance
Value-add opportunities
- Both Paint exterior siding — Improves curb appeal and resale value
- Both Landscaping — Enhances curb appeal and rental value
Renovation cost estimate screening
| Repair item | Severity | Est. cost |
|---|---|---|
| Exterior siding · Weathered appearance | Minor | $500–3,000 |
| Total estimated repair cost · 1 items | $500–3,000 |
Value-add ROI direction
- Both Paint exterior siding — Improves curb appeal and resale value ↑
- Both Landscaping — Enhances curb appeal and rental value ↑
ⓘ Cost ranges are severity-bucket heuristics (US national rule-of-thumb). Get contractor quotes + a written scope before underwriting a rehab budget.
Schools (NCES district)
- District
- Lodi Unified
- NCES district ID
- 0622230
- Math proficiency
- 24% ▼ -8.00%
- Reading proficiency
- 36% ▼ -8.00%
- Median HH income
- $57,165
- Composite
- 26.84/100
- National rank
- #7108
- State rank
- #325 of 517 in CA
Livability — Morada
- Score
- 60/100
- State rank
- #596
- US rank
- #19273
Category grades
Schools grade is shown separately in the Schools card above.
Census & demographics
- Census place
- Morada, CA
- County
- San Joaquin County · 729,570 people
- Metro
- Stockton, CA
- Population (ZIP)
- 28,437
- Household income
- $111,720
- Rent vs Own
- Severe rent burden
- 414.0
Population outlook (San Joaquin County) Hauer SSP2
- Today (2025)
- 796,965 people
- By 2030
- 828,849 · +4.0%
- By 2040
- 885,611 · +11.1%
- By 2050
- 929,798 · +16.7%
- By 2075
- 994,578 · +24.8%
- By 2100
- 971,291 · +21.9%
Race, ethnicity, and origin ACS 2023
- Neighborhood character
- Highly diverse neighborhood (Simpson 0.70)
- Race & ethnicity
- Asian 43% Hispanic / Latino 24% White 22% Two or more races 12% Black 6% Native American 2%
- Hispanic origin (detail)
- Mexican 21%
- Common ancestry
- Italian 2% Slovak 2% Romanian 1%
- Foreign-born
- 31% · Canada, Vietnam, China
- Languages at home
- 49% English-only · Spanish 18% Other Asian/Pacific 10% Tagalog/Filipino 9%
Political lean MEDSL · San Joaquin
- 2024 margin
- Toss-up / Even · D 48.0% · R 48.9% · Other 3.0%
- 2008→2024 swing
- -11.6pp toward R · 2008: 10.7pp · 2024: -0.9pp
- All cycles
- 2024: R+0.9 2020: D+13.9 2016: D+12.9 2012: D+8.9 2008: D+10.7
Not yet ingested
- Civics
- —
Market trends
- HPI YoY
- ▼ -188.93%
- Current HPI
- 265.3844
- Rent YoY
- —
- Metro
- Stockton, CA
- State GDP YoY
- ▲ 3.21%
- F500 in state
- 116
Industry mix (Fortune 500 HQ in CA)
| Industry | F500 HQs | Revenue |
|---|---|---|
| Technology | 27 | $1,492B |
|
||
| Financial Services | 3 | $174B |
|
||
| Retail | 3 | $44B |
|
||
| Insurance | 3 | $26B |
|
||
| Media / Entertainment | 2 | $115B |
|
||
| Pharmaceuticals / Biotech | 2 | $62B |
|
||
Cash-flow waterfall
monthlySold comps — $/sqft
last 12 mo · ≤1 miLoading sold comps…