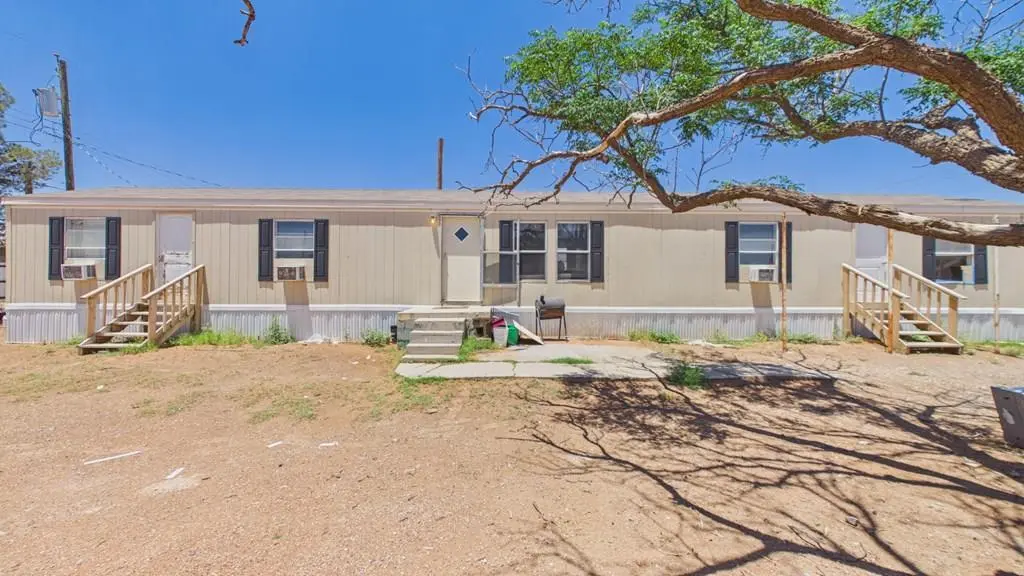
412 N Wildcat Ave · Wink, TX
Flood risk 1/10 · Minimal
- FEMA flood zone
- —
- Chance of flooding over 30 yrs
- 0.0%
- Est. flood insurance / yr
- —
Fire risk 10/10 · Severe
- Est. fire insurance / yr
- $1,222 – $2,270
Heat risk 6/10 · Moderate
- Hot days now (above 103°F)
- 6 days/yr
- Hot days in 30 yrs
- 19 days/yr
Wind risk 2/10 · Minimal
- Chance of severe wind over 30 yrs
- 2.0%
Air-quality risk 1/10 · Minimal
- Unhealthy air days now
- 0 days/yr
- Unhealthy air days in 30 yrs
- 0 days/yr
Risk factors via First Street. Map © Google.
Why this score? — see what drove the C- grade
The composite is a weighted blend of 9 inputs, each scored 0–100. Each bar is that input's sub-score; the figure is the points it added to the 100-point composite (weight × sub-score).
- Cash flow +17.3/30.0
- ARV discount +7.5/15.0
- DSCR +5.4/10.0
- Appreciation +5.0/10.0
- 1% rule +4.7/10.0
- Schools +4.1/10.0
- Livability +3.9/5.0
- Rent growth +2.5/5.0
- Condition / age +2.5/5.0
$130,000
🖨 Deal sheet 📄 Offer letter ✓ Due diligence
Listing remarks
Conveniently located directly across from the school, this 4-bedroom, 4-bathroom mobile home offers comfort, functionality, and incredible potential. This property is ideal as a starter home or investment opportunity. Whether you're looking to expand your rental portfolio or purchase an affordable home with great location benefit- call me! Get your personal tour scheduled.
Key facts
- Affordable home
- 5,183 sq ft lot
- Built 1980
Tags
Property features AI
Exterior
- Security: Smoke detector(s)
- Utilities: Public water; Public sewer; Propane available
- Home design: Residential mobile home (single wide)
- Construction: Vinyl siding; Composition roof; Other foundation
- Exterior features: Chain link fence; Paved road access; Solar panels
Interior
- Kitchen: Electric range; Dishwasher; Refrigerator
- Flooring: Vinyl flooring
- Bathrooms: 4 full bathrooms
- Heating & cooling: Central heating (electric); Window cooling units
- Interior features: Electric water heater; Smoke detector(s); No fireplace
- Laundry & utility: No laundry hookups inside
Neighborhood map
What this means for you Summary
Snapshot
- This is a 4-bed/4.0-bath manufactured listed at $130k.
Deal economics
- At list price, monthly cash flow is $96 ($1k/yr) — positive.
- The deal already cash-flows at list — no discount required.
- To meet the 1% rule (rent ≥ 1% of price), the offer needs to be $126k (3.2% below list).
- Recommended offer: $126k (3.2% below list) — sets the bar for 1% rule.
Location & tenants
- Location reads 78/100 on livability (#77 in TX, #2,717 nationally) — a middle-class / working-renter tenant base. Strengths: crime A+, employment A+, cost of living A+; Watch: health & safety C-, amenities F, commute F.
- Wink-Loving ISD (rural): math 52% / reading 43% proficiency, ranked #200 of 826 in TX (top 24%) — families likely to look elsewhere, expect single-tenant / working-renter base with shorter leases.
- Zoned schools: Wink El (math 57% / reading 47%, grade C-, #742 of 4,322 statewide, top 19%, 219 students, 44% FRL); Wink H S (math 47% / reading 37%, grade F, #730 of 1,632 statewide, top 47%, 212 students, 31% FRL) — zoned schools at 37% FRL track the district average.
- Market conditions: 2 active listings in the ZIP.
Forward outlook
- In year one you build about $5k of equity ($899 loan paydown + $4k appreciation (3.0% local appreciation)).
- Winkler County population projected at +67% by 2050 — long-run rental-demand tailwind backs the buy-and-hold thesis.
- At projected returns (3.0% appreciation + 3.0% rent growth), your $36k cash investment doubles in ~6 years — after that, you're playing with house money.
- By year 7, paydown + projected appreciation supports a ~$30k cash-out refi (75% LTV) — recoverable capital for the next deal without selling this one.
Negotiation context
- It's been on market 15 days — a 2% lower offer ($128k) is reasonable based on typical stale-listing flexibility.
Risks & watch-outs
- Climate carrying-cost: severe wildfire risk; extreme-heat days projected 6→19/yr by 2055 (HVAC capex compounding) — expect insurance premiums to compound above CPI over the hold.
Questions for the listing agent
- Is there a deadline driving the sale (1031 exchange, divorce, estate, relocation)? That informs how much negotiation room exists.
- Schools are D-rated, which usually means shorter tenancies and higher turnover. Who's the typical renter profile here, and what's been the actual vacancy rate?
- What's the average days-on-market for RENTAL listings here right now (not sales)? A rising rental-DOM trend means longer vacancies and softer asking-rent achievability than the comps imply.
- What's the recent tenant-quality profile in this submarket — average credit score on applications, eviction rate, late-payment / NSF rate, and stable-employment percentage? A property-management company in the area should have these aggregated.
- How much new for-sale + rental construction is in the pipeline within 1–3 miles? Heavy new supply typically softens prices + rents 12–24 months out; constrained supply supports both.
Investment metrics
- 1% rule
- 0.97% ✗
- Cap rate
- 7.18%
- Cash-on-cash
- 3.16%
- DSCR
- 1.14
- GRM
- 8.6
CMA / ARV
No comps found within radius.
Projected returns pro-forma
3.0% appreciation · 3.0% rent growth · sell at horizon
- IRR
- 10.5%
- Equity multiple
- 1.60×
- Total profit
- $21,790
- Equity at exit
- $58,454
- IRR
- 12.7%
- Equity multiple
- 2.90×
- Total profit
- $69,053
- Equity at exit
- $90,084
Cash invested: $36,400 (down + closing). Projections, not guarantees.
Landlord ↔ Tenant lean methodology
- Overall (STATE)
- 87 Strongly Landlord-Friendly
- State Texas
- 87 Strongly Landlord-Friendly · R+5
- County
- — inherits STATE
- City
- — inherits STATE
ZIP-level market 79789
- Active inventory
- 2
- Price-to-rent
- 8.6×
Monthly cashflow live
- Estimated rent
- $1,259 medium interval (Pro) →
- Mortgage (P&I)
- −$682
- Tax est. 1.5%
- −$162 /mo · $1,950/yr
- Insurance
- −$54
- HOA
- −$0
- Vacancy / Maint / Mgmt
- −$264
- Net cashflow
- $96
Break-even live
UW: 25.0% down · 7.5% · 30yr · 1.5% tax · 5.0% vac · 8.0% maint · 8.0% mgmt
Financing live
Cash to close
- Down payment
- $32,500
- Closing costs
- $3,900
- Reserves months
- —
- Total cash needed
- —
Loan-product check · same deal, 3 products live
Conventional
25% down · 7.5% · 30yr
- Down + closing
- —
- Monthly P&I
- —
- Monthly cashflow
- —
- DSCR
- —
- Eligible?
- —
Personal DTI + credit; lowest rate.
DSCR
20% down · 8.5% · 30yr
- Down + closing
- —
- Monthly P&I
- —
- Monthly cashflow
- —
- DSCR
- —
- Eligible?
- —
No personal income docs; deal must DSCR.
Hard money
10% down · 12.0% · 12mo
- Down + closing
- —
- Monthly P&I
- —
- Monthly cashflow
- —
- DSCR
- —
- Eligible?
- —
Short-term bridge; refi at stabilization.
Listing history 12 events
-
2026-06-18days on market $130,000 Active 15 DOM
-
2026-06-17days on market $130,000 Active 14 DOM
-
2026-06-16days on market $130,000 Active 13 DOM
-
2026-06-15days on market $130,000 Active 12 DOM
-
2026-06-15days on market $130,000 Active 11 DOM
-
2026-06-13days on market $130,000 Active 10 DOM
-
2026-06-12days on market $130,000 Active 9 DOM
-
2026-06-09days on market $130,000 Active 6 DOM
-
2026-06-08days on market $130,000 Active 5 DOM
-
2026-06-08days on market $130,000 Active 4 DOM
-
2026-06-05remarks 375-char remark
-
2026-06-05$130,000 Active 2 DOM
ⓘ Source: listings_history table (triggers on properties + properties_extension) + one-shot
backfill from property_details.listing_events for pre-trigger history.
Climate risk First Street
- Flood 1/10 Low 0% chance over 30 yrs
- Wildfire 10/10 Extreme
- Heat 6/10 Major 6 d/yr ≥103°F today · 19 d/yr by 30 yrs out
- Wind 2/10 Low 2% chance of damaging wind over 30 yrs
- Air quality 1/10 Low 0 unhealthy d/yr today · 0 by 30 yrs out
Nearby sold comps map
Loading sold comps map…
Walkable amenities ~0.75 mi
Loading nearby amenities…
Taxation est. · year 1
- Rental income
- $15,104
- − Mortgage interest
- −$7,282
- − Property taxes
- −$1,950
- − Insurance
- −$650
- − Repairs & maintenance
- −$1,208
- − Management
- −$1,208
- − Depreciation
- −$3,782
- Taxable loss
- −$977
- Est. tax savings @ 24.0%
- +$234
- After-tax cash flow
- $1,386/yr
For passive investors: Depreciation is non-cash, so a rental often shows a tax loss while cash-flowing — sheltering income. Rental losses are passive: they offset passive income freely, and up to $25,000/yr can offset ordinary (W-2) income if you actively participate and your MAGI is under $100k (phasing out to $0 by $150k); unused losses carry forward. On sale, claimed depreciation is recaptured at up to 25%, and gains may owe capital-gains tax (a 1031 exchange can defer both). Figures are a year-1 estimate at your 24.0% rate — not tax advice; consult a CPA.
Schools (NCES district)
- District
- Wink-Loving ISD
- NCES district ID
- 4846170
- Math proficiency
- 52% ▲ 10.00%
- Reading proficiency
- 43% ▬ 0.00%
- Median HH income
- $57,060
- Composite
- 41.43/100
- National rank
- #3472
- State rank
- #200 of 826 in TX
Livability — Wink
- Score
- 78/100
- State rank
- #77
- US rank
- #2717
Category grades
Schools grade is shown separately in the Schools card above.
Census & demographics
- Census place
- Wink, TX
- Population (ZIP)
- 1,380
Population outlook (Winkler County) Hauer SSP2
- Today (2025)
- 10,019 people
- By 2030
- 11,177 · +11.6%
- By 2040
- 13,746 · +37.2%
- By 2050
- 16,734 · +67.0%
- By 2075
- 24,573 · +145.3%
- By 2100
- 30,264 · +202.1%
Race, ethnicity, and origin ACS 2023
- Neighborhood character
- Predominantly White (75%)
- Race & ethnicity
- White 75% Hispanic / Latino 19% Two or more races 5% Asian 5%
- Hispanic origin (detail)
- Mexican 19%
- Common ancestry
- Iranian 9% Lithuanian 1% Romanian 1%
- Foreign-born
- 7% · Vietnam, Canada
- Languages at home
- 79% English-only · Spanish 16% Vietnamese 5%
Political lean MEDSL · Winkler
- 2024 margin
- Solid R (+70.5) · D 14.7% · R 85.2%
- 2008→2024 swing
- -18.8pp toward R · 2008: -51.8pp · 2024: -70.5pp
- All cycles
- 2024: R+70.5 2020: R+65.6 2016: R+52.5 2012: R+53.5 2008: R+51.8
Not yet ingested
- Civics
- —
Market trends
- HPI YoY
- —
- Current HPI
- —
- Rent YoY
- —
- Metro
- —
- State GDP YoY
- ▲ 3.95%
- F500 in state
- 110
Industry mix (Fortune 500 HQ in TX)
| Industry | F500 HQs | Revenue |
|---|---|---|
| Energy | 16 | $1,198B |
|
||
| Technology | 5 | $198B |
|
||
| Engineering / Construction | 4 | $72B |
|
||
| Energy Services | 3 | $60B |
|
||
| Utilities | 3 | $41B |
|
||
| Healthcare | 2 | $330B |
|
||
Price history
1 event — show timeline
- 2026-06-04 Listed $130,000 ODMLS
Property tax history
-2.4%/yrLatest (2025): $99 · -0.1% YoY. Source: county tax records.
Cash-flow waterfall
monthlySold comps — $/sqft
last 12 mo · ≤1 miLoading sold comps…