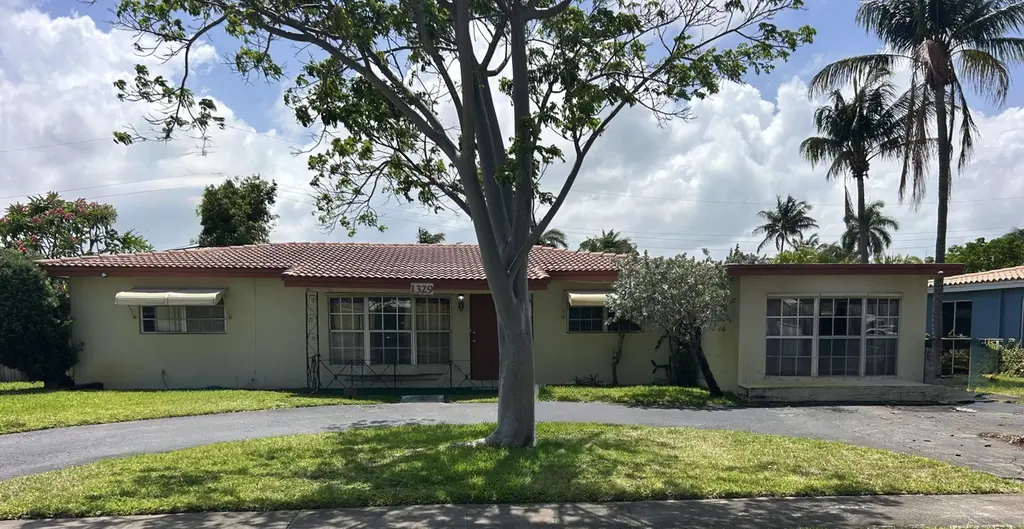
1329 SW 1st Ter · Pompano Beach, FL
Flood risk 4/10 · Minor
- FEMA flood zone
- X (shaded)
- Chance of flooding over 30 yrs
- 0.22%
- Est. flood insurance / yr
- $507 – $1,088
Fire risk 1/10 · Minimal
- Est. fire insurance / yr
- $947 – $1,759
Heat risk 10/10 · Severe
- Hot days now (above 106°F)
- 7 days/yr
- Hot days in 30 yrs
- 26 days/yr
Wind risk 10/10 · Severe
- Chance of severe wind over 30 yrs
- 99.0%
Air-quality risk 2/10 · Minimal
- Unhealthy air days now
- 1 days/yr
- Unhealthy air days in 30 yrs
- 2 days/yr
Risk factors via First Street. Map © Google.
Why this score? — see what drove the C+ grade
The composite is a weighted blend of 9 inputs, each scored 0–100. Each bar is that input's sub-score; the figure is the points it added to the 100-point composite (weight × sub-score).
- Cash flow +21.9/30.0
- ARV discount +15.0/15.0
- DSCR +7.0/10.0
- 1% rule +4.8/10.0
- Schools +4.1/10.0
- Livability +3.7/5.0
- Rent growth +3.0/5.0
- Condition / age +2.5/5.0
- Appreciation +0.0/10.0
$510,000
🖨 Deal sheet 📄 Offer letter ✓ Due diligence
Listing remarks
Welcome to Lyons Park! This charming home features a desirable split floor plan with the primary suite on one side and two additional bedrooms on the other, offering comfort and privacy. A standout feature is the oversized family room—perfect for relaxing or entertaining. A flexible room that was a garage conversion and has a separate entrance can easily serve as a 4th bedroom, guest suite, home office, or private space for extended family. The home maintains its original character, giving you the opportunity to update and customize to your style. A brand-new HVAC system is already in place, providing added peace of mind. Conveniently located near shopping, dining, and major roadways,
Key facts
- 7,500 sq ft lot
- 4 parking spots
- Built 1957
Property features AI
Finance
- Other: Pets allowed with no restrictions
Exterior
- Parking: Asphalt parking; Circular driveway; Total parking for 4 vehicles; No carport
- Security: Smoke detector(s)
- Utilities: Public water and well available; Public sewer; Electricity connected; Natural gas available; Sewer connected; Water connected
- Home design: Single-family home; One story; East-facing; Resale
- Construction: Concrete block (no stucco) construction; Barrel, tile and tar/gravel roof; 1-story construction (single level); Built as existing/resale (year not provided)
- Exterior features: Open porch; Porch; Chain link fencing in back yard; Asphalt road frontage; Public maintained road; Not waterfront
Interior
- Kitchen: Electric cooktop; Dishwasher; Refrigerator; Garbage disposal; Gas water heater
- Bedrooms: 3 bedrooms on the main level
- Flooring: Carpet; Wood
- Bathrooms: 2 full bathrooms (main level)
- Heating & cooling: Central heating; Central air; Ceiling fan(s); Wall/window unit(s)
- Interior features: Split bedroom layout; Bay window(s); Unfurnished
- Laundry & utility: Washer hookup inside; Dryer hookup (electric) inside; Dedicated laundry room
Neighborhood map
What this means for you Summary
Snapshot
- This is a 3-bed/2.0-bath single-family listed at $510k.
Deal economics
- At list price, monthly cash flow is $807 ($10k/yr) — positive.
- The deal already cash-flows at list — no discount required.
- To meet the 1% rule (rent ≥ 1% of price), the offer needs to be $500k (2.0% below list).
- Recommended offer: $500k (2.0% below list) — sets the bar for 1% rule.
- Cap rate 8.2% vs local median 3.1% in Pompano Beach — top-decile yield for the area; either an underpriced asset or a hidden risk that comps aren't pricing in. Stress-test before assuming the spread holds.
Location & tenants
- Location reads 74/100 on livability (#284 in FL, #4,541 nationally) — a middle-class / working-renter tenant base. Strengths: commute A+, housing A+, cost of living B+; Watch: employment D+, amenities F.
- Broward (suburban): math 42% / reading 53% proficiency, ranked #46 of 73 in FL (top 63%) — families likely to look elsewhere, expect single-tenant / working-renter base with shorter leases.
- Zoned schools: Mcnab Elementary School (math 51% / reading 63%, grade C+, #781 of 2,144 statewide, top 38%, 614 students, 56% FRL); Pompano Beach Middle School (math 29% / reading 40%, grade F, #421 of 571 statewide, top 74%, 1,040 students, 73% FRL); Blanche Ely High School (math 7% / reading 29%, grade F, #570 of 667 statewide, top 86%, 1,906 students, 75% FRL) — zoned schools average 68% FRL vs 51% district-wide (17 pts higher); higher-poverty schools than district average — tighter screening recommended.
- Market conditions: Rents rising (+2.1%/yr); 338 active listings in the ZIP; 40 comparable units currently listed for rent nearby; rentals at typical pace (median 22d on market — plan ~3-4 weeks tenant-placement turnaround); 2,111 units permitted in Broward County in 2024 (1,265 in 5+ unit buildings).
- At $4,997/mo this rent would consume 93% of the median local household income ($65k/yr) (locally 2870% of renters already pay >50% of income on rent) — very limited rent-growth headroom before tenants either downsize or default.
Forward outlook
- Local home prices are declining (-3.0%/yr); year-one equity from $4k of loan paydown is wiped out by about $15k of value loss. Plan a longer hold.
- Broward County population projected at +34% by 2050 — long-run rental-demand tailwind backs the buy-and-hold thesis.
Negotiation context
- It's been on market 24 days — a 2% lower offer ($502k) is reasonable based on typical stale-listing flexibility.
- 2 sale attempts; this cycle's ask has dropped $40k (7%) from the opening price — seller is motivated, your offer sets the floor, not the list.
Risks & watch-outs
- Watch-outs: built in 1957 — expect roof / HVAC / electrical / plumbing capex.
- Climate carrying-cost: severe wind risk, 99% chance of damaging wind over 30y; extreme-heat days projected 7→26/yr by 2055 (HVAC capex compounding) — expect insurance premiums to compound above CPI over the hold.
Questions for the listing agent
- Built in 1957 — when were the roof, HVAC, electrical panel, plumbing, and water heater last replaced?
- Is there a deadline driving the sale (1031 exchange, divorce, estate, relocation)? That informs how much negotiation room exists.
- Schools are D-rated, which usually means shorter tenancies and higher turnover. Who's the typical renter profile here, and what's been the actual vacancy rate?
- What's the average days-on-market for RENTAL listings here right now (not sales)? A rising rental-DOM trend means longer vacancies and softer asking-rent achievability than the comps imply.
- What's the recent tenant-quality profile in this submarket — average credit score on applications, eviction rate, late-payment / NSF rate, and stable-employment percentage? A property-management company in the area should have these aggregated.
- How much new for-sale + rental construction is in the pipeline within 1–3 miles? Heavy new supply typically softens prices + rents 12–24 months out; constrained supply supports both.
Investment metrics
- 1% rule
- 0.98% ✗
- Cap rate
- 8.19%
- Cash-on-cash
- 6.78%
- DSCR
- 1.30
- GRM
- 8.5
CMA / ARV
- ARV (on-the-fly)
- $893,620
- Comps found
- 4
Show comp detail 4 sales within ~0.75 mi
| Address | Dist | Beds/Ba | Sqft | Sold | Price | $/sf | Match |
|---|---|---|---|---|---|---|---|
| 1710 SW 1st Ave | 0.31mi | 3/2.0 | 2,117 (-14%) | 2mo | $740,000 | $350 | 61 |
| 6110 NE 19th Ave | 0.72mi | 3/2.0 | 2,382 (-3%) | 3mo | $700,000 | $294 | 59 |
| 1520 NE 60th St | 0.71mi | 4/2.0 (+1) | 2,517 (+2%) | 12mo | $915,000 | $364 | 47 |
| 6611 NE 21st Ln | 0.70mi | 3/3.0 | 2,095 (-15%) | 0mo | $1,100,000 | $525 | 39 |
Match score weights: distance 35% · size 25% · config 20% · recency 20%. Top-matched comps best support the ARV.
Projected returns pro-forma
-3.0% appreciation · 2.12% rent growth · sell at horizon
- IRR
- -6.8%
- Equity multiple
- 0.75×
- Total profit
- $-35,794
- Equity at exit
- $76,043
- IRR
- 1.7%
- Equity multiple
- 1.12×
- Total profit
- $16,676
- Equity at exit
- $44,095
Cash invested: $142,800 (down + closing). Projections, not guarantees.
Landlord ↔ Tenant lean methodology
- Overall (STATE)
- 87 Strongly Landlord-Friendly
- State Florida
- 87 Strongly Landlord-Friendly · R+3
- County
- — inherits STATE
- City
- — inherits STATE
ZIP-level market 33060
- Home prices YoY
- -23.6%
- Rents YoY
- 2.1%
- Active inventory
- 338
- Price-to-rent
- 8.5×
Monthly cashflow live
- Estimated rent
- $4,997 high interval (Pro) →
- Mortgage (P&I)
- −$2,674
- Tax from tax record
- −$254 /mo · $3,042/yr
- Insurance
- −$212
- HOA
- −$0
- Vacancy / Maint / Mgmt
- −$1,049
- Net cashflow
- $807
Break-even live
UW: 25.0% down · 7.5% · 30yr · 1.5% tax · 5.0% vac · 8.0% maint · 8.0% mgmt
Financing live
Cash to close
- Down payment
- $127,500
- Closing costs
- $15,300
- Reserves months
- —
- Total cash needed
- —
Loan-product check · same deal, 3 products live
Conventional
25% down · 7.5% · 30yr
- Down + closing
- —
- Monthly P&I
- —
- Monthly cashflow
- —
- DSCR
- —
- Eligible?
- —
Personal DTI + credit; lowest rate.
DSCR
20% down · 8.5% · 30yr
- Down + closing
- —
- Monthly P&I
- —
- Monthly cashflow
- —
- DSCR
- —
- Eligible?
- —
No personal income docs; deal must DSCR.
Hard money
10% down · 12.0% · 12mo
- Down + closing
- —
- Monthly P&I
- —
- Monthly cashflow
- —
- DSCR
- —
- Eligible?
- —
Short-term bridge; refi at stabilization.
Rent comps 40 comps
| Address | Beds | Baths | Sqft | Rent | $/sqft | DOM | Units | Dist |
|---|---|---|---|---|---|---|---|---|
| 1048 SW 1st Ter Pompano Beach, FL | 3.0 | 3.0 | 1649 | $3,800 | $2.30 | 13d | 1 | 0.24mi |
| 100 SW 17th St Pompano Beach, FL | 3.0 | 2.0 | 1788 | $4,500 | $2.52 | 7d | 1 | 0.28mi |
| 100 SW 17th St Pompano Beach, FL | 3.0 | 2.0 | 1788 | $4,500 | $2.52 | 24d | 1 | 0.28mi |
| 850 SE 1st Ave Pompano Beach, FL | 3.0 | 3.0 | 1673 | $4,450 | $2.66 | 24d | 1 | 0.43mi |
| 1601 NE 63rd St Fort Lauderdale, FL | 3.0 | 2.0 | 1875 | $6,125 | $3.27 | 24d | 1 | 0.50mi |
| 300 SE 8th Ct Pompano Beach, FL | 4.0 | 2.0 | 2204 | $6,200 | $2.81 | 24d | 1 | 0.55mi |
| 821 SW 13th Ct Pompano Beach, FL | 4.0 | 3.5 | 2924 | $6,950 | $2.38 | 24d | 1 | 0.56mi |
| 170 SE 7th St #170 Pompano Beach, FL | 3.0 | 2.5 | 1798 | $3,550 | $1.97 | 10d | 1 | 0.56mi |
| 170 SE 7th St #170 Pompano Beach, FL | 3.0 | 2.5 | 1798 | $3,650 | $2.03 | 24d | 1 | 0.56mi |
| 511 SE 14th St Unit 1 Pompano Beach, FL | 4.0 | 2.5 | 1880 | $7,000 | $3.72 | 24d | 1 | 0.59mi |
| 2080 NE 65th St Fort Lauderdale, FL | 3.0 | 2.0 | 1725 | $5,250 | $3.04 | 24d | 1 | 0.60mi |
| 2080 NE 65th St Fort Lauderdale, FL | 3.0 | 2.0 | 1725 | $5,000 | $2.90 | 15d | 1 | 0.60mi |
| 618 SW 1st Ter Pompano Beach, FL | 3.0 | 3.0 | 1803 | $3,295 | $1.83 | 24d | 1 | 0.61mi |
| 151 SE 6th Ct Pompano Beach, FL | 4.0 | 3.0 | 2146 | $6,495 | $3.03 | 7d | 1 | 0.63mi |
| 151 SE 6th Ct Pompano Beach, FL | 4.0 | 3.0 | 2146 | $6,980 | $3.25 | 24d | 1 | 0.63mi |
| 6241 NE 19th Ter Fort Lauderdale, FL | 4.0 | 3.0 | 1828 | $7,500 | $4.10 | 7d | 1 | 0.63mi |
| 6251 NE 20th Ter Fort Lauderdale, FL | 3.0 | 3.0 | 1954 | $7,000 | $3.58 | 11d | 1 | 0.64mi |
| 1961 NE 62nd Ct Fort Lauderdale, FL | 3.0 | 2.0 | 1630 | $7,000 | $4.29 | 24d | 1 | 0.66mi |
| 2101 NE 63rd St Unit 2101 Fort Lauderdale, FL | 3.0 | 2.0 | 1805 | $4,925 | $2.73 | 20d | 1 | 0.70mi |
| 161 SE 5th Ct Pompano Beach, FL | 3.0 | 2.0 | 1605 | $5,150 | $3.21 | 24d | 1 | 0.75mi |
| 5921 NE 15th Ave Fort Lauderdale, FL | 3.0 | 3.0 | 1977 | $4,600 | $2.33 | 24d | 1 | 0.75mi |
| 5800 NE 15th Ave Fort Lauderdale, FL | 4.0 | 3.0 | 2076 | $6,000 | $2.89 | 5d | 1 | 0.83mi |
| 5800 NE 15th Ave Fort Lauderdale, FL | 4.0 | 3.0 | 2076 | $6,000 | $2.89 | 2d | 1 | 0.83mi |
| 2161 NE 62nd Ct Unit 2161 Fort Lauderdale, FL | 4.0 | 3.0 | 2047 | $7,500 | $3.66 | 24d | 1 | 0.85mi |
| 6421 NE 22nd Ave Fort Lauderdale, FL | 4.0 | 2.0 | 2202 | $5,750 | $2.61 | 16d | 1 | 0.87mi |
| 6421 NE 22nd Ave Fort Lauderdale, FL | 4.0 | 2.0 | 2202 | $5,750 | $2.61 | 7d | 1 | 0.87mi |
| 6341 NE 22nd Ave Fort Lauderdale, FL | 3.0 | 2.0 | 2086 | $5,500 | $2.64 | 14d | 1 | 0.91mi |
| 280 SE 3rd Ct Pompano Beach, FL | 3.0 | 2.0 | 2042 | $5,900 | $2.89 | 24d | 1 | 0.95mi |
| 5910 NE 21st Way Fort Lauderdale, FL | 3.0 | 2.0 | 1823 | $4,950 | $2.72 | 21d | 1 | 0.96mi |
| 5790 NE 20th Ter Fort Lauderdale, FL | 3.0 | 2.0 | 1874 | $6,000 | $3.20 | 24d | 1 | 0.97mi |
| 1466 NE 57th Ct Fort Lauderdale, FL | 3.0 | 2.0 | 2020 | $8,200 | $4.06 | 24d | 1 | 1.01mi |
| 1466 NE 57th Ct Unit 1044539P Fort Lauderdale, FL | 3.0 | 2.0 | 2012 | $6,185 | $3.07 | 7d | 1 | 1.01mi |
| 356 SW 2nd Pl Unit 1-3 Pompano Beach, FL | 2.0 | 1.0 | 2570 | $2,300 | $0.89 | 5d | 1 | 1.03mi |
| 1478 NE 57th St Fort Lauderdale, FL | 3.0 | 2.0 | 1590 | $5,400 | $3.40 | 24d | 1 | 1.06mi |
| 1419 NE 57th St Fort Lauderdale, FL | 4.0 | 2.5 | 2176 | $7,500 | $3.45 | 13d | 1 | 1.07mi |
| 5700 NE 20th Ave Fort Lauderdale, FL | 3.0 | 2.0 | 2300 | $5,575 | $2.42 | 24d | 1 | 1.07mi |
| 1641 NE 56th Ct Fort Lauderdale, FL | 4.0 | 3.5 | 2372 | $5,500 | $2.32 | 10d | 1 | 1.08mi |
| 2260 NE 62nd St Fort Lauderdale, FL | 3.0 | 2.0 | 1807 | $4,750 | $2.63 | 10d | 1 | 1.09mi |
| 1001 NE 58th St Fort Lauderdale, FL | 3.0 | 2.5 | 1585 | $3,436 | $2.17 | 1d | 2 | 1.09mi |
| 2010 NE 57th St Fort Lauderdale, FL | 3.0 | 2.0 | 1730 | $6,000 | $3.47 | 21d | 1 | 1.11mi |
Listing history 17 events
-
2026-06-18days on market $510,000 Active 24 DOM
-
2026-06-17pricedays on market $510,000 Active 23 DOM
-
2026-06-16days on market $520,000 Active 22 DOM
-
2026-06-15days on market $520,000 Active 21 DOM
-
2026-06-13days on market $520,000 Active 19 DOM
-
2026-06-09days on market $520,000 Active 15 DOM
-
2026-06-08days on market $520,000 Active 14 DOM
-
2026-06-07days on market $520,000 Active 13 DOM
-
2026-06-04days on market $520,000 Active 10 DOM
-
2026-06-03days on market $520,000 Active 9 DOM
-
2026-06-02days on market $520,000 Active 8 DOM
-
2026-06-01days on market $520,000 Active 7 DOM
-
2026-05-31days on market $520,000 Active 6 DOM
-
2026-05-25status Active
-
2026-05-25price $520,000
-
2026-05-13historical
-
2026-05-13$550,000 Active
ⓘ Source: listings_history table (triggers on properties + properties_extension) + one-shot
backfill from property_details.listing_events for pre-trigger history.
Tax reassessment forecast FL · Resets to sale price
- Current annual tax
- $3,042 · $254/mo
- Projected year-2 tax
- $4,233 · $353/mo
- Expected delta
- +$1,191/yr (+$99/mo · 39.1%)
ⓘ Screening estimate from a state-policy table — verify with the county assessor before closing.
Climate risk First Street
- Flood 4/10 Moderate FEMA zone X (shaded) · 22% chance over 30 yrs
- Wildfire 1/10 Low
- Heat 10/10 Extreme 7 d/yr ≥106°F today · 26 d/yr by 30 yrs out
- Wind 10/10 Extreme 99% chance of damaging wind over 30 yrs
- Air quality 2/10 Low 1 unhealthy d/yr today · 2 by 30 yrs out
Nearby sold comps map
Loading sold comps map…
Walkable amenities ~0.75 mi
Loading nearby amenities…
Taxation est. · year 1
- Rental income
- $59,962
- − Mortgage interest
- −$28,568
- − Property taxes
- −$3,042
- − Insurance
- −$2,550
- − Repairs & maintenance
- −$4,797
- − Management
- −$4,797
- − Depreciation
- −$14,836
- Taxable income
- $1,371
- Est. tax owed @ 24.0%
- −$329
- After-tax cash flow
- $9,354/yr
For passive investors: Depreciation is non-cash, so a rental often shows a tax loss while cash-flowing — sheltering income. Rental losses are passive: they offset passive income freely, and up to $25,000/yr can offset ordinary (W-2) income if you actively participate and your MAGI is under $100k (phasing out to $0 by $150k); unused losses carry forward. On sale, claimed depreciation is recaptured at up to 25%, and gains may owe capital-gains tax (a 1031 exchange can defer both). Figures are a year-1 estimate at your 24.0% rate — not tax advice; consult a CPA.
Schools (NCES district)
- District
- Broward
- NCES district ID
- 1200180
- Math proficiency
- 42% ▼ -18.00%
- Reading proficiency
- 53% ▼ -5.00%
- Median HH income
- $52,139
- Composite
- 40.88/100
- National rank
- #3621
- State rank
- #46 of 73 in FL
Livability — Pompano Beach
- Score
- 74/100
- State rank
- #284
- US rank
- #4541
Category grades
Schools grade is shown separately in the Schools card above.
Census & demographics
- Census place
- Pompano Beach, FL
- County
- Broward County · 1,963,430 people
- City population
- 155,861
- Metro
- Miami-Fort Lauderdale-Pompano Beach, FL
- Population (ZIP)
- 37,233
- Household income
- $64,819
- Rent vs Own
- Severe rent burden
- 2870.0
Population outlook (Broward County) Hauer SSP2
- Today (2025)
- 2,207,033 people
- By 2030
- 2,360,704 · +7.0%
- By 2040
- 2,661,208 · +20.6%
- By 2050
- 2,946,698 · +33.5%
- By 2075
- 3,602,273 · +63.2%
- By 2100
- 3,970,984 · +79.9%
Race, ethnicity, and origin ACS 2023
- Neighborhood character
- Diverse neighborhood (Simpson 0.69)
- Race & ethnicity
- Black 38% White 33% Hispanic / Latino 26% Two or more races 14%
- Hispanic origin (detail)
- Mexican 9% Puerto Rican 2% Cuban 3% Dominican 1%
- Common ancestry
- Hispanic 13% Romanian 2% Slovak 1%
- Foreign-born
- 31% · Canada, Jamaica
- Languages at home
- 60% English-only · Spanish 23% French/Haitian/Cajun 13% Other Indo-European 2%
Political lean MEDSL · Broward
- 2024 margin
- D (+17.0) · D 58.0% · R 41.0%
- 2008→2024 swing
- -17.8pp toward R · 2008: 34.7pp · 2024: 17.0pp
- All cycles
- 2024: D+17.0 2020: D+29.8 2016: D+35.0 2012: D+34.9 2008: D+34.7
Not yet ingested
- Civics
- —
Market trends
- HPI YoY
- ▼ -131.09%
- Current HPI
- 425.3083
- Rent YoY
- ▲ 2.12%
- Metro
- Miami-Fort Lauderdale-Pompano Beach, FL
- State GDP YoY
- ▲ 3.28%
- F500 in state
- 36
Industry mix (Fortune 500 HQ in FL)
| Industry | F500 HQs | Revenue |
|---|---|---|
| Industrial Technology | 2 | $29B |
|
||
| Insurance | 2 | $17B |
|
||
| Retail | 1 | $60B |
|
||
| Technology Distribution | 1 | $58B |
|
||
| Homebuilding | 1 | $35B |
|
||
| Technology Manufacturing | 1 | $35B |
|
||
Price history
-5.5% since first listed4 events — show timeline
- 2026-05-25 Relisted — Beaches MLS
- 2026-05-25 Price Changed $520,000 Beaches MLS
- 2026-05-13 Listing Removed — Beaches MLS
- 2026-05-13 Listed $550,000 Beaches MLS
Property tax history
+4.5%/yrLatest (2025): $3,042 · +4.2% YoY. Source: county tax records.
Cash-flow waterfall
monthlySold comps — $/sqft
last 12 mo · ≤1 miLoading sold comps…