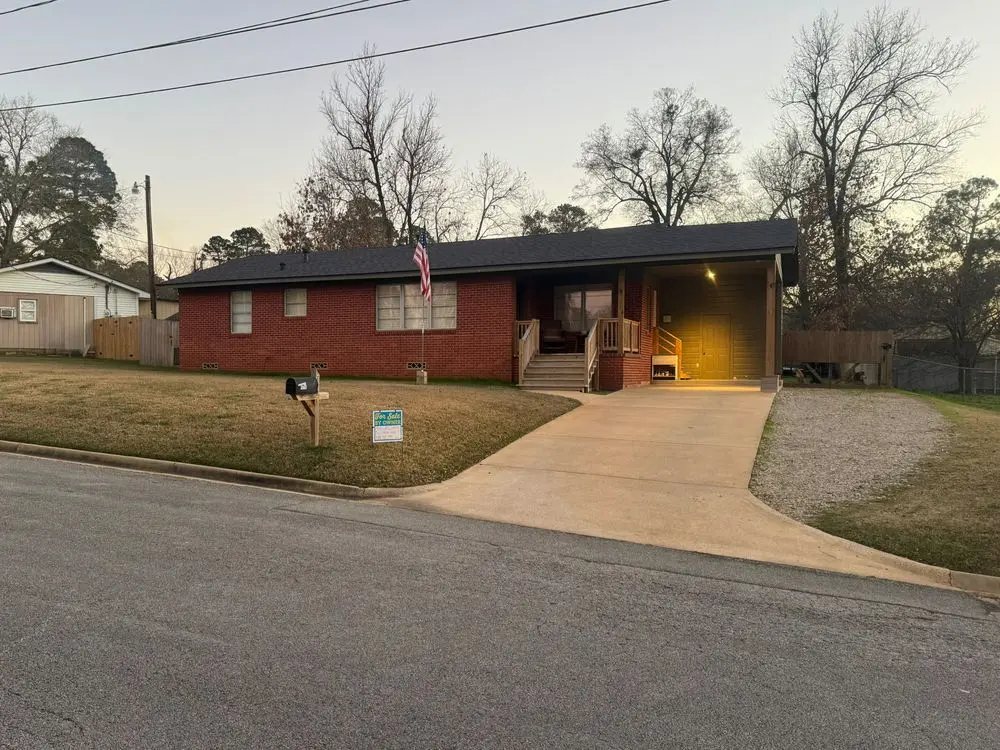
702 Elaine St · Henderson, TX
Flood risk 1/10 · Minimal
- FEMA flood zone
- X (unshaded)
- Chance of flooding over 30 yrs
- 0.0%
- Est. flood insurance / yr
- $507 – $1,088
Fire risk 5/10 · Moderate
- Est. fire insurance / yr
- $1,222 – $2,270
Heat risk 7/10 · Major
- Hot days now (above 110°F)
- 7 days/yr
- Hot days in 30 yrs
- 24 days/yr
Wind risk 6/10 · Moderate
- Chance of severe wind over 30 yrs
- 67.0%
Air-quality risk 1/10 · Minimal
- Unhealthy air days now
- 0 days/yr
- Unhealthy air days in 30 yrs
- 0 days/yr
Risk factors via First Street. Map © Google.
Why this score? — see what drove the D grade
The composite is a weighted blend of 9 inputs, each scored 0–100. Each bar is that input's sub-score; the figure is the points it added to the 100-point composite (weight × sub-score).
- ARV discount +10.7/15.0
- Appreciation +10.0/10.0
- Cash flow +7.1/30.0
- Livability +3.5/5.0
- Schools +2.8/10.0
- Rent growth +2.5/5.0
- Condition / age +2.5/5.0
- 1% rule +1.7/10.0
- DSCR +1.3/10.0
$198,000
🖨 Deal sheet (PDF) 📄 Offer letter ✓ Due diligence
Listing remarks MLS
Charming 2 bedroom, 1 bath home with 2 living areas--perfect for relaxing or entertaining. Enjoy a large, fully fenced backyard with a deck, ideal for outdoor gatherings and play also includes a fenced area for your pets. Conveniently located near shopping, dining and schools. This home offers both comfort and convenience!
Key facts
- Breakfast nook
- Plantation shutters
- Bonus room
Tags
Neighborhood map
What this means for you Summary
Snapshot
- This is a 2-bed/1.0-bath single-family listed at $198k.
Deal economics
- At list price, monthly cash flow is $-279 ($-3k/yr) — negative.
- To cash-flow at today's rent, offer at most $149k (24.9% below list).
- To meet the 1% rule (rent ≥ 1% of price), the offer needs to be $134k (32.5% below list).
- Recommended offer: $134k (32.5% below list) — sets the bar for 1% rule.
- Cap rate 4.6% vs local median 2.9% in Henderson — top-decile yield for the area; either an underpriced asset or a hidden risk that comps aren't pricing in. Stress-test before assuming the spread holds.
Location & tenants
- Location reads 69/100 on livability (#408 in TX) — a middle-class / working-renter tenant base. Strengths: cost of living A+, housing A+, health & safety A+; Watch: employment D+, crime F, amenities F.
- Henderson ISD (town): math 30% / reading 35% proficiency, ranked #573 of 826 in TX (top 69%) — families likely to look elsewhere, expect single-tenant / working-renter base with shorter leases.
- Zoned schools: William E Wylie El (math 31% / reading 39%, grade F, #1,965 of 4,322 statewide, top 46%, 671 students, 66% FRL); Henderson Middle (math 29% / reading 33%, grade F, #1,015 of 1,662 statewide, top 62%, 785 students, 58% FRL); Henderson H S (math 39% / reading 53%, grade D-, #627 of 1,632 statewide, top 38%, 1,042 students, 60% FRL).
- Market conditions: 179 active listings in the ZIP; 1 comparable units currently listed for rent nearby; 4 units permitted in Rusk County in 2024 (0 in 5+ unit buildings).
Forward outlook
- In year one you build about $21k of equity ($1k loan paydown + $20k appreciation (10.0% local appreciation)).
- Rusk County population projected to shrink 5% by 2050 — rents likely to lag national; underwrite the cash flow, not the appreciation.
- By year 2, paydown + projected appreciation supports a ~$34k cash-out refi (75% LTV) — recoverable capital for the next deal without selling this one.
Negotiation context
- It's been on market 134 days — a 12% lower offer ($174k) is reasonable based on typical stale-listing flexibility.
- 3 sale attempts since 13y ago with the ask held roughly flat each time — persistent listings suggest the price (not the market) is what's stuck; bring a comps-based counter.
Risks & watch-outs
- Watch-outs: built in 1954 — expect roof / HVAC / electrical / plumbing capex.
- Climate carrying-cost: major wind risk, 67% chance of damaging wind over 30y; moderate wildfire risk; extreme-heat days projected 7→24/yr by 2055 (HVAC capex compounding) — expect insurance premiums to compound above CPI over the hold.
Questions for the listing agent
- What do current leases actually rent for vs. the listed asking? Can we see a recent rent roll and the last 12 months of T-12 income?
- It's been on market 134 days. Have you received any prior offers? Is the seller open to a 33% concession, seller financing, or rate buy-down credit?
- Built in 1954 — when were the roof, HVAC, electrical panel, plumbing, and water heater last replaced?
- Why hasn't it sold? Are there any deal-killer items the seller is aware of (foundation, flood, title, zoning, code violations)?
- Is there a deadline driving the sale (1031 exchange, divorce, estate, relocation)? That informs how much negotiation room exists.
- Schools are D-rated, which usually means shorter tenancies and higher turnover. Who's the typical renter profile here, and what's been the actual vacancy rate?
- Crime grade is F in this area — have there been break-ins, vandalism, or insurance claims at this property in the last 3 years? What carrier currently insures it and at what premium?
- The area grade is low — what's the realistic commute time and amenity access for the typical tenant pool here? Any planned neighborhood developments (good or bad) we should know about?
- What's the average days-on-market for RENTAL listings here right now (not sales)? A rising rental-DOM trend means longer vacancies and softer asking-rent achievability than the comps imply.
- What's the recent tenant-quality profile in this submarket — average credit score on applications, eviction rate, late-payment / NSF rate, and stable-employment percentage? A property-management company in the area should have these aggregated.
- How much new for-sale + rental construction is in the pipeline within 1–3 miles? Heavy new supply typically softens prices + rents 12–24 months out; constrained supply supports both.
Investment metrics
- 1% rule
- 0.67% ✗
- Cap rate
- 4.60%
- Cash-on-cash
- -6.03%
- DSCR
- 0.73
- GRM
- 12.4
CMA / ARV
- ARV (median comp)
- $213,102
- List price
- $198,000
- Delta
- -7.09%
- Verdict
- FAIR
- Comps
- 4 within 1.0 mi
Projected returns pro-forma
10.0% appreciation · 3.0% rent growth · sell at horizon
- IRR
- 20.0%
- Equity multiple
- 2.62×
- Total profit
- $90,088
- Equity at exit
- $178,374
- IRR
- 18.3%
- Equity multiple
- 6.04×
- Total profit
- $279,248
- Equity at exit
- $384,670
Cash invested: $55,440 (down + closing). Projections, not guarantees.
Landlord ↔ Tenant lean methodology
- Overall (STATE)
- 87 Strongly Landlord-Friendly
- State Texas
- 87 Strongly Landlord-Friendly · R+5
- County
- — inherits STATE
- City
- — inherits STATE
ZIP-level market 75654
- Home prices YoY
- 7.8%
- Active inventory
- 179
- Price-to-rent
- 12.4×
Monthly cashflow live
- Estimated rent
- $1,336 medium interval (Pro) →
- Mortgage (P&I)
- −$1,038
- Tax from tax record
- −$213 /mo · $2,559/yr
- Insurance
- −$82
- HOA
- −$0
- Vacancy / Maint / Mgmt
- −$281
- Net cashflow
- $-279
Break-even live
Sensitivity live
| Price | -10% $-167 | -5% $-223 | +0% $-279 | +5% $-335 | +10% $-391 |
|---|---|---|---|---|---|
| Rent | -10% $-384 | -5% $-331 | +0% $-279 | +5% $-226 | +10% $-173 |
| Rate | -1.0pp $-179 | -0.5pp $-228 | base $-279 | +0.5pp $-330 | +1.0pp $-382 |
UW: 25.0% down · 7.5% · 30yr · 1.5% tax · 5.0% vac · 8.0% maint · 8.0% mgmt
Financing live
Cash to close
- Down payment
- $49,500
- Closing costs
- $5,940
- Reserves months
- —
- Total cash needed
- —
Loan-product check · same deal, 3 products live
Conventional
25% down · 7.5% · 30yr
- Down + closing
- —
- Monthly P&I
- —
- Monthly cashflow
- —
- DSCR
- —
- Eligible?
- —
Personal DTI + credit; lowest rate.
DSCR
20% down · 8.5% · 30yr
- Down + closing
- —
- Monthly P&I
- —
- Monthly cashflow
- —
- DSCR
- —
- Eligible?
- —
No personal income docs; deal must DSCR.
Hard money
10% down · 12.0% · 12mo
- Down + closing
- —
- Monthly P&I
- —
- Monthly cashflow
- —
- DSCR
- —
- Eligible?
- —
Short-term bridge; refi at stabilization.
Rent comps 1 comps
| Address | Beds | Baths | Sqft | Rent | $/sqft | DOM | Units | Dist |
|---|---|---|---|---|---|---|---|---|
| 504 S Van Buren St Henderson, TX | 1.0–2.0 | 1.0 | 832 | $1,336 | $1.60 | 15d | 3 | 0.50mi |
Listing history 12 events
-
2026-06-02days on market $198,000 Active 134 DOM
-
2026-06-01days on market $198,000 Active 133 DOM
-
2026-05-31days on market $198,000 Active 132 DOM
-
2026-05-30days on market $198,000 Active 131 DOM
-
2026-04-15soldstatus Closed 324-char remark
Show marketing remark (324 chars)
Charming 2 bedroom, 1 bath home with 2 living areas--perfect for relaxing or entertaining. Enjoy a large, fully fenced backyard with a deck, ideal for outdoor gatherings and play also includes a fenced area for your pets. Conveniently located near shopping, dining and schools. This home offers both comfort and convenience!
-
2026-04-08status Pending 324-char remark
Show marketing remark (324 chars)
Charming 2 bedroom, 1 bath home with 2 living areas--perfect for relaxing or entertaining. Enjoy a large, fully fenced backyard with a deck, ideal for outdoor gatherings and play also includes a fenced area for your pets. Conveniently located near shopping, dining and schools. This home offers both comfort and convenience!
-
2026-03-16price $185,000 324-char remark
Show marketing remark (324 chars)
Charming 2 bedroom, 1 bath home with 2 living areas--perfect for relaxing or entertaining. Enjoy a large, fully fenced backyard with a deck, ideal for outdoor gatherings and play also includes a fenced area for your pets. Conveniently located near shopping, dining and schools. This home offers both comfort and convenience!
-
2026-02-10$195,000 Active 324-char remark
Show marketing remark (324 chars)
Charming 2 bedroom, 1 bath home with 2 living areas--perfect for relaxing or entertaining. Enjoy a large, fully fenced backyard with a deck, ideal for outdoor gatherings and play also includes a fenced area for your pets. Conveniently located near shopping, dining and schools. This home offers both comfort and convenience!
-
2026-01-19$198,000 Active 1389-char remark
Show marketing remark (1389 chars)
Welcome home to this charming and well-maintained 2-bedroom, 1-bath residence offering 1,732 sq ft of comfortable living space in a great neighborhood. Step inside to find beautiful hardwood floors and plantation shutters throughout, creating a warm and timeless feel. The spacious living room flows into a versatile bonus room that could serve as a formal dining area, extra seating room, or flex space to suit your needs. The home features a cozy breakfast nook, a dedicated laundry room, and ample storage including attic storage in the house and a large storage room under the covered carport with additional attic space. Enjoy the convenience of a covered one-car carport plus additional uncovered parking. Outdoor living shines with a welcoming front porch, a covered back porch with French doors (2025), and a pergola with raised garden bedsperfect for relaxing or entertaining. A privacy fence adds comfort and seclusion to the backyard. Major updates provide peace of mind, including a new roof (2023), HVAC system (2025), driveway (2021), back porch (2022), front porch steps and handrails (2022), privacy fence (2021), and a new carport door (2025). Ideally located within walking distance to the middle school and Lions Stadium, this home combines thoughtful updates, generous space, and an unbeatable location. Dont miss your opportunity to make this move-in-ready home yours!
-
2013-12-31soldstatus
-
2013-12-27soldstatus
-
2013-12-01$89,900
ⓘ Source: listings_history table (triggers on properties + properties_extension) + one-shot
backfill from property_details.listing_events for pre-trigger history.
Tax reassessment forecast TX · Resets to sale price
- Current annual tax
- $2,559 · $213/mo
- Projected year-2 tax
- $3,623 · $302/mo
- Expected delta
- +$1,064/yr (+$89/mo · 41.6%)
ⓘ Screening estimate from a state-policy table — verify with the county assessor before closing.
Climate risk First Street
- Flood 1/10 Low FEMA zone X (unshaded) · 0% chance over 30 yrs
- Wildfire 5/10 Major
- Heat 7/10 Severe 7 d/yr ≥110°F today · 24 d/yr by 30 yrs out
- Wind 6/10 Major 67% chance of damaging wind over 30 yrs
- Air quality 1/10 Low 0 unhealthy d/yr today · 0 by 30 yrs out
Nearby sold comps map
Loading sold comps map…
Walkable amenities ~0.75 mi
Loading nearby amenities…
Taxation est. · year 1
- Rental income
- $16,032
- − Mortgage interest
- −$11,091
- − Property taxes
- −$2,559
- − Insurance
- −$990
- − Repairs & maintenance
- −$1,283
- − Management
- −$1,283
- − Depreciation
- −$5,760
- Taxable loss
- −$6,933
- Est. tax savings @ 24.0%
- +$1,664
- After-tax cash flow
- $-1,680/yr
For passive investors: Depreciation is non-cash, so a rental often shows a tax loss while cash-flowing — sheltering income. Rental losses are passive: they offset passive income freely, and up to $25,000/yr can offset ordinary (W-2) income if you actively participate and your MAGI is under $100k (phasing out to $0 by $150k); unused losses carry forward. On sale, claimed depreciation is recaptured at up to 25%, and gains may owe capital-gains tax (a 1031 exchange can defer both). Figures are a year-1 estimate at your 24.0% rate — not tax advice; consult a CPA.
Schools (NCES district)
- District
- Henderson ISD
- NCES district ID
- 4822970
- Math proficiency
- 30% ▼ -23.00%
- Reading proficiency
- 35% ▼ -13.00%
- Median HH income
- $46,296
- Composite
- 27.91/100
- National rank
- #6868
- State rank
- #573 of 826 in TX
Livability — Henderson
- Score
- 69/100
- State rank
- #408
- US rank
- #8434
Category grades
Schools grade is shown separately in the Schools card above.
Census & demographics
- Census place
- Henderson, TX
- Population (ZIP)
- 12,184
Population outlook (Rusk County) Hauer SSP2
- Today (2025)
- 52,498 people
- By 2030
- 52,093 · -0.8%
- By 2040
- 50,866 · -3.1%
- By 2050
- 49,696 · -5.3%
- By 2075
- 48,583 · -7.5%
- By 2100
- 43,265 · -17.6%
Race, ethnicity, and origin ACS 2023
- Neighborhood character
- Predominantly White (65%)
- Race & ethnicity
- White 65% Hispanic / Latino 24% Two or more races 16% Black 7%
- Hispanic origin (detail)
- Mexican 20%
- Common ancestry
- Lithuanian 1% Italian 1% Slovak 1%
- Foreign-born
- 11% · Canada
- Languages at home
- 81% English-only · Spanish 18%
Political lean MEDSL · Rusk
- 2024 margin
- Solid R (+59.4) · D 20.0% · R 79.4%
- 2008→2024 swing
- -13.2pp toward R · 2008: -46.3pp · 2024: -59.4pp
- All cycles
- 2024: R+59.4 2020: R+55.7 2016: R+56.5 2012: R+51.1 2008: R+46.3
Not yet ingested
- Civics
- —
Market trends
- HPI YoY
- ▲ 28.83%
- Current HPI
- 397.5
- Rent YoY
- —
- Metro
- —
- State GDP YoY
- ▲ 3.95%
- F500 in state
- 110
Industry mix (Fortune 500 HQ in TX)
| Industry | F500 HQs | Revenue |
|---|---|---|
| Energy | 16 | $1,198B |
|
||
| Technology | 5 | $198B |
|
||
| Engineering / Construction | 4 | $72B |
|
||
| Energy Services | 3 | $60B |
|
||
| Utilities | 3 | $41B |
|
||
| Healthcare | 2 | $330B |
|
||
Price history
+105.8% since first listed8 events — show timeline
- 2026-04-15 Sold (MLS) — LAAR
- 2026-04-08 Pending — LAAR
- 2026-03-16 Price Changed $185,000 LAAR
- 2026-02-10 Listed $195,000 LAAR
- 2026-01-19 Listed $198,000 ForSaleByOwner.com
- 2013-12-31 Sold (Public Records) — Public Records
- 2013-12-27 Sold (MLS) — GTAR
- 2013-12-01 Listed $89,900 GTAR
Property tax history
+3.8%/yrLatest (2025): $2,559 · -6.8% YoY. Source: county tax records.
Cash-flow waterfall
monthlySold comps — $/sqft
last 12 mo · ≤1 miLoading sold comps…