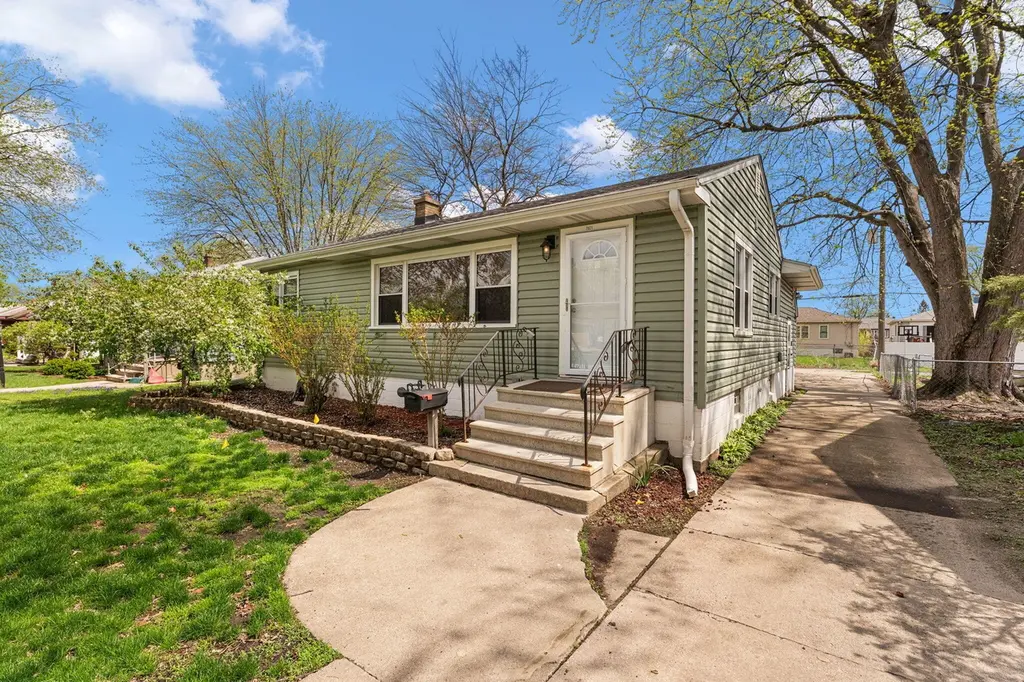
7021 Osborn Ave · Hammond, IN
Flood risk 3/10 · Minor
- FEMA flood zone
- X (unshaded)
- Chance of flooding over 30 yrs
- 0.2%
- Est. flood insurance / yr
- $473 – $860
Fire risk 1/10 · Minimal
- Est. fire insurance / yr
- $717 – $1,331
Heat risk 3/10 · Minor
- Hot days now (above 102°F)
- 7 days/yr
- Hot days in 30 yrs
- 15 days/yr
Wind risk 2/10 · Minimal
- Chance of severe wind over 30 yrs
- 1.0%
Air-quality risk 4/10 · Minor
- Unhealthy air days now
- 5 days/yr
- Unhealthy air days in 30 yrs
- 6 days/yr
Risk factors via First Street. Map © Google.
Why this score? — see what drove the D grade
The composite is a weighted blend of 9 inputs, each scored 0–100. Each bar is that input's sub-score; the figure is the points it added to the 100-point composite (weight × sub-score).
- Cash flow +17.2/30.0
- ARV discount +6.6/15.0
- DSCR +5.3/10.0
- 1% rule +3.9/10.0
- Livability +3.5/5.0
- Rent growth +2.5/5.0
- Condition / age +2.5/5.0
- Schools +1.1/10.0
- Appreciation +0.0/10.0
$199,000
🖨 Deal sheet (PDF) 📄 Offer letter ✓ Due diligence
Listing remarks
Blocks from PURDUE UNIVERSITY, Great Starter Home just in time for a booming Spring Market! 2 Beds /1.5 Bath with a huge Bonus room for Gatherings and more! NEWER ROOF is only 5 years old, NEWER SIDING and GUTTERS (July, 2021) and WATER HEATER only 3 years old! Home was converted to allow Washer/Dryer on the Main floor, (but still has hook ups in basement). Kitchen offers a central hub to the home with Hardwood Floors throughout the main part of the house. Living Room includes dining area and beautiful picture window in front. 1st bedroom has corner windows and nice size closet. 2nd bedroom is light and bright with a deep closet as well. BONUS ROOM is Awesome with room for everything and a
Key facts
- Huge bonus room
- Newer roof
- Water heater
Tags
Neighborhood map
What this means for you Summary
Snapshot
- This is a 3-bed/1.5-bath single-family listed at $199k.
Deal economics
- At list price, monthly cash flow is $141 ($2k/yr) — positive.
- The deal already cash-flows at list — no discount required.
- To meet the 1% rule (rent ≥ 1% of price), the offer needs to be $176k (11.3% below list).
- Recommended offer: $176k (11.3% below list) — sets the bar for 1% rule.
- Cap rate 7.1% vs local median 5.8% in Hammond — meaningfully above typical; check what's discounted (condition, days-on-market, listing class) to confirm the premium yield is real.
Location & tenants
- Location reads 70/100 on livability (#143 in IN) — a middle-class / working-renter tenant base. Strengths: cost of living A+, housing A+, commute A; Watch: health & safety D+, employment D, crime F.
- School City Of Hammond (suburban): math 8% / reading 18% proficiency, ranked #289 of 301 in IN (top 96%) — low school quality limits family demand, transient renter base, plan for 1-2y turnover; 74% free/reduced lunch — lower-income household profile, screen leases tightly.
- Zoned schools: Morton Elementary School (math 7% / reading 8%, grade F, #949 of 994 statewide, top 97%, 476 students, 68% FRL); Charles N Scott Middle School (math 5% / reading 15%, grade F, #314 of 330 statewide, top 95%, 738 students, 75% FRL); Morton Senior High School (math 12% / reading 54%, grade F, #290 of 369 statewide, top 79%, 1,609 students, 69% FRL) — zoned schools at 71% FRL track the district average.
- Market conditions: 62 active listings in the ZIP; 7 comparable units currently listed for rent nearby; rentals leasing fast (median 6d on market — plan ~1-2 weeks tenant-placement turnaround); 1,642 units permitted in Lake County in 2024 (14 in 5+ unit buildings).
- This rent runs 35% of the median local income ($60k/yr) — at the standard rent-burdened threshold; future hikes will face affordability resistance.
Forward outlook
- Local home prices are declining (-3.0%/yr); year-one equity from $1k of loan paydown is wiped out by about $6k of value loss. Plan a longer hold.
- Lake County population projected to shrink 7% by 2050 — rents likely to lag national; underwrite the cash flow, not the appreciation.
Negotiation context
- Only 8 days on market — expect competitive offers; lowballing is unlikely to land.
- 5 sale attempts since 21y ago with the ask held roughly flat each time — persistent listings suggest the price (not the market) is what's stuck; bring a comps-based counter.
Risks & watch-outs
- Watch-outs: built in 1953 — expect roof / HVAC / electrical / plumbing capex.
Questions for the listing agent
- Built in 1953 — when were the roof, HVAC, electrical panel, plumbing, and water heater last replaced?
- Is there a deadline driving the sale (1031 exchange, divorce, estate, relocation)? That informs how much negotiation room exists.
- Schools are F-rated, which usually means shorter tenancies and higher turnover. Who's the typical renter profile here, and what's been the actual vacancy rate?
- Crime grade is F in this area — have there been break-ins, vandalism, or insurance claims at this property in the last 3 years? What carrier currently insures it and at what premium?
- The area grade is low — what's the realistic commute time and amenity access for the typical tenant pool here? Any planned neighborhood developments (good or bad) we should know about?
- What's the average days-on-market for RENTAL listings here right now (not sales)? A rising rental-DOM trend means longer vacancies and softer asking-rent achievability than the comps imply.
- What's the recent tenant-quality profile in this submarket — average credit score on applications, eviction rate, late-payment / NSF rate, and stable-employment percentage? A property-management company in the area should have these aggregated.
- How much new for-sale + rental construction is in the pipeline within 1–3 miles? Heavy new supply typically softens prices + rents 12–24 months out; constrained supply supports both.
Investment metrics
- 1% rule
- 0.89% ✗
- Cap rate
- 7.14%
- Cash-on-cash
- 3.03%
- DSCR
- 1.13
- GRM
- 9.4
CMA / ARV
- ARV (on-the-fly)
- $194,948
- Comps found
- 12
Show comp detail 12 sales within ~0.75 mi
| Address | Dist | Beds/Ba | Sqft | Sold | Price | $/sf | Match |
|---|---|---|---|---|---|---|---|
| 7021 Osborn Ave | 0.00mi | 2/1.5 (-1) | 1,196 (0%) | 1mo | $195,000 | $163 | 94 |
| 7146 Lindberg Ave | 0.19mi | 3/1.0 | 1,116 (-7%) | 9mo | $160,000 | $143 | 71 |
| 6909 Lindberg Ave | 0.15mi | 3/1.0 | 1,092 (-9%) | 8mo | $184,000 | $168 | 69 |
| 6749 Ontario Ave | 0.36mi | 3/1.0 | 1,069 (-11%) | 0mo | $229,000 | $214 | 63 |
| 7007 Marshall Ave | 0.32mi | 3/1.0 | 1,032 (-14%) | 1mo | $209,000 | $203 | 60 |
| 7416 Alexander Ave | 0.54mi | 2/1.0 (-1) | 1,261 (+5%) | 6mo | $184,900 | $147 | 54 |
| 6824 Waveland Ave | 0.58mi | 3/1.0 | 1,116 (-7%) | 10mo | $189,000 | $169 | 52 |
| 6633 S Mccook Ave | 0.51mi | 3/1.0 | 1,053 (-12%) | 8mo | $145,000 | $138 | 47 |
| 6828 Waveland Ave | 0.57mi | 4/1.5 (+1) | 1,306 (+9%) | 9mo | $140,000 | $107 | 45 |
| 6612 Alexander Ave | 0.56mi | 2/1.0 (-1) | 1,328 (+11%) | 10mo | $102,500 | $77 | 40 |
| 7527 Marshall Ave | 0.72mi | 3/1.5 | 1,344 (+12%) | 7mo | $215,000 | $160 | 40 |
| 2021 169th St | 0.62mi | 3/1.0 | 1,027 (-14%) | 9mo | $211,000 | $205 | 38 |
Match score weights: distance 35% · size 25% · config 20% · recency 20%. Top-matched comps best support the ARV.
Projected returns pro-forma
-3.0% appreciation · 3.0% rent growth · sell at horizon
- IRR
- -11.5%
- Equity multiple
- 0.58×
- Total profit
- $-23,327
- Equity at exit
- $29,672
- IRR
- -2.4%
- Equity multiple
- 0.84×
- Total profit
- $-8,963
- Equity at exit
- $17,206
Cash invested: $55,720 (down + closing). Projections, not guarantees.
Landlord ↔ Tenant lean methodology
- Overall (STATE)
- 90 Strongly Landlord-Friendly
- State Indiana
- 90 Strongly Landlord-Friendly · R+11
- County
- — inherits STATE
- City
- — inherits STATE
ZIP-level market 46323
- Home prices YoY
- -18.8%
- Active inventory
- 62
- Price-to-rent
- 9.4×
Monthly cashflow live
- Estimated rent
- $1,764 high interval (Pro) →
- Mortgage (P&I)
- −$1,044
- Tax from tax record
- −$126 /mo · $1,516/yr
- Insurance
- −$83
- HOA
- −$0
- Vacancy / Maint / Mgmt
- −$370
- Net cashflow
- $141
Break-even live
Sensitivity live
| Price | -10% $253 | -5% $197 | +0% $141 | +5% $84 | +10% $28 |
|---|---|---|---|---|---|
| Rent | -10% $1 | -5% $71 | +0% $141 | +5% $210 | +10% $280 |
| Rate | -1.0pp $241 | -0.5pp $191 | base $141 | +0.5pp $89 | +1.0pp $37 |
UW: 25.0% down · 7.5% · 30yr · 1.5% tax · 5.0% vac · 8.0% maint · 8.0% mgmt
Financing live
Cash to close
- Down payment
- $49,750
- Closing costs
- $5,970
- Reserves months
- —
- Total cash needed
- —
Loan-product check · same deal, 3 products live
Conventional
25% down · 7.5% · 30yr
- Down + closing
- —
- Monthly P&I
- —
- Monthly cashflow
- —
- DSCR
- —
- Eligible?
- —
Personal DTI + credit; lowest rate.
DSCR
20% down · 8.5% · 30yr
- Down + closing
- —
- Monthly P&I
- —
- Monthly cashflow
- —
- DSCR
- —
- Eligible?
- —
No personal income docs; deal must DSCR.
Hard money
10% down · 12.0% · 12mo
- Down + closing
- —
- Monthly P&I
- —
- Monthly cashflow
- —
- DSCR
- —
- Eligible?
- —
Short-term bridge; refi at stabilization.
Rent comps 7 comps
| Address | Beds | Baths | Sqft | Rent | $/sqft | DOM | Units | Dist |
|---|---|---|---|---|---|---|---|---|
| 6746 Forestdale Ave Hammond, IN | 3.0 | 1.0 | 900 | $1,860 | $2.07 | 0d | 1 | 0.45mi |
| 6949 Alabama Ave Hammond, IN | 2.0 | 1.5 | 1200 | $1,795 | $1.50 | 5d | 1 | 0.46mi |
| 2723 E 165th St Unit 3 Hammond, IN | 2.0 | 1.0 | 800 | $1,350 | $1.69 | 8d | 1 | 0.73mi |
| 7019 Chestnut Ave Hammond, IN | 3.0 | 1.5 | 1440 | $1,895 | $1.32 | 22d | 1 | 1.35mi |
| 7633 Kentucky Ave Hammond, IN | 3.0 | 1.0 | 888 | $1,595 | $1.80 | 12d | 1 | 1.40mi |
| 3611 167th St Hammond, IN | 1.0–2.0 | 1.0 | 695 | $1,450 | $2.09 | 0d | 1 | 1.48mi |
| 7609 Beech Ave Hammond, IN | 2.0 | 1.0 | 700 | $1,400 | $2.00 | 5d | 1 | 1.48mi |
Listing history 10 events
-
2026-04-25status Pending
-
2026-04-17$199,000 Active
-
2026-04-13historical
-
2026-03-07price $219,900
-
2026-02-20$224,900 Active
-
2026-01-31historical
-
2026-01-29$219,900 Active
-
2005-08-15historical
-
2005-03-30$93,900
-
2005-02-14$88,900
ⓘ Source: listings_history table (triggers on properties + properties_extension) + one-shot
backfill from property_details.listing_events for pre-trigger history.
Tax reassessment forecast IN · Partial reset (capped growth)
- Current annual tax
- $1,516 · $126/mo
- Projected year-2 tax
- $1,604 · $134/mo
- Expected delta
- +$88/yr (+$7/mo · 5.8%)
ⓘ Screening estimate from a state-policy table — verify with the county assessor before closing.
Climate risk First Street
- Flood 3/10 Moderate FEMA zone X (unshaded) · 20% chance over 30 yrs
- Wildfire 1/10 Low
- Heat 3/10 Moderate 7 d/yr ≥102°F today · 15 d/yr by 30 yrs out
- Wind 2/10 Low 100% chance of damaging wind over 30 yrs
- Air quality 4/10 Moderate 5 unhealthy d/yr today · 6 by 30 yrs out
Nearby sold comps map
Loading sold comps map…
Walkable amenities ~0.75 mi
Loading nearby amenities…
Taxation est. · year 1
- Rental income
- $21,170
- − Mortgage interest
- −$11,147
- − Property taxes
- −$1,516
- − Insurance
- −$995
- − Repairs & maintenance
- −$1,694
- − Management
- −$1,694
- − Depreciation
- −$5,789
- Taxable loss
- −$1,665
- Est. tax savings @ 24.0%
- +$400
- After-tax cash flow
- $2,089/yr
For passive investors: Depreciation is non-cash, so a rental often shows a tax loss while cash-flowing — sheltering income. Rental losses are passive: they offset passive income freely, and up to $25,000/yr can offset ordinary (W-2) income if you actively participate and your MAGI is under $100k (phasing out to $0 by $150k); unused losses carry forward. On sale, claimed depreciation is recaptured at up to 25%, and gains may owe capital-gains tax (a 1031 exchange can defer both). Figures are a year-1 estimate at your 24.0% rate — not tax advice; consult a CPA.
Schools (NCES district)
- District
- School City Of Hammond
- NCES district ID
- 1804320
- Math proficiency
- 8% ▼ -18.00%
- Reading proficiency
- 18% ▼ -15.00%
- Median HH income
- $39,970
- Composite
- 11.11/100
- National rank
- #9730
- State rank
- #289 of 301 in IN
Livability — Hammond
- Score
- 70/100
- State rank
- #143
- US rank
- #7343
Category grades
Schools grade is shown separately in the Schools card above.
Census & demographics
- Census place
- Hammond, IN
- County
- Lake County · 422,878 people
- City population
- 58,809
- Metro
- Chicago-Naperville-Elgin, IL-IN-WI
- Population (ZIP)
- 23,047
- Household income
- $59,688
- Rent vs Own
- Severe rent burden
- 692.0
Population outlook (Lake County) Hauer SSP2
- Today (2025)
- 484,026 people
- By 2030
- 478,091 · -1.2%
- By 2040
- 462,974 · -4.3%
- By 2050
- 449,894 · -7.1%
- By 2075
- 436,169 · -9.9%
- By 2100
- 426,607 · -11.9%
Race, ethnicity, and origin ACS 2023
- Neighborhood character
- Diverse neighborhood (Simpson 0.68)
- Race & ethnicity
- Hispanic / Latino 38% White 36% Black 21% Two or more races 12% Asian 2% Native American 1%
- Hispanic origin (detail)
- Mexican 29% Puerto Rican 7%
- Common ancestry
- Romanian 6% Italian 2% Lithuanian 1%
- Foreign-born
- 8% · Canada, China
- Languages at home
- 78% English-only · Spanish 19% Chinese 1%
Political lean MEDSL · Lake
- 2024 margin
- Lean D (+5.6) · D 52.1% · R 46.5% · Other 1.5%
- 2008→2024 swing
- -28.6pp toward R · 2008: 34.3pp · 2024: 5.6pp
- All cycles
- 2024: D+5.6 2020: D+15.1 2016: D+20.6 2012: D+31.0 2008: D+34.3
Not yet ingested
- Civics
- —
Market trends
- HPI YoY
- ▼ -67.70%
- Current HPI
- 293.4702
- Rent YoY
- —
- Metro
- Chicago-Naperville-Elgin, IL-IN-WI
- State GDP YoY
- ▲ 2.90%
- F500 in state
- 18
Industry mix (Fortune 500 HQ in IN)
| Industry | F500 HQs | Revenue |
|---|---|---|
| Industrial Machinery | 2 | $37B |
|
||
| Healthcare | 1 | $177B |
|
||
| Pharmaceuticals | 1 | $45B |
|
||
| Metals / Steel | 1 | $18B |
|
||
| Agriculture | 1 | $17B |
|
||
| Packaging | 1 | $12B |
|
||
Price history
+123.8% since first listed10 events — show timeline
- 2026-04-25 Pending — NIRA MLS as Distributed by MLS Grid
- 2026-04-17 Listed $199,000 NIRA MLS as Distributed by MLS Grid
- 2026-04-13 Listing Removed — NIRA MLS as Distributed by MLS Grid
- 2026-03-07 Price Changed $219,900 NIRA MLS as Distributed by MLS Grid
- 2026-02-20 Listed $224,900 NIRA MLS as Distributed by MLS Grid
- 2026-01-31 Listing Removed — NIRA MLS as Distributed by MLS Grid
- 2026-01-29 Listed $219,900 NIRA MLS as Distributed by MLS Grid
- 2005-08-15 Listing Removed — NIRA MLS as Distributed by MLS Grid
- 2005-03-30 Listed $93,900 NIRA MLS as Distributed by MLS Grid
- 2005-02-14 Listed $88,900 NIRA MLS as Distributed by MLS Grid
Property tax history
+4.1%/yrLatest (2024): $1,516 · -4.4% YoY. Source: county tax records.
Cash-flow waterfall
monthlySold comps — $/sqft
last 12 mo · ≤1 miLoading sold comps…