239 Lincalis St · West Hazleton, PA
Flood risk 1/10 · Minimal
- FEMA flood zone
- X (unshaded)
- Chance of flooding over 30 yrs
- 0.0%
- Est. flood insurance / yr
- $507 – $1,088
Fire risk 3/10 · Minor
- Est. fire insurance / yr
- $511 – $949
Heat risk 3/10 · Minor
- Hot days now (above 91°F)
- 7 days/yr
- Hot days in 30 yrs
- 15 days/yr
Wind risk 4/10 · Minor
- Chance of severe wind over 30 yrs
- 8.0%
Air-quality risk 2/10 · Minimal
- Unhealthy air days now
- 1 days/yr
- Unhealthy air days in 30 yrs
- 2 days/yr
Risk factors via First Street. Map © Google.
Why this score? — see what drove the C- grade
The composite is a weighted blend of 9 inputs, each scored 0–100. Each bar is that input's sub-score; the figure is the points it added to the 100-point composite (weight × sub-score).
- Cash flow +19.7/30.0
- Appreciation +10.0/10.0
- DSCR +6.2/10.0
- 1% rule +5.2/10.0
- Livability +3.3/5.0
- ARV discount +2.9/15.0
- Rent growth +2.5/5.0
- Condition / age +2.2/5.0
- Schools +2.0/10.0
$179,900
🖨 Deal sheet 📄 Offer letter ✓ Due diligence
Listing remarks MLS
Two-Story Single-Family Home for Sale in West Hazleton! Three Bedrooms, One Full Bathroom, Kitchen, Livingroom, Dining Room, First Floor Laundry Room, Oil Heat, Brick Front Porch, Full Unfinished Basement with Concrete Floor, Wooden Deck and Fenced-In Yard. Call for a Showing Today! LQQK
Key facts
- Brick front porch
- Two-story
- Wooden deck
Tags
Neighborhood map
What this means for you Summary
Snapshot
- This is a 3-bed/1.0-bath single-family listed at $180k. Condition is rated fair.
Deal economics
- At list price, monthly cash flow is $210 ($3k/yr) — positive.
- The deal already cash-flows at list — no discount required.
- Meets the 1% rule at list price ($2k rent vs $180k).
- Recommended offer: $164k (9.0% below list) — sets the bar for market timing.
- Cap rate 7.7% vs local median 5.6% in West Hazleton — top-decile yield for the area; either an underpriced asset or a hidden risk that comps aren't pricing in. Stress-test before assuming the spread holds.
Location & tenants
- Location reads 66/100 on livability (#1,036 in PA) — a middle-class / working-renter tenant base. Strengths: cost of living A+, housing A+, health & safety A-; Watch: schools F, amenities F, commute F.
- Hazleton Area SD (suburban): math 18% / reading 30% proficiency, ranked #476 of 539 in PA (top 88%) — low school quality limits family demand, transient renter base, plan for 1-2y turnover.
- Market conditions: 270 active listings in the ZIP; 1 comparable units currently listed for rent nearby; 349 units permitted in Luzerne County in 2024 (16 in 5+ unit buildings).
- This rent runs 40% of the median local income ($55k/yr) — at the standard rent-burdened threshold; future hikes will face affordability resistance.
Forward outlook
- In year one you build about $19k of equity ($1k loan paydown + $18k appreciation (10.0% local appreciation)).
- Luzerne County population projected at +4% by 2050 — modest demand growth; plan on rents tracking national, not racing it.
- At projected returns (10.0% appreciation + 3.0% rent growth), your $50k cash investment doubles in ~3 years — after that, you're playing with house money.
- By year 2, paydown + projected appreciation supports a ~$31k cash-out refi (75% LTV) — recoverable capital for the next deal without selling this one.
Negotiation context
- It's been on market 103 days — a 9% lower offer ($164k) is reasonable based on typical stale-listing flexibility.
- 2 sale attempts since 7y ago; this cycle's ask has dropped $10k (5%) from the opening price — seller is motivated, your offer sets the floor, not the list.
- Current owner paid $80k; list at $180k implies a 125% gain — meaningful room to come down on a strong offer.
Questions for the listing agent
- It's been on market 103 days. Have you received any prior offers? Is the seller open to a 9% concession, seller financing, or rate buy-down credit?
- Have any recent inspections been done? Can we get a copy of the seller's disclosures and any deferred-maintenance estimates?
- Why hasn't it sold? Are there any deal-killer items the seller is aware of (foundation, flood, title, zoning, code violations)?
- Is there a deadline driving the sale (1031 exchange, divorce, estate, relocation)? That informs how much negotiation room exists.
- Schools are F-rated, which usually means shorter tenancies and higher turnover. Who's the typical renter profile here, and what's been the actual vacancy rate?
- What's the average days-on-market for RENTAL listings here right now (not sales)? A rising rental-DOM trend means longer vacancies and softer asking-rent achievability than the comps imply.
- What's the recent tenant-quality profile in this submarket — average credit score on applications, eviction rate, late-payment / NSF rate, and stable-employment percentage? A property-management company in the area should have these aggregated.
- How much new for-sale + rental construction is in the pipeline within 1–3 miles? Heavy new supply typically softens prices + rents 12–24 months out; constrained supply supports both.
Investment metrics
- 1% rule
- 1.02% ✓
- Cap rate
- 7.69%
- Cash-on-cash
- 5.00%
- DSCR
- 1.22
- GRM
- 8.1
CMA / ARV
- ARV (median comp)
- $163,085
- List price
- $179,900
- Delta
- 10.31%
- Verdict
- OVERPRICED
- Comps
- 20 within 1.0 mi
Show comp detail 12 sales within ~0.75 mi
| Address | Dist | Beds/Ba | Sqft | Sold | Price | $/sf | Match |
|---|---|---|---|---|---|---|---|
| 329 Ridge Ave | 0.11mi | 2/2.0 (-1) | 1,280 (-4%) | 4mo | $150,000 | $117 | 76 |
| 307 Green St | 0.06mi | 4/1.0 (+1) | 1,470 (+10%) | 3mo | $165,000 | $112 | 73 |
| 536 Green St | 0.28mi | 3/1.0 | 1,200 (-10%) | 3mo | $215,000 | $179 | 68 |
| 13 Branch St | 0.28mi | 3/1.0 | 1,215 (-9%) | 6mo | $120,000 | $99 | 67 |
| 304 Green St | 0.04mi | 4/1.0 (+1) | 1,138 (-15%) | 2mo | $220,000 | $193 | 66 |
| 16 Third St | 0.42mi | 3/1.0 | 1,435 (+8%) | 3mo | $76,000 | $53 | 66 |
| 711 Boundary St | 0.44mi | 3/2.0 | 1,240 (-7%) | 6mo | $154,000 | $124 | 59 |
| 927 Winters Ave | 0.63mi | 2/1.0 (-1) | 1,300 (-2%) | 5mo | $129,000 | $99 | 57 |
| 667 Roosevelt St | 0.48mi | 3/1.0 | 1,488 (+12%) | 3mo | $180,000 | $121 | 56 |
| 529 Putnam St | 0.51mi | 3/1.0 | 1,213 (-9%) | 8mo | $250,000 | $206 | 54 |
| 763 Mcnair St | 0.47mi | 3/1.0 | 1,520 (+14%) | 2mo | $230,000 | $151 | 53 |
| 675 Lincoln St | 0.66mi | 3/1.0 | 1,200 (-10%) | 6mo | $128,000 | $107 | 48 |
Match score weights: distance 35% · size 25% · config 20% · recency 20%. Top-matched comps best support the ARV.
Projected returns pro-forma
10.0% appreciation · 3.0% rent growth · sell at horizon
- IRR
- 27.9%
- Equity multiple
- 3.21×
- Total profit
- $111,383
- Equity at exit
- $162,068
- IRR
- 24.3%
- Equity multiple
- 7.30×
- Total profit
- $317,541
- Equity at exit
- $349,506
Cash invested: $50,372 (down + closing). Projections, not guarantees.
Landlord ↔ Tenant lean methodology
- Overall (STATE)
- 62 Landlord-Friendly
- State Pennsylvania
- 62 Landlord-Friendly · EVEN
- County
- — inherits STATE
- City
- — inherits STATE
ZIP-level market 18202
- Home prices YoY
- 7.1%
- Active inventory
- 270
- Price-to-rent
- 8.1×
Monthly cashflow live
- Estimated rent
- $1,840 medium interval (Pro) →
- Mortgage (P&I)
- −$943
- Tax est. 1.5%
- −$225 /mo · $2,698/yr
- Insurance
- −$75
- HOA
- −$0
- Vacancy / Maint / Mgmt
- −$386
- Net cashflow
- $210
Break-even live
UW: 25.0% down · 7.5% · 30yr · 1.5% tax · 5.0% vac · 8.0% maint · 8.0% mgmt
Financing live
Cash to close
- Down payment
- $44,975
- Closing costs
- $5,397
- Reserves months
- —
- Total cash needed
- —
Loan-product check · same deal, 3 products live
Conventional
25% down · 7.5% · 30yr
- Down + closing
- —
- Monthly P&I
- —
- Monthly cashflow
- —
- DSCR
- —
- Eligible?
- —
Personal DTI + credit; lowest rate.
DSCR
20% down · 8.5% · 30yr
- Down + closing
- —
- Monthly P&I
- —
- Monthly cashflow
- —
- DSCR
- —
- Eligible?
- —
No personal income docs; deal must DSCR.
Hard money
10% down · 12.0% · 12mo
- Down + closing
- —
- Monthly P&I
- —
- Monthly cashflow
- —
- DSCR
- —
- Eligible?
- —
Short-term bridge; refi at stabilization.
Rent comps 1 comps
| Address | Beds | Baths | Sqft | Rent | $/sqft | DOM | Units | Dist |
|---|---|---|---|---|---|---|---|---|
| 1015 Lincoln St Hazleton, PA | 2.0 | 1.0 | 900 | $1,499 | $1.67 | 44d | 1 | 0.99mi |
Listing history 5 events
-
2026-05-05status Pending 288-char remark
Show marketing remark (288 chars)
Two-Story Single-Family Home for Sale in West Hazleton! Three Bedrooms, One Full Bathroom, Kitchen, Livingroom, Dining Room, First Floor Laundry Room, Oil Heat, Brick Front Porch, Full Unfinished Basement with Concrete Floor, Wooden Deck and Fenced-In Yard. Call for a Showing Today! LQQK
-
2026-04-27price $179,900 288-char remark
Show marketing remark (288 chars)
Two-Story Single-Family Home for Sale in West Hazleton! Three Bedrooms, One Full Bathroom, Kitchen, Livingroom, Dining Room, First Floor Laundry Room, Oil Heat, Brick Front Porch, Full Unfinished Basement with Concrete Floor, Wooden Deck and Fenced-In Yard. Call for a Showing Today! LQQK
-
2026-01-22$189,900 Active 288-char remark
Show marketing remark (288 chars)
Two-Story Single-Family Home for Sale in West Hazleton! Three Bedrooms, One Full Bathroom, Kitchen, Livingroom, Dining Room, First Floor Laundry Room, Oil Heat, Brick Front Porch, Full Unfinished Basement with Concrete Floor, Wooden Deck and Fenced-In Yard. Call for a Showing Today! LQQK
-
2019-10-15soldstatus $80,000 131-char remark
Show marketing remark (131 chars)
Move in home with plenty of room, remodeled bathroom, maintenance free exterior, fenced yard and outside relaxing deck and hot tub.
-
2019-04-11$89,900 131-char remark
Show marketing remark (131 chars)
Move in home with plenty of room, remodeled bathroom, maintenance free exterior, fenced yard and outside relaxing deck and hot tub.
ⓘ Source: listings_history table (triggers on properties + properties_extension) + one-shot
backfill from property_details.listing_events for pre-trigger history.
Climate risk First Street
- Flood 1/10 Low FEMA zone X (unshaded) · 0% chance over 30 yrs
- Wildfire 3/10 Moderate
- Heat 3/10 Moderate 7 d/yr ≥91°F today · 15 d/yr by 30 yrs out
- Wind 4/10 Moderate 8% chance of damaging wind over 30 yrs
- Air quality 2/10 Low 1 unhealthy d/yr today · 2 by 30 yrs out
Nearby sold comps map
Loading sold comps map…
Walkable amenities ~0.75 mi
Loading nearby amenities…
Taxation est. · year 1
- Rental income
- $22,075
- − Mortgage interest
- −$10,077
- − Property taxes
- −$2,698
- − Insurance
- −$900
- − Repairs & maintenance
- −$1,766
- − Management
- −$1,766
- − Depreciation
- −$5,233
- Taxable loss
- −$365
- Est. tax savings @ 24.0%
- +$88
- After-tax cash flow
- $2,608/yr
For passive investors: Depreciation is non-cash, so a rental often shows a tax loss while cash-flowing — sheltering income. Rental losses are passive: they offset passive income freely, and up to $25,000/yr can offset ordinary (W-2) income if you actively participate and your MAGI is under $100k (phasing out to $0 by $150k); unused losses carry forward. On sale, claimed depreciation is recaptured at up to 25%, and gains may owe capital-gains tax (a 1031 exchange can defer both). Figures are a year-1 estimate at your 24.0% rate — not tax advice; consult a CPA.
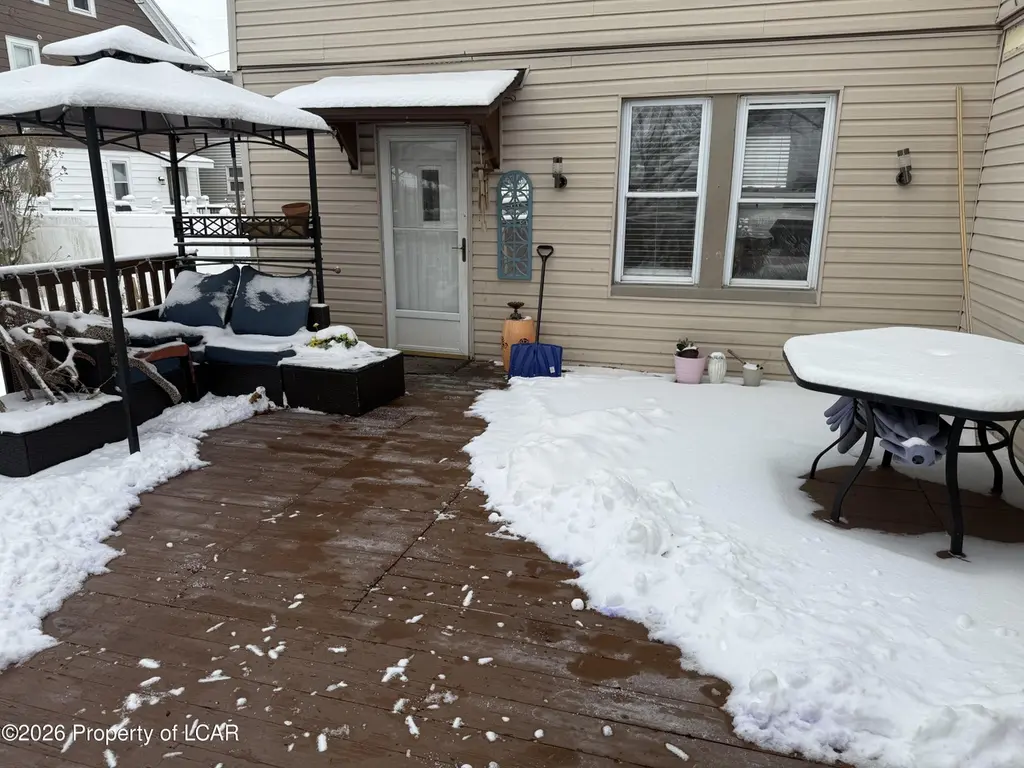
Condition & rehab AI · 12 photos
The home requires snow removal and cleaning of the kitchen and bathroom to improve its fair condition and increase its resale and rental value.
Repairs flagged
- Major Snow removal — Snow covering the deck and patio
- Minor Kitchen cleaning — Cluttered countertops
- Minor Bathroom cleaning — Cluttered countertops
Value-add opportunities
- Both Snow removal — Clearing snow improves both resale and rental appeal
- Resale Kitchen cleaning — A clean kitchen enhances the home's appeal
- Resale Bathroom cleaning — A clean bathroom enhances the home's appeal
Renovation cost estimate screening
| Repair item | Severity | Est. cost |
|---|---|---|
| Snow removal · Snow covering the deck and patio | Major | $15,000–50,000 |
| Kitchen cleaning · Cluttered countertops | Minor | $500–3,000 |
| Bathroom cleaning · Cluttered countertops | Minor | $500–3,000 |
| Total estimated repair cost · 3 items | $16,000–56,000 |
Value-add ROI direction
- Both Snow removal — Clearing snow improves both resale and rental appeal ↑
- Resale Kitchen cleaning — A clean kitchen enhances the home's appeal ↑
- Resale Bathroom cleaning — A clean bathroom enhances the home's appeal ↑
ⓘ Cost ranges are severity-bucket heuristics (US national rule-of-thumb). Get contractor quotes + a written scope before underwriting a rehab budget.
Schools (NCES district)
- District
- Hazleton Area SD
- NCES district ID
- 4211700
- Math proficiency
- 18% ▼ -3.00%
- Reading proficiency
- 30% ▼ -15.00%
- Median HH income
- $42,247
- Composite
- 20.44/100
- National rank
- #8582
- State rank
- #476 of 539 in PA
Livability — West Hazleton
- Score
- 66/100
- State rank
- #1036
- US rank
- #11561
Category grades
Schools grade is shown separately in the Schools card above.
Census & demographics
- Census place
- West Hazleton, PA
- County
- Luzerne County · 118,885 people
- Metro
- Scranton--Wilkes-Barre, PA
- Population (ZIP)
- 13,755
- Household income
- $55,153
- Rent vs Own
- Severe rent burden
- 369.0
Population outlook (Luzerne County) Hauer SSP2
- Today (2025)
- 319,505 people
- By 2030
- 319,943 · +0.1%
- By 2040
- 322,643 · +1.0%
- By 2050
- 330,817 · +3.5%
- By 2075
- 379,145 · +18.7%
- By 2100
- 431,908 · +35.2%
Race, ethnicity, and origin ACS 2023
- Neighborhood character
- Majority White (61%)
- Race & ethnicity
- White 61% Hispanic / Latino 33% Two or more races 9% Black 1% Pacific Islander 1%
- Hispanic origin (detail)
- Mexican 2% Puerto Rican 3% Dominican 22%
- Common ancestry
- Romanian 13% Iranian 1% Lithuanian 1%
- Foreign-born
- 18% · Canada, Jamaica
- Languages at home
- 71% English-only · Spanish 26% Russian/Polish/Slavic 1% Other Indo-European 1%
Political lean MEDSL · Luzerne
- 2024 margin
- R (+19.2) · D 40.0% · R 59.2%
- 2008→2024 swing
- -27.6pp toward R · 2008: 8.4pp · 2024: -19.2pp
- All cycles
- 2024: R+19.2 2020: R+14.4 2016: R+19.6 2012: D+4.8 2008: D+8.4
Not yet ingested
- Civics
- —
Market trends
- HPI YoY
- ▲ 20.19%
- Current HPI
- 306.1029
- Rent YoY
- —
- Metro
- Scranton--Wilkes-Barre, PA
- State GDP YoY
- ▲ 1.68%
- F500 in state
- 34
Industry mix (Fortune 500 HQ in PA)
| Industry | F500 HQs | Revenue |
|---|---|---|
| Healthcare | 2 | $309B |
|
||
| Insurance | 2 | $27B |
|
||
| Telecommunications / Media | 1 | $124B |
|
||
| Industrial Distribution | 1 | $22B |
|
||
| Financial Services | 1 | $20B |
|
||
| Chemicals / Materials | 1 | $18B |
|
||
Price history
+100.1% since first listed5 events — show timeline
- 2026-05-05 Pending — LCAR
- 2026-04-27 Price Changed $179,900 LCAR
- 2026-01-22 Listed $189,900 LCAR
- 2019-10-15 Sold (MLS) $80,000 LCAR
- 2019-04-11 Listed $89,900 LCAR
Cash-flow waterfall
monthlySold comps — $/sqft
last 12 mo · ≤1 miLoading sold comps…