 🔨 Auction
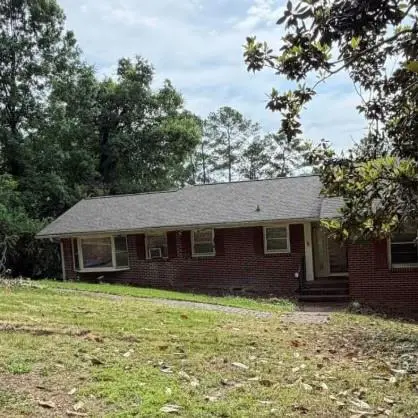
3 Briarcliff Rd SE · Rome, GA
Flood risk No data
- FEMA flood zone
- —
- Chance of flooding over 30 yrs
- —
- Est. flood insurance / yr
- —
Fire risk No data
- Est. fire insurance / yr
- —
Heat risk No data
- Hot days now (above threshold)
- —
- Hot days in 30 yrs
- —
Wind risk No data
- Chance of severe wind over 30 yrs
- —
Air-quality risk No data
- Unhealthy air days now
- —
- Unhealthy air days in 30 yrs
- —
Risk factors via First Street. Map © Google.
Why this score? — see what drove the F grade
The composite is a weighted blend of 9 inputs, each scored 0–100. Each bar is that input's sub-score; the figure is the points it added to the 100-point composite (weight × sub-score).
- ARV discount +7.5/15.0
- Cash flow +4.7/30.0
- Rent growth +4.1/5.0
- Livability +3.2/5.0
- Schools +2.3/10.0
- Condition / age +2.2/5.0
- 1% rule +0.6/10.0
- DSCR +0.0/10.0
- Appreciation +0.0/10.0
$1
🖨 Deal sheet 📄 Offer letter ✓ Due diligence
Listing remarks
The auction will be held on Saturday, May 30, at 11 am
Key facts
- 0.46 acre lot
- 2 parking spots
- Built 1956
Property features AI
Exterior
- Parking: Two parking spaces; Driveway; Parking pad; Open parking available
- Utilities: Public water; Public sewer; 220-volt electric service; Cable available; Electricity available; Natural gas available; Phone available
- Home design: Two-story home; Brick on all four sides; Resale property
- Construction: Block foundation; Composition/shingle roof
- Exterior features: Private yard; Private entrance; Exterior lighting; Rain gutters; Patio
Interior
- Kitchen: White cabinets; Laminate countertops; Pantry; Electric range; Dishwasher
- Bedrooms: Three main-level bedrooms; Primary suite on the main level
- Flooring: Hardwood floors
- Bathrooms: Two full bathrooms; Master bathroom with tub/shower combination
- Heating & cooling: Hot water heating; Window air conditioning units
- Interior features: Disappearing attic stairs; High-speed internet; Wood-framed windows; No shared/common walls; Unfinished basement
- Laundry & utility: Main-level laundry closet; Electric dryer hookup; Electric water heater
Neighborhood map
What this means for you Summary
Snapshot
- This is a 3-bed/3.5-bath single-family listed at $1. Condition is rated fair.
Deal economics
- At list price, monthly cash flow is $-885 ($-11k/yr) — negative.
- The deal already cash-flows at list — no discount required.
- Meets the 1% rule at list price ($2k rent vs $1).
Location & tenants
- Location reads 64/100 on livability (#266 in GA) — a middle-class / working-renter tenant base. Strengths: cost of living A+, housing A+, health & safety A+; Watch: crime F, amenities F, commute F.
- Rome City (urban): math 27% / reading 29% proficiency, ranked #112 of 174 in GA (top 64%) — low school quality limits family demand, transient renter base, plan for 1-2y turnover; 71% free/reduced lunch — lower-income household profile, screen leases tightly.
- Zoned schools: East Central Elementary School (math 42% / reading 41%, grade F, #402 of 1,228 statewide, top 33%, 546 students, 54% FRL); Rome Middle School (math 32% / reading 35%, grade F, #206 of 470 statewide, top 45%, 966 students, 55% FRL); Rome High School (math 12% / reading 15%, grade F, #325 of 424 statewide, top 78%, 2,095 students, 66% FRL).
- Market conditions: Rents rising fast (+6.3%/yr); 411 active listings in the ZIP; 2 comparable units currently listed for rent nearby; 355 units permitted in Floyd County in 2024 (0 in 5+ unit buildings).
- This rent runs 39% of the median local income ($62k/yr) — at the standard rent-burdened threshold; future hikes will face affordability resistance.
Forward outlook
- Local home prices are declining (-3.0%/yr); year-one equity from $2k of loan paydown is wiped out by about $11k of value loss. Plan a longer hold.
- Floyd County population projected to shrink 6% by 2050 — rents likely to lag national; underwrite the cash flow, not the appreciation.
Negotiation context
- Only 10 days on market — expect competitive offers; lowballing is unlikely to land.
Risks & watch-outs
- Watch-outs: property tax is 533878.5% of price; built in 1956 — expect roof / HVAC / electrical / plumbing capex.
Questions for the listing agent
- What do current leases actually rent for vs. the listed asking? Can we see a recent rent roll and the last 12 months of T-12 income?
- Have any recent inspections been done? Can we get a copy of the seller's disclosures and any deferred-maintenance estimates?
- Built in 1956 — when were the roof, HVAC, electrical panel, plumbing, and water heater last replaced?
- Property tax is high relative to price — has the assessment been appealed recently, and will the sale trigger a re-assessment?
- Is there a deadline driving the sale (1031 exchange, divorce, estate, relocation)? That informs how much negotiation room exists.
- Schools are F-rated, which usually means shorter tenancies and higher turnover. Who's the typical renter profile here, and what's been the actual vacancy rate?
- Crime grade is F in this area — have there been break-ins, vandalism, or insurance claims at this property in the last 3 years? What carrier currently insures it and at what premium?
- The area grade is low — what's the realistic commute time and amenity access for the typical tenant pool here? Any planned neighborhood developments (good or bad) we should know about?
- What's the average days-on-market for RENTAL listings here right now (not sales)? A rising rental-DOM trend means longer vacancies and softer asking-rent achievability than the comps imply.
- What's the recent tenant-quality profile in this submarket — average credit score on applications, eviction rate, late-payment / NSF rate, and stable-employment percentage? A property-management company in the area should have these aggregated.
- How much new for-sale + rental construction is in the pipeline within 1–3 miles? Heavy new supply typically softens prices + rents 12–24 months out; constrained supply supports both.
Investment metrics
- 1% rule
- 0.56% ✗
- Cap rate
- 3.31%
- Cash-on-cash
- -10.66%
- DSCR
- 0.53
- GRM
- 14.9
CMA / ARV
- ARV (on-the-fly)
- $355,919
- Comps found
- 12
Show comp detail 12 sales within ~0.75 mi
| Address | Dist | Beds/Ba | Sqft | Sold | Price | $/sf | Match |
|---|---|---|---|---|---|---|---|
| 13 Townview Rd SE | 0.31mi | 3/3.0 | 2,197 (-3%) | 4mo | $260,000 | $118 | 75 |
| 14 Gables Dr | 0.08mi | 4/3.0 (+1) | 2,097 (-8%) | 5mo | $330,000 | $157 | 73 |
| 31 Riverview Rd SE | 0.31mi | 4/2.5 (+1) | 2,239 (-1%) | 12mo | $325,000 | $145 | 64 |
| 8 Vassar Dr | 0.24mi | 3/2.0 | 2,138 (-6%) | 15mo | $337,000 | $158 | 61 |
| 811 Collinwood Rd | 0.33mi | 3/2.5 | 2,515 (+11%) | 3mo | $413,000 | $164 | 60 |
| 1 Joe Louis Blvd SE | 0.50mi | 4/2.0 (+1) | 2,304 (+2%) | 4mo | $61,000 | $26 | 59 |
| 8 Crestview Ln SE | 0.15mi | 4/2.0 (+1) | 1,943 (-14%) | 5mo | $240,000 | $124 | 54 |
| 507 E 10th St E | 0.37mi | 3/2.5 | 2,108 (-7%) | 16mo | $330,000 | $157 | 54 |
| 1001 Highland Ave | 0.40mi | 4/3.5 (+1) | 2,476 (+9%) | 14mo | $380,000 | $153 | 49 |
| 411 Cooper Dr | 0.74mi | 3/3.5 | 2,578 (+14%) | 8mo | $455,000 | $176 | 36 |
| 418 E 8th St SE | 0.55mi | 3/2.0 | 1,942 (-14%) | 10mo | $369,900 | $190 | 36 |
| 16 Benvenue Dr | 0.50mi | 3/2.0 | 1,933 (-15%) | 17mo | $345,000 | $178 | 32 |
Match score weights: distance 35% · size 25% · config 20% · recency 20%. Top-matched comps best support the ARV.
Projected returns pro-forma
-3.0% appreciation · 6.28% rent growth · sell at horizon
- IRR
- -32.1%
- Equity multiple
- -0.08×
- Total profit
- $-107,228
- Equity at exit
- $53,069
- IRR
- -24.4%
- Equity multiple
- -0.36×
- Total profit
- $-136,023
- Equity at exit
- $30,773
Cash invested: $99,657 (down + closing). Projections, not guarantees.
Landlord ↔ Tenant lean methodology
- Overall (STATE)
- 90 Strongly Landlord-Friendly
- State Georgia
- 90 Strongly Landlord-Friendly · R+3
- County
- — inherits STATE
- City
- — inherits STATE
ZIP-level market 30161
- Rents YoY
- 6.3%
- Active inventory
- 411
Monthly cashflow live
- Estimated rent
- $1,993 medium interval (Pro) →
- Mortgage (P&I)
- −$1,866
- Tax est. 1.5%
- −$445 /mo · $5,339/yr
- Insurance
- −$148
- HOA
- −$0
- Vacancy / Maint / Mgmt
- −$419
- Net cashflow
- $-885
Break-even live
UW: 25.0% down · 7.5% · 30yr · 1.5% tax · 5.0% vac · 8.0% maint · 8.0% mgmt
Financing live
Cash to close
- Down payment
- $88,980
- Closing costs
- $10,678
- Reserves months
- —
- Total cash needed
- —
Loan-product check · same deal, 3 products live
Conventional
25% down · 7.5% · 30yr
- Down + closing
- —
- Monthly P&I
- —
- Monthly cashflow
- —
- DSCR
- —
- Eligible?
- —
Personal DTI + credit; lowest rate.
DSCR
20% down · 8.5% · 30yr
- Down + closing
- —
- Monthly P&I
- —
- Monthly cashflow
- —
- DSCR
- —
- Eligible?
- —
No personal income docs; deal must DSCR.
Hard money
10% down · 12.0% · 12mo
- Down + closing
- —
- Monthly P&I
- —
- Monthly cashflow
- —
- DSCR
- —
- Eligible?
- —
Short-term bridge; refi at stabilization.
Rent comps 2 comps
| Address | Beds | Baths | Sqft | Rent | $/sqft | DOM | Units | Dist |
|---|---|---|---|---|---|---|---|---|
| 93 Chateau Dr SE Rome, GA | 4.0 | 3.0 | 1911 | $2,400 | $1.26 | 43d | 1 | 1.05mi |
| 77 Chateau Dr SE Rome, GA | 4.0 | 3.0 | 1911 | $2,400 | $1.26 | 43d | 1 | 1.05mi |
Listing history 2 events
-
2026-05-30days on market $1 Active 10 DOM
-
2026-05-20$1 Active
ⓘ Source: listings_history table (triggers on properties + properties_extension) + one-shot
backfill from property_details.listing_events for pre-trigger history.
Nearby sold comps map
Loading sold comps map…
Walkable amenities ~0.75 mi
Loading nearby amenities…
Taxation est. · year 1
- Rental income
- $23,916
- − Mortgage interest
- −$19,937
- − Property taxes
- −$5,339
- − Insurance
- −$1,780
- − Repairs & maintenance
- −$1,913
- − Management
- −$1,913
- − Depreciation
- −$10,354
- Taxable loss
- −$17,320
- Est. tax savings @ 24.0%
- +$4,157
- After-tax cash flow
- $-6,465/yr
For passive investors: Depreciation is non-cash, so a rental often shows a tax loss while cash-flowing — sheltering income. Rental losses are passive: they offset passive income freely, and up to $25,000/yr can offset ordinary (W-2) income if you actively participate and your MAGI is under $100k (phasing out to $0 by $150k); unused losses carry forward. On sale, claimed depreciation is recaptured at up to 25%, and gains may owe capital-gains tax (a 1031 exchange can defer both). Figures are a year-1 estimate at your 24.0% rate — not tax advice; consult a CPA.
Condition & rehab AI · 2 photos
The property requires moderate renovations, focusing on exterior and interior painting, and vegetation pruning to improve its curb appeal and value.
Repairs flagged
- Major exterior paint — Peeling paint on the brick
- Minor vegetation — Overgrown vegetation
Value-add opportunities
- Both paint exterior and interior — Enhances curb appeal and interior aesthetics
- Both prune vegetation — Improves curb appeal and safety
Renovation cost estimate screening
| Repair item | Severity | Est. cost |
|---|---|---|
| exterior paint · Peeling paint on the brick | Major | $15,000–50,000 |
| vegetation · Overgrown vegetation | Minor | $500–3,000 |
| Total estimated repair cost · 2 items | $15,500–53,000 |
Value-add ROI direction
- Both paint exterior and interior — Enhances curb appeal and interior aesthetics ↑
- Both prune vegetation — Improves curb appeal and safety ↑
ⓘ Cost ranges are severity-bucket heuristics (US national rule-of-thumb). Get contractor quotes + a written scope before underwriting a rehab budget.
Schools (NCES district)
- District
- Rome City
- NCES district ID
- 1304440
- Math proficiency
- 27% ▼ -14.00%
- Reading proficiency
- 29% ▼ -4.00%
- Median HH income
- $34,889
- Composite
- 23.1/100
- National rank
- #7963
- State rank
- #112 of 174 in GA
Livability — Rome
- Score
- 64/100
- State rank
- #266
- US rank
- #14459
Category grades
Schools grade is shown separately in the Schools card above.
Census & demographics
- Census place
- Rome, GA
- County
- Floyd County · 77,706 people
- City population
- 77,706
- Metro
- Rome, GA
- Population (ZIP)
- 34,705
- Household income
- $61,667
- Rent vs Own
- Severe rent burden
- 1104.0
Population outlook (Floyd County) Hauer SSP2
- Today (2025)
- 96,321 people
- By 2030
- 95,532 · -0.8%
- By 2040
- 93,332 · -3.1%
- By 2050
- 90,850 · -5.7%
- By 2075
- 84,989 · -11.8%
- By 2100
- 76,097 · -21.0%
Race, ethnicity, and origin ACS 2023
- Neighborhood character
- Predominantly White (68%)
- Race & ethnicity
- White 68% Black 20% Hispanic / Latino 7% Two or more races 6% Asian 1%
- Hispanic origin (detail)
- Mexican 2%
- Common ancestry
- Slovak 3% Serbian 2% Italian 2%
- Foreign-born
- 5% · Canada
- Languages at home
- 91% English-only · Spanish 5% Other Indo-European 1%
Political lean MEDSL · Floyd
- 2024 margin
- Solid R (+42.0) · D 28.8% · R 70.7%
- 2008→2024 swing
- -5.6pp toward R · 2008: -36.4pp · 2024: -42.0pp
- All cycles
- 2024: R+42.0 2020: R+41.1 2016: R+43.5 2012: R+39.9 2008: R+36.4
Not yet ingested
- Civics
- —
Market trends
- HPI YoY
- ▼ -186.06%
- Current HPI
- 257.8168
- Rent YoY
- ▲ 6.28%
- Metro
- Rome, GA
- State GDP YoY
- ▲ 2.66%
- F500 in state
- 28
Industry mix (Fortune 500 HQ in GA)
| Industry | F500 HQs | Revenue |
|---|---|---|
| Paper / Packaging | 2 | $29B |
|
||
| Retail | 1 | $160B |
|
||
| Transportation / Logistics | 1 | $91B |
|
||
| Airlines | 1 | $62B |
|
||
| Consumer Goods | 1 | $47B |
|
||
| Utilities | 1 | $25B |
|
||
Property tax history
+4.8%/yrLatest (2025): $2,283 · +0.7% YoY. Source: county tax records.
Cash-flow waterfall
monthlySold comps — $/sqft
last 12 mo · ≤1 miLoading sold comps…