 Triplex
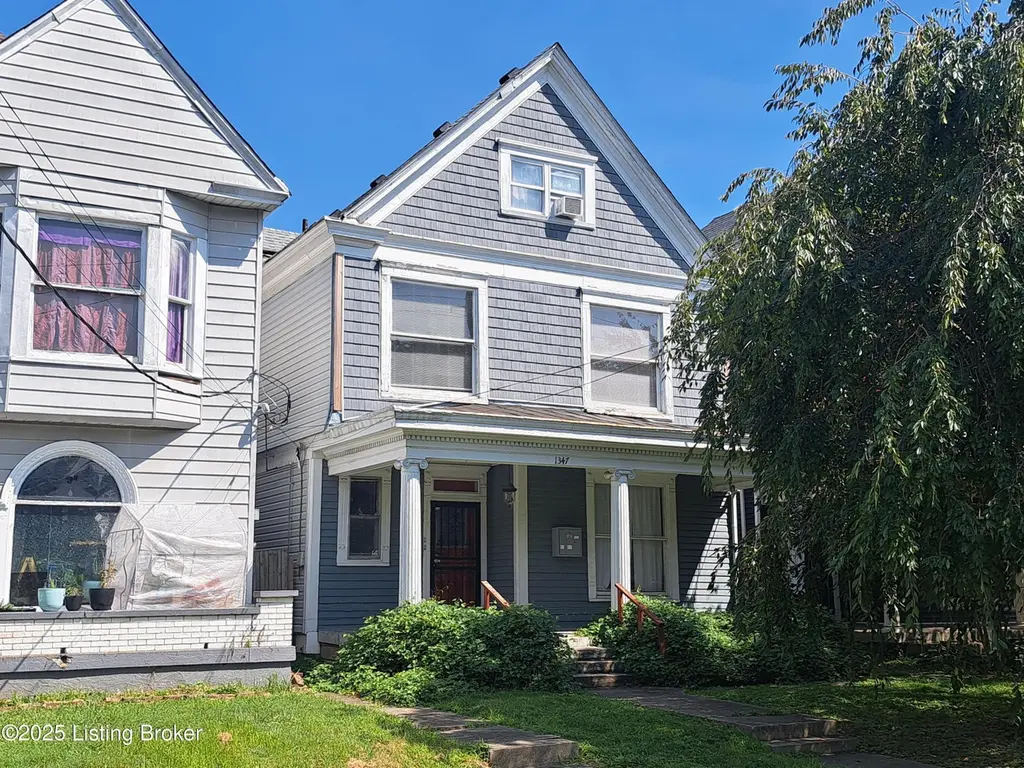
1347 S Floyd St · Louisville, KY
Flood risk 1/10 · Minimal
- FEMA flood zone
- X (unshaded)
- Chance of flooding over 30 yrs
- 0.0%
- Est. flood insurance / yr
- $507 – $1,088
Fire risk 1/10 · Minimal
- Est. fire insurance / yr
- $839 – $1,559
Heat risk 5/10 · Moderate
- Hot days now (above 105°F)
- 7 days/yr
- Hot days in 30 yrs
- 20 days/yr
Wind risk 2/10 · Minimal
- Chance of severe wind over 30 yrs
- 1.0%
Air-quality risk 2/10 · Minimal
- Unhealthy air days now
- 1 days/yr
- Unhealthy air days in 30 yrs
- 3 days/yr
Risk factors via First Street. Map © Google.
Why this score? — see what drove the B grade
The composite is a weighted blend of 9 inputs, each scored 0–100. Each bar is that input's sub-score; the figure is the points it added to the 100-point composite (weight × sub-score).
- Cash flow +30.0/30.0
- 1% rule +10.0/10.0
- DSCR +10.0/10.0
- ARV discount +7.5/15.0
- Rent growth +4.0/5.0
- Condition / age +3.8/5.0
- Livability +3.2/5.0
- Schools +2.3/10.0
- Appreciation +0.0/10.0
$369,000
🖨 Deal sheet 📄 Offer letter ✓ Due diligence
Multi-family units
County records classify this as Multi-Family (5+ Unit). Listing-text estimate: 3 units. estimate disagrees with records
5+ unit building — per-unit beds/baths from public records are typically unavailable; the breakdown below (if shown) is an estimate from the listing text.
Listing remarks
Smart money buys in Old Louisville before everyone else figures it out. This well-maintained triplex at 1347 S Floyd St cash-flows now and only gets more interesting from here. Separately metered for LG & E — tenants cover their own utilities, you cover water and sewer, expenses stay lean. Privacy-fenced backyard, unbeatable walkability — minutes from Shelby Park, Mag Bar, and Burger Boy. House hackers: live in one unit, let the others pay your mortgage. Portfolio builders: drop it in and collect. The cherry on top — assumable FHA loan at 3.125%. Rates like that don't grow on trees.
Key facts
- Separately metered
- Live in one unit
- 2 garage spots
Tags
Property features AI
Finance
- Other: Located in the Old Louisville subdivision; Directions: I65 to Woodbine to Floyd
- Financial info: Basement rent listed separately; Basement storage available
- HOA & community: No association fee
Exterior
- Parking: 2 parking spaces; 2 garage spaces; No covered parking
- Utilities: Electricity connected; Owner pays water, sewer, and trash removal; Tenants pay cable, electric, and gas
- Home design: Triplex property; Built in 1910; Traditional style
- Construction: Wood frame construction; Rolled/hot mop and shingle roof; Built in 1910
- Exterior features: No notable exterior features listed
Interior
- Kitchen: Each unit includes a kitchen (first, second, and third levels each have a kitchen); Each unit has a range and refrigerator
- Bedrooms: Total of 5 bedrooms; First level: 2 bedrooms; Second level: 1 bedroom; Third level: 2 bedrooms
- Bathrooms: First level: 1 full bathroom; Second level: 1 full bathroom; Third level: 1 full bathroom
- Heating & cooling: Three furnaces; Forced air heating; Mini-split / ductless heating option; Central air conditioning
- Interior features: Traditional architectural style; Three separate meters (multi-unit)
- Laundry & utility: Each unit includes laundry (first, second, and third levels each have laundry); Basement includes storage
Neighborhood map
What this means for you Summary
Snapshot
- This is a 3 × 5-bed/3.0-bath units multifamily listed at $369k. Condition is rated good.
Deal economics
- At list price, monthly cash flow is $2k ($24k/yr) — positive. Per door: $661/mo.
- The deal already cash-flows at list — no discount required.
- Meets the 1% rule at list price ($6k rent vs $369k).
- Cap rate 12.7% vs local median 5.0% in Louisville — top-decile yield for the area; either an underpriced asset or a hidden risk that comps aren't pricing in. Stress-test before assuming the spread holds.
Location & tenants
- Location reads 63/100 on livability (#333 in KY) — a middle-class / working-renter tenant base. Strengths: cost of living A+, housing A+; Watch: employment C-, health & safety D+, schools D-.
- Jefferson County (urban): math 19% / reading 35% proficiency, ranked #121 of 165 in KY (top 73%) — low school quality limits family demand, transient renter base, plan for 1-2y turnover.
- Market conditions: Rents rising fast (+6.1%/yr); 77 active listings in the ZIP; lower-income renter base — watch delinquency; 2,836 units permitted in Jefferson County in 2024 (1,558 in 5+ unit buildings).
- At $5,552/mo this rent would consume 168% of the median local household income ($40k/yr) (locally 1136% of renters already pay >50% of income on rent) — very limited rent-growth headroom before tenants either downsize or default.
Forward outlook
- Local home prices are declining (-3.0%/yr); year-one equity from $3k of loan paydown is wiped out by about $11k of value loss. Plan a longer hold.
- Jefferson County population projected at +13% by 2050 — modest demand growth; plan on rents tracking national, not racing it.
- At projected returns (-3.0% appreciation + 6.1% rent growth), your $103k cash investment doubles in ~5 years — after that, you're playing with house money.
Negotiation context
- Only 3 days on market — expect competitive offers; lowballing is unlikely to land.
- 10 sale attempts since 25y ago with the ask held roughly flat each time — persistent listings suggest the price (not the market) is what's stuck; bring a comps-based counter.
- Current owner paid $300k; 23% above their basis — modest negotiation headroom, anchor on the comps not their cost.
Risks & watch-outs
- Watch-outs: built in 1910 — expect roof / HVAC / electrical / plumbing capex.
- Climate carrying-cost: extreme-heat days projected 7→20/yr by 2055 (HVAC capex compounding) — expect insurance premiums to compound above CPI over the hold.
Questions for the listing agent
- Can we see the unit-by-unit rent roll, current vacancy, and any below-market leases? What's the average tenancy length?
- What capital expenditures (roof, boiler, parking lot, exteriors) have been made in the last 5 years, and what's planned in the next 2?
- Built in 1910 — when were the roof, HVAC, electrical panel, plumbing, and water heater last replaced?
- Is there a deadline driving the sale (1031 exchange, divorce, estate, relocation)? That informs how much negotiation room exists.
- Schools are D-rated, which usually means shorter tenancies and higher turnover. Who's the typical renter profile here, and what's been the actual vacancy rate?
- Crime grade is F in this area — have there been break-ins, vandalism, or insurance claims at this property in the last 3 years? What carrier currently insures it and at what premium?
- What's the average days-on-market for RENTAL listings here right now (not sales)? A rising rental-DOM trend means longer vacancies and softer asking-rent achievability than the comps imply.
- What's the recent tenant-quality profile in this submarket — average credit score on applications, eviction rate, late-payment / NSF rate, and stable-employment percentage? A property-management company in the area should have these aggregated.
- How much new apartment / multifamily construction is in the pipeline within 1–3 miles? Heavy new supply (>2% of stock underway) typically softens rents 12–24 months out; light construction supports rent growth.
Investment metrics
- 1% rule
- 1.50% ✓
- Cap rate
- 12.74%
- Cash-on-cash
- 23.02%
- DSCR
- 2.02
- GRM
- 5.5
CMA / ARV
No comps found within radius.
Projected returns pro-forma
-3.0% appreciation · 6.06% rent growth · sell at horizon
- IRR
- 19.3%
- Equity multiple
- 1.81×
- Total profit
- $84,068
- Equity at exit
- $55,019
- IRR
- 29.6%
- Equity multiple
- 4.03×
- Total profit
- $312,732
- Equity at exit
- $31,904
Cash invested: $103,320 (down + closing). Projections, not guarantees.
Landlord ↔ Tenant lean methodology
- Overall (STATE)
- 83 Strongly Landlord-Friendly
- State Kentucky
- 83 Strongly Landlord-Friendly · R+16
- County
- — inherits STATE
- City
- — inherits STATE
ZIP-level market 40208
- Home prices YoY
- -23.3%
- Rents YoY
- 6.1%
- Active inventory
- 77
- Price-to-rent
- 16.6×
Monthly cashflow live
- Estimated rent
- $5,552 medium interval (Pro) →
- Mortgage (P&I)
- −$1,935
- Tax from tax record
- −$315 /mo · $3,780/yr
- Insurance
- −$154
- HOA
- −$0
- Vacancy / Maint / Mgmt
- −$1,166
- Net cashflow
- $1,982
Break-even live
3-unit breakdown (identical units grouped — click to expand)
| Units | Beds | Baths | Est. rent |
|---|---|---|---|
| 3× units | 5 | 3 | $5,553 |
| #1 | 5 | 3 | $1,851 |
| #2 | 5 | 3 | $1,851 |
| #3 | 5 | 3 | $1,851 |
| Total (3 units) | $5,552 | ||
UW: 25.0% down · 7.5% · 30yr · 1.5% tax · 5.0% vac · 8.0% maint · 8.0% mgmt
Financing live
Cash to close
- Down payment
- $92,250
- Closing costs
- $11,070
- Reserves months
- —
- Total cash needed
- —
Loan-product check · same deal, 3 products live
Conventional
25% down · 7.5% · 30yr
- Down + closing
- —
- Monthly P&I
- —
- Monthly cashflow
- —
- DSCR
- —
- Eligible?
- —
Personal DTI + credit; lowest rate.
DSCR
20% down · 8.5% · 30yr
- Down + closing
- —
- Monthly P&I
- —
- Monthly cashflow
- —
- DSCR
- —
- Eligible?
- —
No personal income docs; deal must DSCR.
Hard money
10% down · 12.0% · 12mo
- Down + closing
- —
- Monthly P&I
- —
- Monthly cashflow
- —
- DSCR
- —
- Eligible?
- —
Short-term bridge; refi at stabilization.
Listing history 37 events
-
2026-06-18days on market $369,000 Active 3 DOM
-
2026-06-17days on market $369,000 Active 2 DOM
-
2026-06-16pricedays on market $369,000 Active 1 DOM
-
2026-06-13days on market $379,000 Active 22 DOM
-
2026-06-10days on market $379,000 Active 19 DOM
-
2026-06-09days on market $379,000 Active 18 DOM
-
2026-06-08days on market $379,000 Active 17 DOM
-
2026-06-07days on market $379,000 Active 16 DOM
-
2026-06-03days on market $379,000 Active 12 DOM
-
2026-06-02days on market $379,000 Active 11 DOM
-
2026-06-01days on market $379,000 Active 10 DOM
-
2026-05-31days on market $379,000 Active 9 DOM
-
2026-05-22$379,000 Active
-
2026-01-02historical
-
2025-11-19$379,999 Active
-
2025-11-01historical
-
2025-09-17$379,999 Active
-
2025-06-30historical
-
2025-04-18$394,999 Active
-
2021-09-02soldstatus $300,000 Closed
-
2021-07-30status Pending
-
2021-07-07price $310,000
-
2021-07-07$315,000 Active
-
2016-12-21soldstatus $190,000 Closed
-
2016-11-07status Pending
-
2016-09-30status Active
-
2016-09-29price $195,000
-
2016-07-26status Pending
-
2016-07-18$185,000 Active
-
2015-11-04historical
-
2015-07-13$198,000 Active
-
2015-07-13price $188,000
-
2015-07-13price $178,000
-
2006-06-30historical
-
2005-11-02$137,900
-
2002-07-30historical
-
2001-07-30$104,900
ⓘ Source: listings_history table (triggers on properties + properties_extension) + one-shot
backfill from property_details.listing_events for pre-trigger history.
Tax reassessment forecast KY · Resets to sale price
- Current annual tax
- $3,780 · $315/mo
- Projected year-2 tax
- $3,780 · $315/mo
- Expected delta
- $0/yr ($0/mo · 0.0%)
ⓘ Screening estimate from a state-policy table — verify with the county assessor before closing.
Climate risk First Street
- Flood 1/10 Low FEMA zone X (unshaded) · 0% chance over 30 yrs
- Wildfire 1/10 Low
- Heat 5/10 Major 7 d/yr ≥105°F today · 20 d/yr by 30 yrs out
- Wind 2/10 Low 100% chance of damaging wind over 30 yrs
- Air quality 2/10 Low 1 unhealthy d/yr today · 3 by 30 yrs out
Nearby sold comps map
Loading sold comps map…
Walkable amenities ~0.75 mi
Loading nearby amenities…
Taxation est. · year 1
- Rental income
- $66,624
- − Mortgage interest
- −$20,670
- − Property taxes
- −$3,780
- − Insurance
- −$1,845
- − Repairs & maintenance
- −$5,330
- − Management
- −$5,330
- − Depreciation
- −$10,735
- Taxable income
- $18,935
- Est. tax owed @ 24.0%
- −$4,544
- After-tax cash flow
- $19,243/yr
For passive investors: Depreciation is non-cash, so a rental often shows a tax loss while cash-flowing — sheltering income. Rental losses are passive: they offset passive income freely, and up to $25,000/yr can offset ordinary (W-2) income if you actively participate and your MAGI is under $100k (phasing out to $0 by $150k); unused losses carry forward. On sale, claimed depreciation is recaptured at up to 25%, and gains may owe capital-gains tax (a 1031 exchange can defer both). Figures are a year-1 estimate at your 24.0% rate — not tax advice; consult a CPA.
Condition & rehab AI · 13 photos
This well-maintained triplex at 1347 S Floyd St is in good condition with no major repairs needed. The property has a good curb appeal and is in a prime location. The property is currently cash-flowing and has the potential to increase in value with some cosmetic updates.
Value-add opportunities
- Both Paint the exterior siding — Painting the exterior siding will improve the curb appeal and increase the resale and rental value of the property.
- Both Install new flooring in the bathrooms — Replacing the old flooring in the bathrooms with new flooring will improve the appearance and increase the resale and rental value of the property.
- Both Install new kitchen appliances — Upgrading the kitchen appliances with new ones will improve the appearance and increase the resale and rental value of the property.
Renovation cost estimate screening
Value-add ROI direction
- Both Paint the exterior siding — Painting the exterior siding will improve the curb appeal and increase the resale and rental value of the property. ↑
- Both Install new flooring in the bathrooms — Replacing the old flooring in the bathrooms with new flooring will improve the appearance and increase the resale and rental value of the property. ↑
- Both Install new kitchen appliances — Upgrading the kitchen appliances with new ones will improve the appearance and increase the resale and rental value of the property. ↑
ⓘ Cost ranges are severity-bucket heuristics (US national rule-of-thumb). Get contractor quotes + a written scope before underwriting a rehab budget.
Schools (NCES district)
- District
- Jefferson County
- NCES district ID
- 2102990
- Math proficiency
- 19% ▼ -17.00%
- Reading proficiency
- 35% ▼ -11.00%
- Median HH income
- $47,885
- Composite
- 23.45/100
- National rank
- #7884
- State rank
- #121 of 165 in KY
Livability — Louisville
- Score
- 63/100
- State rank
- #333
- US rank
- #15887
Category grades
Schools grade is shown separately in the Schools card above.
Census & demographics
- Census place
- Louisville, KY
- County
- Jefferson County · 790,184 people
- City population
- 769,292
- Metro
- Louisville/Jefferson County, KY-IN
- Population (ZIP)
- 15,605
- Household income
- $39,560
- Rent vs Own
- Severe rent burden
- 1136.0
Population outlook (Jefferson County) Hauer SSP2
- Today (2025)
- 823,112 people
- By 2030
- 849,343 · +3.2%
- By 2040
- 895,696 · +8.8%
- By 2050
- 933,630 · +13.4%
- By 2075
- 1,028,262 · +24.9%
- By 2100
- 1,072,675 · +30.3%
Race, ethnicity, and origin ACS 2023
- Neighborhood character
- Diverse neighborhood (Simpson 0.56)
- Race & ethnicity
- White 62% Black 22% Two or more races 9% Hispanic / Latino 6% Asian 1%
- Hispanic origin (detail)
- Mexican 4%
- Common ancestry
- Italian 3% Lithuanian 2% Slovak 2%
- Foreign-born
- 5% · Canada, China, South Korea
- Languages at home
- 90% English-only · Spanish 3% French/Haitian/Cajun 1%
Political lean MEDSL · Jefferson
- 2024 margin
- D (+16.6) · D 57.4% · R 40.9% · Other 1.7%
- 2008→2024 swing
- +4.5pp toward D · 2008: 12.0pp · 2024: 16.6pp
- All cycles
- 2024: D+16.6 2020: D+20.1 2016: D+13.3 2012: D+11.1 2008: D+12.0
Not yet ingested
- Civics
- —
Market trends
- HPI YoY
- ▼ -72.97%
- Current HPI
- 240.6261
- Rent YoY
- ▲ 6.06%
- Metro
- Louisville/Jefferson County, KY-IN
- State GDP YoY
- ▲ 1.81%
- F500 in state
- 4
Industry mix (Fortune 500 HQ in KY)
| Industry | F500 HQs | Revenue |
|---|---|---|
| Healthcare | 1 | $118B |
|
||
| Food / Beverage | 1 | $7B |
|
||
Price history
+261.3% since first listed25 events — show timeline
- 2026-05-22 Listed $379,000 Metro Search MLS
- 2026-01-02 Listing Removed — Metro Search MLS
- 2025-11-19 Listed $379,999 Metro Search MLS
- 2025-11-01 Listing Removed — Metro Search MLS
- 2025-09-17 Listed $379,999 Metro Search MLS
- 2025-06-30 Listing Removed — Metro Search MLS
- 2025-04-18 Listed $394,999 Metro Search MLS
- 2021-09-02 Sold (MLS) $300,000 Metro Search MLS
- 2021-07-30 Pending — Metro Search MLS
- 2021-07-07 Listed $315,000 Metro Search MLS
- 2021-07-07 Price Changed $310,000 Metro Search MLS
- 2016-12-21 Sold (MLS) $190,000 Metro Search MLS
- 2016-11-07 Pending — Metro Search MLS
- 2016-09-30 Relisted — Metro Search MLS
- 2016-09-29 Price Changed $195,000 Metro Search MLS
- 2016-07-26 Pending — Metro Search MLS
- 2016-07-18 Listed $185,000 Metro Search MLS
- 2015-11-04 Listing Removed — Metro Search MLS
- 2015-07-13 Listed $198,000 Metro Search MLS
- 2015-07-13 Price Changed $178,000 Metro Search MLS
- 2015-07-13 Price Changed $188,000 Metro Search MLS
- 2006-06-30 Listing Removed — Metro Search MLS
- 2005-11-02 Listed $137,900 Metro Search MLS
- 2002-07-30 Listing Removed — Metro Search MLS
- 2001-07-30 Listed $104,900 Metro Search MLS
Property tax history
-3.1%/yrLatest (2025): $3,780 · -1.9% YoY. Source: county tax records.
Cash-flow waterfall
monthlySold comps — $/sqft
last 12 mo · ≤1 miLoading sold comps…