3309 Bridges St · Morehead City, NC
Flood risk 1/10 · Minimal
- FEMA flood zone
- X (unshaded)
- Chance of flooding over 30 yrs
- 0.0%
- Est. flood insurance / yr
- $507 – $1,088
Fire risk 3/10 · Minor
- Est. fire insurance / yr
- $906 – $1,684
Heat risk 10/10 · Severe
- Hot days now (above 103°F)
- 7 days/yr
- Hot days in 30 yrs
- 23 days/yr
Wind risk 8/10 · Major
- Chance of severe wind over 30 yrs
- 99.0%
Air-quality risk 2/10 · Minimal
- Unhealthy air days now
- 2 days/yr
- Unhealthy air days in 30 yrs
- 2 days/yr
Risk factors via First Street. Map © Google.
Why this score? — see what drove the C- grade
The composite is a weighted blend of 9 inputs, each scored 0–100. Each bar is that input's sub-score; the figure is the points it added to the 100-point composite (weight × sub-score).
- Cash flow +18.1/30.0
- ARV discount +7.5/15.0
- 1% rule +6.3/10.0
- DSCR +5.7/10.0
- Schools +5.1/10.0
- Rent growth +3.7/5.0
- Livability +3.2/5.0
- Condition / age +2.5/5.0
- Appreciation +0.0/10.0
$134,000
🖨 Deal sheet (PDF) 📄 Offer letter ✓ Due diligence
Listing remarks
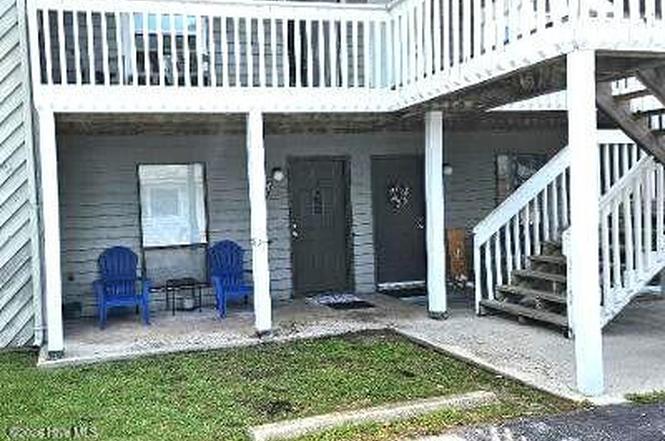
Great investment property, starter home, or someone wanting first floor living. This 2 bedroom 1 bath condo has a remodeled bathroom, separate laundry room, and walk in closet in main bedroom. Conveniently located near the Hospital, Community College, Shopping, and just 1 Mile to the Atlantic Beach Bridge for the beach lover in you!
Key facts
- Remodeled bathroom
- Walk in closet
- $250 HOA
Tags
Property features AI
Finance
- Other: Subdivision: The Bridges Condominium; Zoning: Residential; Directions: Hwy 70 or Hwy 24 to Bridges St.; complex on right just past Boys and Girls Club.
- HOA & community: Homeowners association with annual fee of $3,000 (about $250/month); HOA provides grounds and structure maintenance, management, and trash service
Exterior
- Parking: Paved parking lot with assigned spaces
- Utilities: Public water; Public sewer; Sewer connected; Water connected; Cable available
- Home design: Residential condominium; One level entry; Two-story building
- Construction: Wood siding and frame construction; Slab foundation
- Exterior features: Patio; No fencing; Shingle roof; Has view; Paved road access; City street and state road frontage; Sidewalks (community)
Interior
- Kitchen: Electric oven; Refrigerator; Dishwasher; Electric water heater
- Bedrooms: Total rooms: 4
- Flooring: Carpet; Vinyl
- Bathrooms: 1 full bathroom
- Heating & cooling: Heat pump; Electric heating; Has cooling
- Interior features: Walk-in closet(s); Eat-in kitchen; Window coverings
- Laundry & utility: Washer; Dryer; Laundry room and in-hall laundry
Neighborhood map
What this means for you Summary
Snapshot
- This is a 2-bed/1.0-bath condo listed at $134k.
Deal economics
- At list price, monthly cash flow is $118 ($1k/yr) — positive.
- The deal already cash-flows at list — no discount required.
- Meets the 1% rule at list price ($2k rent vs $134k).
- Recommended offer: $118k (12.0% below list) — sets the bar for market timing.
- Cap rate 7.4% vs local median 2.0% in Morehead City — top-decile yield for the area; either an underpriced asset or a hidden risk that comps aren't pricing in. Stress-test before assuming the spread holds.
Location & tenants
- Location reads 63/100 on livability (#412 in NC) — a middle-class / working-renter tenant base. Strengths: cost of living A-, housing B; Watch: employment D+, crime D-, amenities F.
- Carteret County Public Schools (rural): math 59% / reading 61% proficiency, ranked #31 of 178 in NC (top 17%) — acceptable for families but not a draw, mixed tenant base, ~2y average lease.
- Zoned schools: Morehead City Primary (math 62% / reading 57%, grade B-, #205 of 1,410 statewide, top 16%, 545 students, 98% FRL); Morehead City Middle (math 53% / reading 63%, grade B, #59 of 475 statewide, top 13%, 482 students, 99% FRL); West Carteret High (math 82% / reading 71%, grade A-, #89 of 535 statewide, top 16%, 1,146 students, 40% FRL) — zoned schools average 79% FRL vs 39% district-wide (40 pts higher); higher-poverty schools than district average — tighter screening recommended.
- Market conditions: Rents rising fast (+4.8%/yr); 141 active listings in the ZIP; 935 units permitted in Carteret County in 2024 (360 in 5+ unit buildings).
Forward outlook
- Local home prices are declining (-3.0%/yr); year-one equity from $926 of loan paydown is wiped out by about $4k of value loss. Plan a longer hold.
- Carteret County population projected at +9% by 2050 — modest demand growth; plan on rents tracking national, not racing it.
Negotiation context
- It's been on market 128 days — a 12% lower offer ($118k) is reasonable based on typical stale-listing flexibility.
Risks & watch-outs
- Climate carrying-cost: severe wind risk, 99% chance of damaging wind over 30y; extreme-heat days projected 7→23/yr by 2055 (HVAC capex compounding) — expect insurance premiums to compound above CPI over the hold.
Questions for the listing agent
- It's been on market 128 days. Have you received any prior offers? Is the seller open to a 12% concession, seller financing, or rate buy-down credit?
- What does the HOA fee cover, when was the last increase, and are there any pending special assessments or reserve-fund shortfalls?
- Any open or pending special assessments — roof, HVAC, plumbing, elevator, façade? What's the per-unit balance and payoff schedule, and is the seller paying it off at close or rolling it to the buyer?
- Why hasn't it sold? Are there any deal-killer items the seller is aware of (foundation, flood, title, zoning, code violations)?
- Is there a deadline driving the sale (1031 exchange, divorce, estate, relocation)? That informs how much negotiation room exists.
- Crime grade is D in this area — have there been break-ins, vandalism, or insurance claims at this property in the last 3 years? What carrier currently insures it and at what premium?
- What's the average days-on-market for RENTAL listings here right now (not sales)? A rising rental-DOM trend means longer vacancies and softer asking-rent achievability than the comps imply.
- What's the recent tenant-quality profile in this submarket — average credit score on applications, eviction rate, late-payment / NSF rate, and stable-employment percentage? A property-management company in the area should have these aggregated.
- How much new apartment / multifamily construction is in the pipeline within 1–3 miles? Heavy new supply (>2% of stock underway) typically softens rents 12–24 months out; light construction supports rent growth.
Investment metrics
- 1% rule
- 1.13% ✓
- Cap rate
- 7.35%
- Cash-on-cash
- 3.78%
- DSCR
- 1.17
- GRM
- 7.4
CMA / ARV
No comps found within radius.
Projected returns pro-forma
-3.0% appreciation · 4.8% rent growth · sell at horizon
- IRR
- -8.0%
- Equity multiple
- 0.70×
- Total profit
- $-11,268
- Equity at exit
- $19,980
- IRR
- 4.1%
- Equity multiple
- 1.33×
- Total profit
- $12,268
- Equity at exit
- $11,586
Cash invested: $37,520 (down + closing). Projections, not guarantees.
Landlord ↔ Tenant lean methodology
- Overall (STATE)
- 85 Strongly Landlord-Friendly
- State North Carolina
- 85 Strongly Landlord-Friendly · R+3
- County
- — inherits STATE
- City
- — inherits STATE
ZIP-level market 28557
- Home prices YoY
- -33.2%
- Rents YoY
- 4.8%
- Active inventory
- 141
- Price-to-rent
- 7.4×
Monthly cashflow live
- Estimated rent
- $1,517 medium interval (Pro) →
- Mortgage (P&I)
- −$703
- Tax from tax record
- −$72 /mo · $858/yr
- Insurance
- −$56
- HOA
- −$250
- Vacancy / Maint / Mgmt
- −$319
- Net cashflow
- $118
Break-even live
Sensitivity live
| Price | -10% $194 | -5% $156 | +0% $118 | +5% $80 | +10% $42 |
|---|---|---|---|---|---|
| Rent | -10% $-2 | -5% $58 | +0% $118 | +5% $178 | +10% $238 |
| Rate | -1.0pp $186 | -0.5pp $152 | base $118 | +0.5pp $84 | +1.0pp $48 |
UW: 25.0% down · 7.5% · 30yr · 1.5% tax · 5.0% vac · 8.0% maint · 8.0% mgmt
Financing live
Cash to close
- Down payment
- $33,500
- Closing costs
- $4,020
- Reserves months
- —
- Total cash needed
- —
Loan-product check · same deal, 3 products live
Conventional
25% down · 7.5% · 30yr
- Down + closing
- —
- Monthly P&I
- —
- Monthly cashflow
- —
- DSCR
- —
- Eligible?
- —
Personal DTI + credit; lowest rate.
DSCR
20% down · 8.5% · 30yr
- Down + closing
- —
- Monthly P&I
- —
- Monthly cashflow
- —
- DSCR
- —
- Eligible?
- —
No personal income docs; deal must DSCR.
Hard money
10% down · 12.0% · 12mo
- Down + closing
- —
- Monthly P&I
- —
- Monthly cashflow
- —
- DSCR
- —
- Eligible?
- —
Short-term bridge; refi at stabilization.
HOA detail condo
- Monthly dues
- $250 · $3,000/yr
- Assessments
- None detected in remarks — confirm with the listing agent.
Listing history 20 events
-
2026-06-19days on market $134,000 Active 128 DOM
-
2026-06-18days on market $134,000 Active 127 DOM
-
2026-06-17days on market $134,000 Active 126 DOM
-
2026-06-16days on market $134,000 Active 125 DOM
-
2026-06-15days on market $134,000 Active 124 DOM
-
2026-06-14days on market $134,000 Active 122 DOM
-
2026-06-12days on market $134,000 Active 121 DOM
-
2026-06-09days on market $134,000 Active 118 DOM
-
2026-06-08days on market $134,000 Active 117 DOM
-
2026-06-07days on market $134,000 Active 116 DOM
-
2026-06-05days on market $134,000 Active 113 DOM
-
2026-06-03days on market $134,000 Active 112 DOM
-
2026-06-02days on market $134,000 Active 111 DOM
-
2026-06-01days on market $134,000 Active 110 DOM
-
2026-05-31days on market $134,000 Active 109 DOM
-
2026-05-30days on market $134,000 Active 108 DOM
-
2026-05-12price $136,000
-
2026-03-17price $139,000
-
2026-02-11$145,000 Active
-
2025-05-22soldstatus $125,000
ⓘ Source: listings_history table (triggers on properties + properties_extension) + one-shot
backfill from property_details.listing_events for pre-trigger history.
Tax reassessment forecast NC · Resets to sale price
- Current annual tax
- $858 · $72/mo
- Projected year-2 tax
- $1,099 · $92/mo
- Expected delta
- +$240/yr (+$20/mo · 28.0%)
ⓘ Screening estimate from a state-policy table — verify with the county assessor before closing.
Climate risk First Street
- Flood 1/10 Low FEMA zone X (unshaded) · 0% chance over 30 yrs
- Wildfire 3/10 Moderate
- Heat 10/10 Extreme 7 d/yr ≥103°F today · 23 d/yr by 30 yrs out
- Wind 8/10 Severe 99% chance of damaging wind over 30 yrs
- Air quality 2/10 Low 2 unhealthy d/yr today · 2 by 30 yrs out
Nearby sold comps map
Loading sold comps map…
Walkable amenities ~0.75 mi
Loading nearby amenities…
Taxation est. · year 1
- Rental income
- $18,203
- − Mortgage interest
- −$7,506
- − Property taxes
- −$858
- − Insurance
- −$670
- − Repairs & maintenance
- −$1,456
- − Management
- −$1,456
- − HOA
- −$3,000
- − Depreciation
- −$3,898
- Taxable loss
- −$643
- Est. tax savings @ 24.0%
- +$154
- After-tax cash flow
- $1,573/yr
For passive investors: Depreciation is non-cash, so a rental often shows a tax loss while cash-flowing — sheltering income. Rental losses are passive: they offset passive income freely, and up to $25,000/yr can offset ordinary (W-2) income if you actively participate and your MAGI is under $100k (phasing out to $0 by $150k); unused losses carry forward. On sale, claimed depreciation is recaptured at up to 25%, and gains may owe capital-gains tax (a 1031 exchange can defer both). Figures are a year-1 estimate at your 24.0% rate — not tax advice; consult a CPA.
Schools (NCES district)
- District
- Carteret County Public Schools
- NCES district ID
- 3700630
- Math proficiency
- 59% ▲ 5.00%
- Reading proficiency
- 61% ▲ 2.00%
- Median HH income
- $48,330
- Composite
- 50.92/100
- National rank
- #1786
- State rank
- #31 of 178 in NC
Livability — Morehead City
- Score
- 63/100
- State rank
- #412
- US rank
- #15497
Category grades
Schools grade is shown separately in the Schools card above.
Census & demographics
- Census place
- Morehead City, NC
- County
- Carteret County · 52,389 people
- City population
- 15,253
- Metro
- Morehead City, NC
- Population (ZIP)
- 15,253
- Household income
- $68,528
- Rent vs Own
- Severe rent burden
- 535.0
Population outlook (Carteret County) Hauer SSP2
- Today (2025)
- 73,443 people
- By 2030
- 75,344 · +2.6%
- By 2040
- 78,142 · +6.4%
- By 2050
- 80,091 · +9.1%
- By 2075
- 86,120 · +17.3%
- By 2100
- 89,408 · +21.7%
Race, ethnicity, and origin ACS 2023
- Neighborhood character
- Predominantly White (83%)
- Race & ethnicity
- White 83% Two or more races 8% Hispanic / Latino 6% Black 4% Asian 1%
- Hispanic origin (detail)
- Mexican 2% Puerto Rican 2%
- Common ancestry
- Serbian 3% Italian 2% Slovak 2%
- Foreign-born
- 4% · Canada
- Languages at home
- 93% English-only · Spanish 5% German/W. Germanic 1% French/Haitian/Cajun 1%
Political lean MEDSL · Carteret
- 2024 margin
- Solid R (+43.1) · D 28.0% · R 71.1%
- 2008→2024 swing
- -8.4pp toward R · 2008: -34.7pp · 2024: -43.1pp
- All cycles
- 2024: R+43.1 2020: R+42.0 2016: R+44.5 2012: R+41.0 2008: R+34.7
Not yet ingested
- Civics
- —
Market trends
- HPI YoY
- ▼ -135.51%
- Current HPI
- 272.1497
- Rent YoY
- ▲ 4.80%
- Metro
- Morehead City, NC
- State GDP YoY
- ▲ 3.28%
- F500 in state
- 26
Industry mix (Fortune 500 HQ in NC)
| Industry | F500 HQs | Revenue |
|---|---|---|
| Financial Services | 2 | $213B |
|
||
| Retail | 2 | $95B |
|
||
| Industrial Conglomerate | 1 | $38B |
|
||
| Metals / Steel | 1 | $35B |
|
||
| Utilities | 1 | $30B |
|
||
| Industrial Machinery | 1 | $19B |
|
||
Price history
+8.8% since first listed4 events — show timeline
- 2026-05-12 Price Changed $136,000 Hive MLS
- 2026-03-17 Price Changed $139,000 Hive MLS
- 2026-02-11 Listed $145,000 Hive MLS
- 2025-05-22 Sold (Public Records) $125,000 Public Records
Property tax history
+11.7%/yrLatest (2025): $858 · +186.6% YoY. Source: county tax records.
Cash-flow waterfall
monthlySold comps — $/sqft
last 12 mo · ≤1 miLoading sold comps…