1770 Buckwheat Ln · Lake Havasu City, AZ
Flood risk 1/10 · Minimal
- FEMA flood zone
- X (unshaded)
- Chance of flooding over 30 yrs
- 0.0%
- Est. flood insurance / yr
- $507 – $1,088
Fire risk 3/10 · Minor
- Est. fire insurance / yr
- $610 – $1,132
Heat risk 9/10 · Severe
- Hot days now (above 115°F)
- 7 days/yr
- Hot days in 30 yrs
- 17 days/yr
Wind risk 1/10 · Minimal
- Chance of severe wind over 30 yrs
- —
Air-quality risk 1/10 · Minimal
- Unhealthy air days now
- 0 days/yr
- Unhealthy air days in 30 yrs
- 0 days/yr
Risk factors via First Street. Map © Google.
Why this score? — see what drove the D+ grade
The composite is a weighted blend of 9 inputs, each scored 0–100. Each bar is that input's sub-score; the figure is the points it added to the 100-point composite (weight × sub-score).
- Cash flow +15.0/30.0
- ARV discount +15.0/15.0
- DSCR +4.6/10.0
- Rent growth +3.4/5.0
- Schools +3.4/10.0
- Livability +3.2/5.0
- 1% rule +2.9/10.0
- Condition / age +2.5/5.0
- Appreciation +0.0/10.0
$350,000
🖨 Deal sheet 📄 Offer letter ✓ Due diligence
Listing remarks MLS
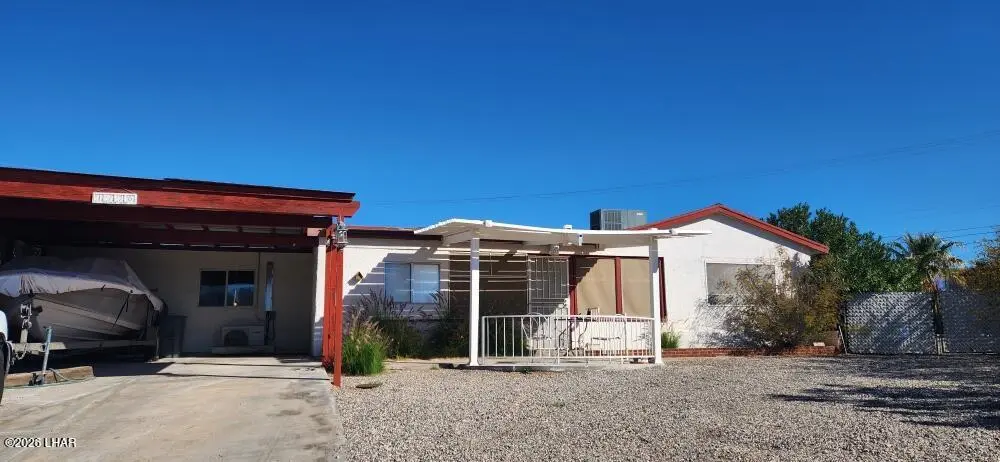
Needs some TLC, this house with over 2000 sq. ft. would make a great rental, winter visitor home or first time home buyer. Seller's are offering $5000 for flooring allowance. Has enclosed front porch with security screen door. Covered car port. It's only walking distance to Rotary Park & Restaurants. Large back yard, room to add a garage. Come she for yourself.
Key facts
- Security screen door
- Covered car port
- Large back yard
Tags
Neighborhood map
What this means for you Summary
Snapshot
- This is a 4-bed/2.0-bath single-family listed at $350k.
Deal economics
- At list price, monthly cash flow is $107 ($1k/yr) — positive.
- The deal already cash-flows at list — no discount required.
- To meet the 1% rule (rent ≥ 1% of price), the offer needs to be $276k (21.0% below list).
- Recommended offer: $276k (21.0% below list) — sets the bar for 1% rule.
- Cap rate 6.7% vs local median 3.0% in Lake Havasu City — top-decile yield for the area; either an underpriced asset or a hidden risk that comps aren't pricing in. Stress-test before assuming the spread holds.
Location & tenants
- Location reads 63/100 on livability (#124 in AZ) — a middle-class / working-renter tenant base. Strengths: housing A; Watch: health & safety C-, amenities F, commute F.
- Lake Havasu Unified District (4368) (urban): math 39% / reading 41% proficiency, ranked #66 of 249 in AZ (top 26%) — families likely to look elsewhere, expect single-tenant / working-renter base with shorter leases.
- Market conditions: Rents rising (+3.4%/yr); 387 active listings in the ZIP; 16 comparable units currently listed for rent nearby; rentals lingering (median 44d on market — plan ~5-8 weeks vacancy on turnover, expect pricing pressure); 75% of comp listings sitting > 30 days — soft ceiling on asking rent; 2,543 units permitted in Mohave County in 2024 (33 in 5+ unit buildings).
- At $2,764/mo this rent would consume 56% of the median local household income ($59k/yr) (locally 703% of renters already pay >50% of income on rent) — very limited rent-growth headroom before tenants either downsize or default.
Forward outlook
- Local home prices are declining (-3.0%/yr); year-one equity from $2k of loan paydown is wiped out by about $10k of value loss. Plan a longer hold.
- Mohave County population projected to shrink 6% by 2050 — rents likely to lag national; underwrite the cash flow, not the appreciation.
Negotiation context
- It's been on market 131 days — a 12% lower offer ($308k) is reasonable based on typical stale-listing flexibility.
- Current owner paid $169k; list at $350k implies a 107% gain — meaningful room to come down on a strong offer.
Risks & watch-outs
- Climate carrying-cost: extreme-heat days projected 7→17/yr by 2055 (HVAC capex compounding) — expect insurance premiums to compound above CPI over the hold.
Questions for the listing agent
- It's been on market 131 days. Have you received any prior offers? Is the seller open to a 21% concession, seller financing, or rate buy-down credit?
- Built in 1974 — when were the roof, HVAC, electrical panel, plumbing, and water heater last replaced?
- Why hasn't it sold? Are there any deal-killer items the seller is aware of (foundation, flood, title, zoning, code violations)?
- Is there a deadline driving the sale (1031 exchange, divorce, estate, relocation)? That informs how much negotiation room exists.
- Schools are B-rated — typically a magnet for longer-tenancy family renters. What's the average tenant stay here, and is there a school-zone premium baked into asking?
- The area grade is low — what's the realistic commute time and amenity access for the typical tenant pool here? Any planned neighborhood developments (good or bad) we should know about?
- What's the average days-on-market for RENTAL listings here right now (not sales)? A rising rental-DOM trend means longer vacancies and softer asking-rent achievability than the comps imply.
- What's the recent tenant-quality profile in this submarket — average credit score on applications, eviction rate, late-payment / NSF rate, and stable-employment percentage? A property-management company in the area should have these aggregated.
- How much new for-sale + rental construction is in the pipeline within 1–3 miles? Heavy new supply typically softens prices + rents 12–24 months out; constrained supply supports both.
Investment metrics
- 1% rule
- 0.79% ✗
- Cap rate
- 6.66%
- Cash-on-cash
- 1.30%
- DSCR
- 1.06
- GRM
- 10.6
CMA / ARV
- ARV (median comp)
- $434,415
- List price
- $350,000
- Delta
- -19.43%
- Verdict
- UNDERPRICED
- Comps
- 20 within 1.0 mi
Show comp detail 12 sales within ~0.75 mi
| Address | Dist | Beds/Ba | Sqft | Sold | Price | $/sf | Match |
|---|---|---|---|---|---|---|---|
| 267 Sunflower Dr | 0.17mi | 4/2.0 | 2,076 (+4%) | 9mo | $575,000 | $277 | 78 |
| 1811 Duel Dr | 0.42mi | 3/2.0 (-1) | 1,988 (-1%) | 11mo | $340,000 | $171 | 65 |
| 190 Aspen Dr | 0.42mi | 3/2.0 (-1) | 1,848 (-8%) | 1mo | $426,000 | $231 | 62 |
| 160 Aspen Dr | 0.44mi | 3/2.0 (-1) | 1,877 (-6%) | 5mo | $370,000 | $197 | 60 |
| 181 Mulberry Ave | 0.59mi | 3/2.0 (-1) | 2,004 (+0%) | 10mo | $485,000 | $242 | 58 |
| 1630 Topaz Dr | 0.75mi | 4/3.0 | 1,928 (-4%) | 1mo | $457,500 | $237 | 55 |
| 1802 Combat Dr | 0.60mi | 3/2.5 (-1) | 2,157 (+8%) | 3mo | $815,000 | $378 | 50 |
| 284 Mulberry Ave | 0.65mi | 4/2.0 | 1,753 (-12%) | 0mo | $690,000 | $394 | 49 |
| 270 Locust Ln | 0.69mi | 3/2.5 (-1) | 1,869 (-7%) | 4mo | $635,000 | $340 | 46 |
| 200 White Oak Dr | 0.57mi | 3/2.5 (-1) | 2,188 (+9%) | 8mo | $455,000 | $208 | 44 |
| 2004 Pima Dr N | 0.65mi | 3/2.0 (-1) | 1,716 (-14%) | 8mo | $389,900 | $227 | 35 |
| 299 Mulberry Ave | 0.62mi | 3/2.5 (-1) | 2,279 (+14%) | 9mo | $380,000 | $167 | 33 |
Match score weights: distance 35% · size 25% · config 20% · recency 20%. Top-matched comps best support the ARV.
Projected returns pro-forma
-3.0% appreciation · 3.43% rent growth · sell at horizon
- IRR
- -13.9%
- Equity multiple
- 0.50×
- Total profit
- $-48,896
- Equity at exit
- $52,186
- IRR
- -4.5%
- Equity multiple
- 0.70×
- Total profit
- $-29,550
- Equity at exit
- $30,262
Cash invested: $98,000 (down + closing). Projections, not guarantees.
Landlord ↔ Tenant lean methodology
- Overall (STATE)
- 87 Strongly Landlord-Friendly
- State Arizona
- 87 Strongly Landlord-Friendly · R+3
- County
- — inherits STATE
- City
- — inherits STATE
ZIP-level market 86403
- Home prices YoY
- -33.5%
- Rents YoY
- 3.4%
- Active inventory
- 387
- Price-to-rent
- 10.6×
Monthly cashflow live
- Estimated rent
- $2,764 high interval (Pro) →
- Mortgage (P&I)
- −$1,835
- Tax from tax record
- −$96 /mo · $1,153/yr
- Insurance
- −$146
- HOA
- −$0
- Vacancy / Maint / Mgmt
- −$581
- Net cashflow
- $107
Break-even live
UW: 25.0% down · 7.5% · 30yr · 1.5% tax · 5.0% vac · 8.0% maint · 8.0% mgmt
Financing live
Cash to close
- Down payment
- $87,500
- Closing costs
- $10,500
- Reserves months
- —
- Total cash needed
- —
Loan-product check · same deal, 3 products live
Conventional
25% down · 7.5% · 30yr
- Down + closing
- —
- Monthly P&I
- —
- Monthly cashflow
- —
- DSCR
- —
- Eligible?
- —
Personal DTI + credit; lowest rate.
DSCR
20% down · 8.5% · 30yr
- Down + closing
- —
- Monthly P&I
- —
- Monthly cashflow
- —
- DSCR
- —
- Eligible?
- —
No personal income docs; deal must DSCR.
Hard money
10% down · 12.0% · 12mo
- Down + closing
- —
- Monthly P&I
- —
- Monthly cashflow
- —
- DSCR
- —
- Eligible?
- —
Short-term bridge; refi at stabilization.
Rent comps 16 comps
| Address | Beds | Baths | Sqft | Rent | $/sqft | DOM | Units | Dist |
|---|---|---|---|---|---|---|---|---|
| 1820 Ambas Dr Lake Havasu City, AZ | 3.0 | 2.0 | 1649 | $2,650 | $1.61 | 43d | 1 | 0.56mi |
| 212 Coral Dr Lake Havasu City, AZ | 3.0 | 2.0 | 1941 | $3,499 | $1.80 | 43d | 1 | 0.77mi |
| 1945 Mimosa Dr Lake Havasu City, AZ | 3.0 | 2.0 | 1524 | $1,795 | $1.18 | 43d | 1 | 0.77mi |
| 1815 Palo Verde Blvd S Lake Havasu City, AZ | 3.0 | 2.0 | 1442 | $3,000 | $2.08 | 43d | 1 | 0.91mi |
| 1960 Mangrum Dr Lake Havasu City, AZ | 3.0 | 3.0 | 2415 | $3,500 | $1.45 | 20d | 1 | 1.05mi |
| 2270 Senita Dr Lake Havasu City, AZ | 3.0 | 3.0 | 1896 | $3,500 | $1.85 | 43d | 1 | 1.09mi |
| 388 Coral Dr Lake Havasu City, AZ | 3.0 | 2.5 | 1441 | $2,800 | $1.94 | 13d | 1 | 1.11mi |
| 375 London Bridge Rd Lake Havasu City, AZ | 3.0 | 2.0 | 1754 | $1,950 | $1.11 | 13d | 1 | 1.14mi |
| 375 London Bridge Rd #35 Lake Havasu City, AZ | 3.0 | 2.0 | 1713 | $2,500 | $1.46 | 20d | 1 | 1.14mi |
| 131 Mescal Loop Lake Havasu City, AZ | 4.0 | 3.0 | 2034 | $3,500 | $1.72 | 43d | 1 | 1.16mi |
| 2400 Baron Dr Lake Havasu City, AZ | 3.0 | 2.0 | 1698 | $3,900 | $2.30 | 43d | 1 | 1.17mi |
| 1791 Rainbow Ave S Lake Havasu City, AZ | 3.0 | 2.0 | 1613 | $1,750 | $1.08 | 43d | 1 | 1.20mi |
| 2328 Senita Dr Lake Havasu City, AZ | 3.0 | 2.0 | 1495 | $2,400 | $1.61 | 43d | 1 | 1.20mi |
| 16 Nolina Ln Lake Havasu City, AZ | 5.0 | 3.0 | 2085 | $4,000 | $1.92 | 43d | 1 | 1.30mi |
| 2515 Tradewind Dr Lake Havasu City, AZ | 3.0 | 3.0 | 1971 | $2,650 | $1.34 | 43d | 1 | 1.39mi |
| 196 Wayfarer Ln Lake Havasu City, AZ | 3.0 | 2.0 | 1530 | $2,500 | $1.63 | 43d | 1 | 1.49mi |
Listing history 9 events
-
2026-06-03days on market $350,000 Active 131 DOM
-
2026-06-02days on market $350,000 Active 130 DOM
-
2026-06-01days on market $350,000 Active 129 DOM
-
2026-05-31days on market $350,000 Active 128 DOM
-
2026-05-30days on market $350,000 Active 127 DOM
-
2026-02-18price $350,000 369-char remark
Show marketing remark (369 chars)
Needs some TLC, this house with over 2000 sq. ft. would make a great rental, winter visitor home or first time home buyer. Seller's are offering $5000 for flooring allowance. Has enclosed front porch with security screen door. Covered car port. It's only walking distance to Rotary Park & Restaurants. Large back yard, room to add a garage. Come she for yourself.
-
2026-02-04price $365,000 369-char remark
Show marketing remark (369 chars)
Needs some TLC, this house with over 2000 sq. ft. would make a great rental, winter visitor home or first time home buyer. Seller's are offering $5000 for flooring allowance. Has enclosed front porch with security screen door. Covered car port. It's only walking distance to Rotary Park & Restaurants. Large back yard, room to add a garage. Come she for yourself.
-
2026-01-23$375,000 Active 369-char remark
Show marketing remark (369 chars)
Needs some TLC, this house with over 2000 sq. ft. would make a great rental, winter visitor home or first time home buyer. Seller's are offering $5000 for flooring allowance. Has enclosed front porch with security screen door. Covered car port. It's only walking distance to Rotary Park & Restaurants. Large back yard, room to add a garage. Come she for yourself.
-
2019-07-25soldstatus $168,726
ⓘ Source: listings_history table (triggers on properties + properties_extension) + one-shot
backfill from property_details.listing_events for pre-trigger history.
Tax reassessment forecast AZ · Resets to sale price
- Current annual tax
- $1,153 · $96/mo
- Projected year-2 tax
- $2,310 · $192/mo
- Expected delta
- +$1,157/yr (+$96/mo · 100.4%)
ⓘ Screening estimate from a state-policy table — verify with the county assessor before closing.
Climate risk First Street
- Flood 1/10 Low FEMA zone X (unshaded) · 0% chance over 30 yrs
- Wildfire 3/10 Moderate
- Heat 9/10 Extreme 7 d/yr ≥115°F today · 17 d/yr by 30 yrs out
- Wind 1/10 Low
- Air quality 1/10 Low 0 unhealthy d/yr today · 0 by 30 yrs out
Nearby sold comps map
Loading sold comps map…
Walkable amenities ~0.75 mi
Loading nearby amenities…
Taxation est. · year 1
- Rental income
- $33,173
- − Mortgage interest
- −$19,605
- − Property taxes
- −$1,153
- − Insurance
- −$1,750
- − Repairs & maintenance
- −$2,654
- − Management
- −$2,654
- − Depreciation
- −$10,182
- Taxable loss
- −$4,825
- Est. tax savings @ 24.0%
- +$1,158
- After-tax cash flow
- $2,437/yr
For passive investors: Depreciation is non-cash, so a rental often shows a tax loss while cash-flowing — sheltering income. Rental losses are passive: they offset passive income freely, and up to $25,000/yr can offset ordinary (W-2) income if you actively participate and your MAGI is under $100k (phasing out to $0 by $150k); unused losses carry forward. On sale, claimed depreciation is recaptured at up to 25%, and gains may owe capital-gains tax (a 1031 exchange can defer both). Figures are a year-1 estimate at your 24.0% rate — not tax advice; consult a CPA.
Schools (NCES district)
- District
- Lake Havasu Unified District (4368)
- NCES district ID
- 0404280
- Math proficiency
- 39% ▼ -16.00%
- Reading proficiency
- 41% ▼ -8.00%
- Median HH income
- $43,993
- Composite
- 33.92/100
- National rank
- #5339
- State rank
- #66 of 249 in AZ
Livability — Lake Havasu City
- Score
- 63/100
- State rank
- #124
- US rank
- #15839
Category grades
Schools grade is shown separately in the Schools card above.
Census & demographics
- Census place
- Lake Havasu City, AZ
- County
- Mohave County · 181,906 people
- City population
- 62,596
- Metro
- Lake Havasu City-Kingman, AZ
- Population (ZIP)
- 18,295
- Household income
- $58,967
- Rent vs Own
- Severe rent burden
- 703.0
Population outlook (Mohave County) Hauer SSP2
- Today (2025)
- 209,184 people
- By 2030
- 209,674 · +0.2%
- By 2040
- 205,897 · -1.6%
- By 2050
- 196,810 · -5.9%
- By 2075
- 169,454 · -19.0%
- By 2100
- 136,630 · -34.7%
Race, ethnicity, and origin ACS 2023
- Neighborhood character
- Predominantly White (78%)
- Race & ethnicity
- White 78% Hispanic / Latino 19% Two or more races 12%
- Hispanic origin (detail)
- Mexican 15% Puerto Rican 2%
- Common ancestry
- Lithuanian 8% Portuguese 2% Slovak 2%
- Foreign-born
- 6% · Canada
- Languages at home
- 91% English-only · Spanish 8%
Political lean MEDSL · Mohave
- 2024 margin
- Solid R (+55.8) · D 21.8% · R 77.6%
- 2008→2024 swing
- -22.9pp toward R · 2008: -32.9pp · 2024: -55.8pp
- All cycles
- 2024: R+55.8 2020: R+51.3 2016: R+51.5 2012: R+42.6 2008: R+32.9
Not yet ingested
- Civics
- —
Market trends
- HPI YoY
- ▼ -194.25%
- Current HPI
- 384.7996
- Rent YoY
- ▲ 3.43%
- Metro
- Lake Havasu City-Kingman, AZ
- State GDP YoY
- ▲ 4.54%
- F500 in state
- 20
Industry mix (Fortune 500 HQ in AZ)
| Industry | F500 HQs | Revenue |
|---|---|---|
| Technology | 2 | $13B |
|
||
| Mining / Metals | 1 | $23B |
|
||
| Environmental Services | 1 | $16B |
|
||
| Metals / Steel | 1 | $14B |
|
||
| Technology Distribution | 1 | $9B |
|
||
| Homebuilding | 1 | $8B |
|
||
Price history
+107.4% since first listed4 events — show timeline
- 2026-02-18 Price Changed $350,000 LHAR
- 2026-02-04 Price Changed $365,000 LHAR
- 2026-01-23 Listed $375,000 LHAR
- 2019-07-25 Sold (Public Records) $168,726 Public Records
Property tax history
+2.4%/yrLatest (2025): $1,153 · +1.7% YoY. Source: county tax records.
Cash-flow waterfall
monthlySold comps — $/sqft
last 12 mo · ≤1 miLoading sold comps…