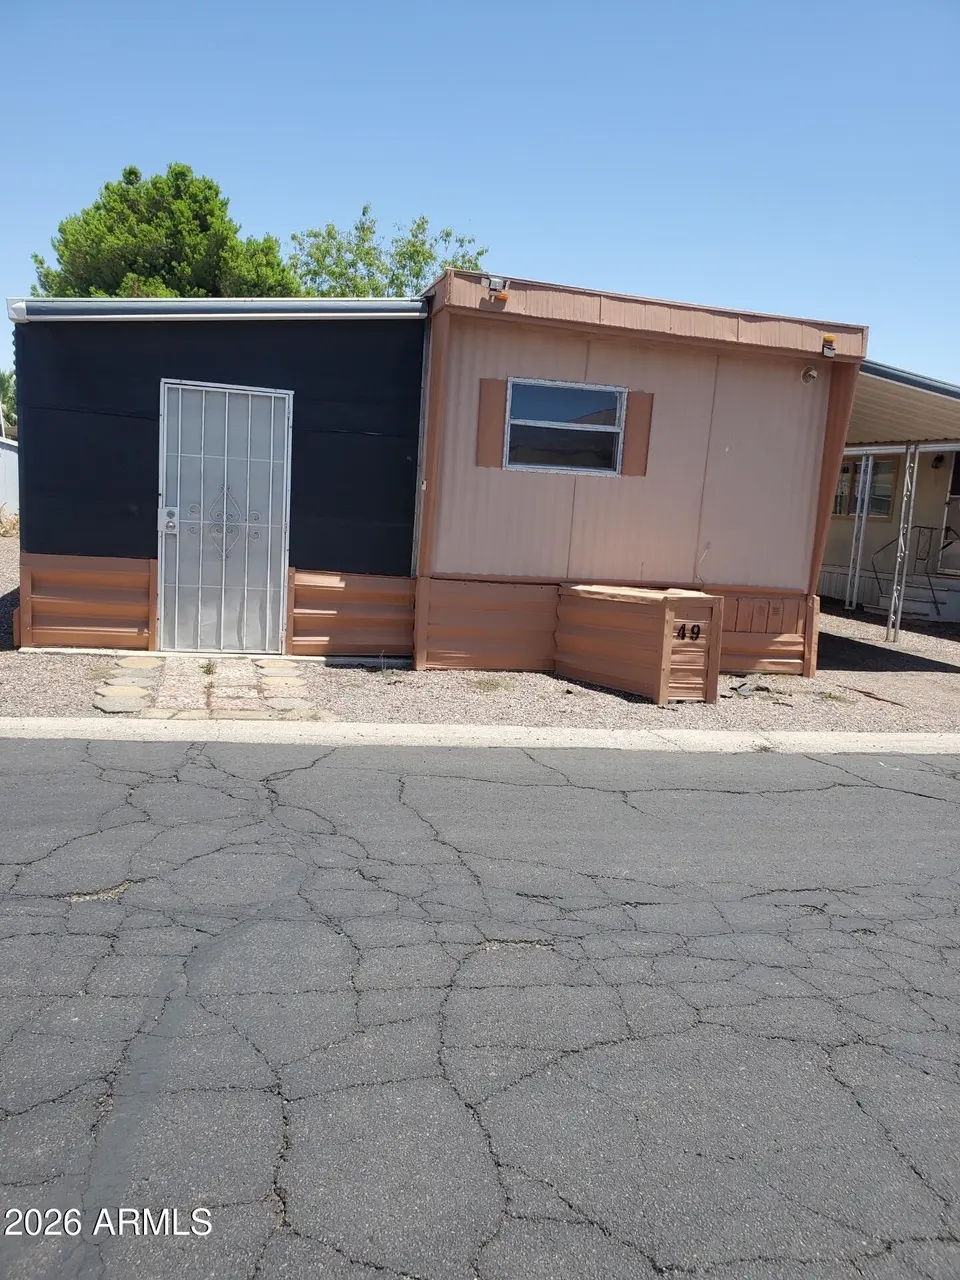
5747 W Missouri Ave #49 · Glendale, AZ
Flood risk 1/10 · Minimal
- FEMA flood zone
- X (shaded)
- Chance of flooding over 30 yrs
- 0.0%
- Est. flood insurance / yr
- $507 – $1,088
Fire risk 1/10 · Minimal
- Est. fire insurance / yr
- $610 – $1,132
Heat risk 9/10 · Severe
- Hot days now (above 112°F)
- 6 days/yr
- Hot days in 30 yrs
- 16 days/yr
Wind risk 1/10 · Minimal
- Chance of severe wind over 30 yrs
- —
Air-quality risk 2/10 · Minimal
- Unhealthy air days now
- 0 days/yr
- Unhealthy air days in 30 yrs
- 1 days/yr
Risk factors via First Street. Map © Google.
Why this score? — see what drove the B- grade
The composite is a weighted blend of 9 inputs, each scored 0–100. Each bar is that input's sub-score; the figure is the points it added to the 100-point composite (weight × sub-score).
- Cash flow +30.0/30.0
- 1% rule +10.0/10.0
- DSCR +10.0/10.0
- ARV discount +7.5/15.0
- Livability +3.8/5.0
- Condition / age +2.2/5.0
- Rent growth +1.8/5.0
- Schools +1.1/10.0
- Appreciation +0.0/10.0
$79,900
🖨 Deal sheet 📄 Offer letter ✓ Due diligence
Listing remarks
Welcome to 5747 W Missouri Ave in the Glendale Cascade Mobile Home Community--an inviting home offering comfort, convenience, and a relaxed community lifestyle. Enjoy tree-lined surroundings and a peaceful neighborhood feel while staying close to everything you need. Just minutes from Westgate Entertainment District, State Farm Stadium, and Desert Diamond Arena, you'll have shopping, dining, and entertainment at your fingertips. Nearby Sahuaro Ranch Park offers outdoor space to unwind. Easy access to Loop 101 adds convenience. A great opportunity to enjoy affordable living in a prime Glendale location!
Key facts
- Loop 101
- Desert diamond arena
- State farm stadium
Tags
Property features AI
Finance
- Other: Lot size source: Owner; Building area source: Owner; Directions: From N 59th Avenue, typically turn east onto W Missouri Avenue to access the community entrance
- Financial info: Current financing: Other
- HOA & community: Land lease (approximately $1,026 monthly); No association fees included; Community pool; Biking/walking path; Fitness center
Exterior
- Parking: 2 covered parking spaces; 1 open parking space; 1 garage space; 1 carport space
- Utilities: City water; Public sewer
- Home design: Manufactured/mobile housing; Leasehold ownership
- Construction: Wood siding; Steel frame; Painted exterior; Composition roof
- Exterior features: Shed(s); Gravel/stone in back; City view; Asphalt road access
Interior
- Kitchen: Refrigerator; Disposal; Built-in gas oven; Laminate counters
- Bedrooms: 2 possible bedrooms
- Flooring: Laminate flooring
- Bathrooms: 2 full bathrooms
- Heating & cooling: Natural gas heating; Central air conditioning
- Interior features: Eat-in kitchen; Full bathroom in primary bedroom; Laminate counters
Neighborhood map
What this means for you Summary
Snapshot
- This is a 2-bed/2.0-bath manufactured listed at $80k. Condition is rated fair.
Deal economics
- At list price, monthly cash flow is $472 ($6k/yr) — positive.
- The deal already cash-flows at list — no discount required.
- Meets the 1% rule at list price ($1k rent vs $80k).
- Recommended offer: $73k (9.0% below list) — sets the bar for market timing.
- Cap rate 13.4% vs local median 3.5% in Glendale — top-decile yield for the area; either an underpriced asset or a hidden risk that comps aren't pricing in. Stress-test before assuming the spread holds.
Location & tenants
- Location reads 76/100 on livability (#12 in AZ, #3,235 nationally) — a middle-class / working-renter tenant base. Strengths: commute A+, housing A+, amenities B; Watch: health & safety D+, crime F.
- Phoenix Union High School District (4286) (urban): math 10% / reading 15% proficiency, ranked #224 of 249 in AZ (top 90%) — low school quality limits family demand, transient renter base, plan for 1-2y turnover.
- Zoned schools: Maryvale High School (math 8% / reading 14%, grade F, #292 of 381 statewide, top 77%, 2,795 students, 88% FRL).
- Market conditions: Rents soft (-3.0%/yr); 215 active listings in the ZIP; 40 comparable units currently listed for rent nearby; rentals leasing fast (median 2d on market — plan ~1-2 weeks tenant-placement turnaround); 36,011 units permitted in Maricopa County in 2024 (12,801 in 5+ unit buildings).
Forward outlook
- Local home prices are declining (-3.0%/yr); year-one equity from $552 of loan paydown is wiped out by about $2k of value loss. Plan a longer hold.
- Maricopa County population projected at +38% by 2050 — long-run rental-demand tailwind backs the buy-and-hold thesis.
- At projected returns (-3.0% appreciation + 0.0% rent growth), your $22k cash investment doubles in ~6 years — after that, you're playing with house money.
Negotiation context
- It's been on market 91 days — a 9% lower offer ($73k) is reasonable based on typical stale-listing flexibility.
Risks & watch-outs
- Climate carrying-cost: extreme-heat days projected 6→16/yr by 2055 (HVAC capex compounding) — expect insurance premiums to compound above CPI over the hold.
Questions for the listing agent
- It's been on market 91 days. Have you received any prior offers? Is the seller open to a 9% concession, seller financing, or rate buy-down credit?
- Have any recent inspections been done? Can we get a copy of the seller's disclosures and any deferred-maintenance estimates?
- Why hasn't it sold? Are there any deal-killer items the seller is aware of (foundation, flood, title, zoning, code violations)?
- Is there a deadline driving the sale (1031 exchange, divorce, estate, relocation)? That informs how much negotiation room exists.
- Crime grade is F in this area — have there been break-ins, vandalism, or insurance claims at this property in the last 3 years? What carrier currently insures it and at what premium?
- What's the average days-on-market for RENTAL listings here right now (not sales)? A rising rental-DOM trend means longer vacancies and softer asking-rent achievability than the comps imply.
- What's the recent tenant-quality profile in this submarket — average credit score on applications, eviction rate, late-payment / NSF rate, and stable-employment percentage? A property-management company in the area should have these aggregated.
- How much new for-sale + rental construction is in the pipeline within 1–3 miles? Heavy new supply typically softens prices + rents 12–24 months out; constrained supply supports both.
Investment metrics
- 1% rule
- 1.62% ✓
- Cap rate
- 13.39%
- Cash-on-cash
- 25.34%
- DSCR
- 2.13
- GRM
- 5.1
CMA / ARV
No comps found within radius.
Projected returns pro-forma
-3.0% appreciation · 0.0% rent growth · sell at horizon
- IRR
- 15.4%
- Equity multiple
- 1.60×
- Total profit
- $13,359
- Equity at exit
- $11,913
- IRR
- 21.8%
- Equity multiple
- 2.60×
- Total profit
- $35,767
- Equity at exit
- $6,908
Cash invested: $22,372 (down + closing). Projections, not guarantees.
Landlord ↔ Tenant lean methodology
- Overall (STATE)
- 87 Strongly Landlord-Friendly
- State Arizona
- 87 Strongly Landlord-Friendly · R+3
- County
- — inherits STATE
- City
- — inherits STATE
ZIP-level market 85301
- Home prices YoY
- -10.6%
- Rents YoY
- -3.0%
- Active inventory
- 215
- Price-to-rent
- 5.1×
Monthly cashflow live
- Estimated rent
- $1,297 high interval (Pro) →
- Mortgage (P&I)
- −$419
- Tax est. 1.5%
- −$100 /mo · $1,198/yr
- Insurance
- −$33
- HOA
- −$0
- Vacancy / Maint / Mgmt
- −$272
- Net cashflow
- $472
Break-even live
UW: 25.0% down · 7.5% · 30yr · 1.5% tax · 5.0% vac · 8.0% maint · 8.0% mgmt
Financing live
Cash to close
- Down payment
- $19,975
- Closing costs
- $2,397
- Reserves months
- —
- Total cash needed
- —
Loan-product check · same deal, 3 products live
Conventional
25% down · 7.5% · 30yr
- Down + closing
- —
- Monthly P&I
- —
- Monthly cashflow
- —
- DSCR
- —
- Eligible?
- —
Personal DTI + credit; lowest rate.
DSCR
20% down · 8.5% · 30yr
- Down + closing
- —
- Monthly P&I
- —
- Monthly cashflow
- —
- DSCR
- —
- Eligible?
- —
No personal income docs; deal must DSCR.
Hard money
10% down · 12.0% · 12mo
- Down + closing
- —
- Monthly P&I
- —
- Monthly cashflow
- —
- DSCR
- —
- Eligible?
- —
Short-term bridge; refi at stabilization.
Rent comps 40 comps
| Address | Beds | Baths | Sqft | Rent | $/sqft | DOM | Units | Dist |
|---|---|---|---|---|---|---|---|---|
| 5045 N 58th Ave Glendale, AZ | 1.0–2.0 | 1.0–2.0 | 821 | $1,399 | $1.70 | 1d | 1 | 0.19mi |
| 5631 W Colter St Glendale, AZ | 1.0–3.0 | 1.0–2.0 | 885 | $1,324 | $1.50 | 1d | 5 | 0.21mi |
| 5601 W Missouri Ave Glendale, AZ | 3.0 | 2.0 | 1012 | $1,500 | $1.48 | 1d | 1 | 0.25mi |
| 5039 N 57th Ave Glendale, AZ | 1.0–2.0 | 1.0–2.0 | 800 | $2,403 | $3.00 | 1d | 15 | 0.29mi |
| 5190 N 55th Ave Glendale, AZ | 1.0–2.0 | 1.0–2.0 | 708 | $1,560 | $2.20 | 1d | 15 | 0.33mi |
| 6024 W Oregon Ave Unit C Glendale, AZ | 2.0 | 1.5 | 950 | $1,249 | $1.31 | 1d | 1 | 0.38mi |
| 6012 W Oregon Ave Glendale, AZ | 2.0–3.0 | 1.5 | 975 | $1,249 | $1.28 | 1d | 2 | 0.39mi |
| 5755 N 59th Ave Glendale, AZ | 2.0 | 2.0 | 878 | $1,593 | $1.81 | 24d | 1 | 0.51mi |
| 5755 N 59th Ave Glendale, AZ | 1.0 | 1.0 | 632 | $1,167 | $1.85 | 17d | 1 | 0.51mi |
| 5755 N 59th Ave Glendale, AZ | 2.0 | 2.0 | 878 | $1,393 | $1.59 | 1d | 1 | 0.51mi |
| 5740 N 59th Ave Unit 1B Glendale, AZ | 1.0 | 1.0 | 676 | $886 | $1.31 | 1d | 1 | 0.58mi |
| 5740 N 59th Ave Unit 1A Glendale, AZ | 1.0 | 1.0 | 545 | $876 | $1.61 | 1d | 1 | 0.58mi |
| 5740 N 59th Ave Unit 2 Glendale, AZ | 2.0 | 2.0 | 926 | $1,320 | $1.43 | 1d | 1 | 0.58mi |
| 5750 N 59th Ave Unit 2 Glendale, AZ | 2.0 | 2.0 | 900 | $1,242 | $1.38 | 1d | 1 | 0.60mi |
| 5750 N 59th Ave Unit 1B Glendale, AZ | 1.0 | 1.0 | 650 | $984 | $1.51 | 1d | 1 | 0.60mi |
| 6033 W Bethany Home Rd Glendale, AZ | 1.0–2.0 | 1.0 | 700 | $1,208 | $1.73 | 5d | 1 | 0.73mi |
| 6077 N 60th Ave Glendale, AZ | 2.0–3.0 | 2.0 | 940 | $1,499 | $1.59 | 24d | 2 | 0.83mi |
| 6105 N 59th Ave Glendale, AZ | 1.0 | 1.0 | 475 | $899 | $1.89 | 1d | 1 | 0.85mi |
| 5201 W Camelback Rd Lot FC200 Phoenix, AZ | 2.0 | 1.0 | 672 | $1,400 | $2.08 | 1d | 1 | 0.89mi |
| 6017 N 61st Ave Glendale, AZ | 1.0 | 1.0 | 550 | $875 | $1.59 | 1d | 1 | 0.90mi |
| 6141 N 59th Ave Glendale, AZ | 1.0–2.0 | 1.0–2.0 | 796 | $1,300 | $1.63 | 1d | 1 | 0.92mi |
| 5947 W Rose Ln Unit 5947-17 Glendale, AZ | 2.0 | 1.0 | 750 | $1,275 | $1.70 | 17d | 1 | 0.98mi |
| 5947 W Rose Ln Unit 5947-21 Glendale, AZ | 2.0 | 1.0 | 900 | $1,170 | $1.30 | 1d | 1 | 0.98mi |
| 5947 W Rose Ln Unit 5927-09 Glendale, AZ | 1.0 | 1.0 | 600 | $1,030 | $1.72 | 1d | 1 | 0.98mi |
| 5926 W Rose Ln Unit A Glendale, AZ | 2.0 | 1.0 | 750 | $1,435 | $1.91 | 1d | 1 | 1.00mi |
| 4337 N 53rd Ln Phoenix, AZ | 2.0 | 2.0 | 936 | $1,450 | $1.55 | 15d | 1 | 1.04mi |
| 4337 N 53rd Ln Phoenix, AZ | 1.0 | 1.0 | 675 | $1,135 | $1.68 | 1d | 1 | 1.04mi |
| 4337 N 53rd Ln Unit A1 Phoenix, AZ | 1.0 | 1.0 | 675 | $1,185 | $1.76 | 1d | 1 | 1.04mi |
| 4337 N 53rd Ln Unit B1 Phoenix, AZ | 2.0 | 2.0 | 936 | $1,310 | $1.40 | 1d | 1 | 1.04mi |
| 4429 N 53rd Ln Unit 4 Phoenix, AZ | 2.0 | 1.0 | 900 | $1,150 | $1.28 | 1d | 1 | 1.04mi |
| 4429 N 53rd Ln Unit 3 Phoenix, AZ | 2.0 | 1.5 | 900 | $1,150 | $1.28 | 1d | 1 | 1.04mi |
| 4418 N 53rd Ln Apt 3 Phoenix, AZ | 2.0 | 2.0 | 1012 | $1,000 | $0.99 | 1d | 1 | 1.04mi |
| 6565 W Bethany Home Rd Glendale, AZ | 2.0 | 1.0 | 650 | $1,231 | $1.89 | 1d | 14 | 1.11mi |
| 6240 N 63rd Ave Glendale, AZ | 1.0–2.0 | 1.0–2.0 | 758 | $1,263 | $1.67 | 1d | 10 | 1.23mi |
| 6541 W Keim Dr Glendale, AZ | 2.0 | 1.0 | 896 | $1,499 | $1.67 | 10d | 1 | 1.26mi |
| 6301 N 64th Dr Glendale, AZ | 1.0–3.0 | 1.0–2.0 | 796 | $1,157 | $1.45 | 1d | 3 | 1.26mi |
| 6301 N 64th Dr Glendale, AZ | 1.0 | 1.0 | 647 | $815 | $1.26 | 17d | 1 | 1.26mi |
| 6301 N 64th Dr Glendale, AZ | 2.0 | 1.0 | 853 | $915 | $1.07 | 22d | 1 | 1.26mi |
| 6320 N 63rd Ave Unit 23 Glendale, AZ | 1.0 | 1.0 | 650 | $1,299 | $2.00 | 1d | 1 | 1.28mi |
| 6320 N 63rd Ave Glendale, AZ | 2.0 | 1.0 | 750 | $1,249 | $1.67 | 1d | 1 | 1.28mi |
Listing history 16 events
-
2026-06-18days on market $79,900 Active 91 DOM
-
2026-06-17days on market $79,900 Active 90 DOM
-
2026-06-16days on market $79,900 Active 89 DOM
-
2026-06-15days on market $79,900 Active 88 DOM
-
2026-06-13days on market $79,900 Active 86 DOM
-
2026-06-13days on market $79,900 Active 85 DOM
-
2026-06-09days on market $79,900 Active 82 DOM
-
2026-06-08days on market $79,900 Active 81 DOM
-
2026-06-07days on market $79,900 Active 80 DOM
-
2026-06-04days on market $79,900 Active 77 DOM
-
2026-06-03days on market $79,900 Active 76 DOM
-
2026-06-02days on market $79,900 Active 75 DOM
-
2026-06-01days on market $79,900 Active 74 DOM
-
2026-05-31days on market $79,900 Active 73 DOM
-
2026-03-24price $79,900
-
2026-03-19$84,999 Active
ⓘ Source: listings_history table (triggers on properties + properties_extension) + one-shot
backfill from property_details.listing_events for pre-trigger history.
Climate risk First Street
- Flood 1/10 Low FEMA zone X (shaded) · 0% chance over 30 yrs
- Wildfire 1/10 Low
- Heat 9/10 Extreme 6 d/yr ≥112°F today · 16 d/yr by 30 yrs out
- Wind 1/10 Low
- Air quality 2/10 Low 0 unhealthy d/yr today · 1 by 30 yrs out
Nearby sold comps map
Loading sold comps map…
Walkable amenities ~0.75 mi
Loading nearby amenities…
Taxation est. · year 1
- Rental income
- $15,563
- − Mortgage interest
- −$4,476
- − Property taxes
- −$1,198
- − Insurance
- −$400
- − Repairs & maintenance
- −$1,245
- − Management
- −$1,245
- − Depreciation
- −$2,324
- Taxable income
- $4,675
- Est. tax owed @ 24.0%
- −$1,122
- After-tax cash flow
- $4,547/yr
For passive investors: Depreciation is non-cash, so a rental often shows a tax loss while cash-flowing — sheltering income. Rental losses are passive: they offset passive income freely, and up to $25,000/yr can offset ordinary (W-2) income if you actively participate and your MAGI is under $100k (phasing out to $0 by $150k); unused losses carry forward. On sale, claimed depreciation is recaptured at up to 25%, and gains may owe capital-gains tax (a 1031 exchange can defer both). Figures are a year-1 estimate at your 24.0% rate — not tax advice; consult a CPA.
Condition & rehab AI · 3 photos
This manufactured home requires moderate repairs and maintenance, including exterior painting and driveway repair, to improve its condition and value.
Repairs flagged
- Major exterior siding — Significant wear and tear
- Major driveway — Cracked asphalt
- Major interior walls — No photos, but likely in poor condition
Value-add opportunities
- Both paint exterior — Enhances curb appeal and value
- Both repair driveway — Improves safety and property value
Renovation cost estimate screening
| Repair item | Severity | Est. cost |
|---|---|---|
| exterior siding · Significant wear and tear | Major | $15,000–50,000 |
| driveway · Cracked asphalt | Major | $15,000–50,000 |
| interior walls · No photos, but likely in poor condition | Major | $15,000–50,000 |
| Total estimated repair cost · 3 items | $45,000–150,000 |
Value-add ROI direction
- Both paint exterior — Enhances curb appeal and value ↑
- Both repair driveway — Improves safety and property value ↑
ⓘ Cost ranges are severity-bucket heuristics (US national rule-of-thumb). Get contractor quotes + a written scope before underwriting a rehab budget.
Schools (NCES district)
- District
- Phoenix Union High School District (4286)
- NCES district ID
- 0406330
- Math proficiency
- 10% ▼ -27.00%
- Reading proficiency
- 15% ▼ -18.00%
- Median HH income
- $39,055
- Composite
- 10.63/100
- National rank
- #9773
- State rank
- #224 of 249 in AZ
Livability — Glendale
- Score
- 76/100
- State rank
- #12
- US rank
- #3235
Category grades
Schools grade is shown separately in the Schools card above.
Census & demographics
- Census place
- Glendale, AZ
- County
- Maricopa County · 4,537,380 people
- City population
- 294,586
- Metro
- Phoenix-Mesa-Chandler, AZ
- Population (ZIP)
- 68,178
- Household income
- $53,827
- Rent vs Own
- Severe rent burden
- 3741.0
Population outlook (Maricopa County) Hauer SSP2
- Today (2025)
- 4,979,203 people
- By 2030
- 5,378,229 · +8.0%
- By 2040
- 6,156,598 · +23.6%
- By 2050
- 6,872,376 · +38.0%
- By 2075
- 8,401,270 · +68.7%
- By 2100
- 9,247,439 · +85.7%
Race, ethnicity, and origin ACS 2023
- Neighborhood character
- Majority Hispanic (63%)
- Race & ethnicity
- Hispanic / Latino 63% Two or more races 37% White 22% Black 8% Asian 2% Native American 2%
- Hispanic origin (detail)
- Mexican 57% Cuban 1%
- Common ancestry
- Slovak 1% Italian 1%
- Foreign-born
- 26% · Canada, Vietnam, Philippines
- Languages at home
- 46% English-only · Spanish 48% Arabic 1% Other Indo-European 1%
Political lean MEDSL · Maricopa
- 2024 margin
- Toss-up / Even · D 47.7% · R 51.2% · Other 1.1%
- 2008→2024 swing
- +7.1pp toward D · 2008: -10.6pp · 2024: -3.5pp
- All cycles
- 2024: R+3.5 2020: D+2.2 2016: R+3.5 2012: R+12.0 2008: R+10.6
Not yet ingested
- Civics
- —
Market trends
- HPI YoY
- ▼ -50.49%
- Current HPI
- 427.3069
- Rent YoY
- ▼ -2.98%
- Metro
- Phoenix-Mesa-Chandler, AZ
- State GDP YoY
- ▲ 4.54%
- F500 in state
- 20
Industry mix (Fortune 500 HQ in AZ)
| Industry | F500 HQs | Revenue |
|---|---|---|
| Technology | 2 | $13B |
|
||
| Mining / Metals | 1 | $23B |
|
||
| Environmental Services | 1 | $16B |
|
||
| Metals / Steel | 1 | $14B |
|
||
| Technology Distribution | 1 | $9B |
|
||
| Homebuilding | 1 | $8B |
|
||
Price history
-6.0% since first listed2 events — show timeline
- 2026-03-24 Price Changed $79,900 ARMLS
- 2026-03-19 Listed $84,999 ARMLS
Cash-flow waterfall
monthlySold comps — $/sqft
last 12 mo · ≤1 miLoading sold comps…