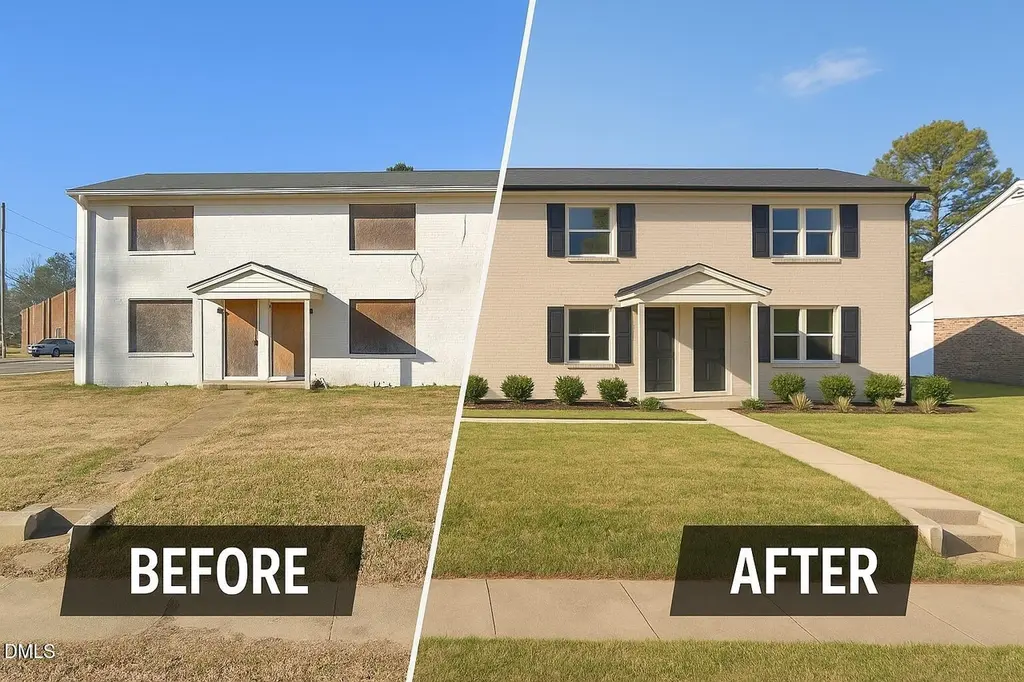
 Fourplex
2004 S Church St · Rocky Mount, NC
Flood risk 1/10 · Minimal
- FEMA flood zone
- X (unshaded)
- Chance of flooding over 30 yrs
- 0.0%
- Est. flood insurance / yr
- $507 – $1,088
Fire risk 3/10 · Minor
- Est. fire insurance / yr
- $906 – $1,684
Heat risk 8/10 · Major
- Hot days now (above 107°F)
- 7 days/yr
- Hot days in 30 yrs
- 16 days/yr
Wind risk 6/10 · Moderate
- Chance of severe wind over 30 yrs
- 68.0%
Air-quality risk 2/10 · Minimal
- Unhealthy air days now
- 1 days/yr
- Unhealthy air days in 30 yrs
- 2 days/yr
Risk factors via First Street. Map © Google.
Why this score? — see what drove the B- grade
The composite is a weighted blend of 9 inputs, each scored 0–100. Each bar is that input's sub-score; the figure is the points it added to the 100-point composite (weight × sub-score).
- Cash flow +30.0/30.0
- 1% rule +10.0/10.0
- DSCR +10.0/10.0
- ARV discount +7.5/15.0
- Rent growth +3.9/5.0
- Livability +3.5/5.0
- Condition / age +2.5/5.0
- Schools +2.2/10.0
- Appreciation +0.0/10.0
$145,000
🖨 Deal sheet 📄 Offer letter ✓ Due diligence
Multi-family units
County records classify this as Multi-Family (2-4 Unit). Listing-text estimate: 4 units. confirmed
Listing remarks
Investor Special! Quadruplex in Rocky Mount Calling all investors - incredible opportunity with huge upside! This four-unit property offers a total of 3,968 sq ft across four spacious 2 bedroom, 1.5 bath units (each 992 sq ft). Property needs a full rehab and will not qualify for conventional financing - cash or hard money only. The heavy lifting has already been done: both a professional appraisal and renovation estimate are in hand, and the seller is willing to complete the rehab turn-key for approximately $150,000 (depending on finishes). Appraised Value (Sales Comparison): $312,000 Appraised Value (Income Approach): $339,000 Section 8 Approved Rent: $1,130 per unit Projected
Key facts
- 0.3 acre lot
- 8 parking spots
- Built 1972
Property features AI
Finance
- Financial info: 4 total units
- HOA & community: No association
Exterior
- Parking: Common open parking with 8 spaces
- Utilities: Public water; Public sewer
- Home design: Multi-family quadruplex; Two levels
- Construction: Brick veneer and vinyl siding; Shingle roof; Slab foundation; 1 building
- Exterior features: Covered rear porch
Interior
- Bedrooms: No bedrooms listed (property configured as multi-family units)
- Flooring: Combination flooring
- Bathrooms: 4 full bathrooms
- Heating & cooling: Central heating; Central air conditioning
- Interior features: Combination flooring; Property listed as fixer condition
- Laundry & utility: Tenants pay all utilities; Owner responsible for grounds care
Neighborhood map
What this means for you Summary
Snapshot
- This is a 4 × 2.0-bed/1.5-bath units multifamily listed at $145k.
Deal economics
- At list price, monthly cash flow is $3k ($33k/yr) — positive. Per door: $693/mo.
- The deal already cash-flows at list — no discount required.
- Meets the 1% rule at list price ($5k rent vs $145k).
- Recommended offer: $136k (6.0% below list) — sets the bar for market timing.
- Cap rate 29.2% vs local median 4.5% in Rocky Mount — top-decile yield for the area; either an underpriced asset or a hidden risk that comps aren't pricing in. Stress-test before assuming the spread holds.
Location & tenants
- Location reads 70/100 on livability (#134 in NC) — a middle-class / working-renter tenant base. Strengths: cost of living A+, housing A+, health & safety A+; Watch: crime F, amenities F, employment F.
- Nash-Rocky Mount Schools (rural): math 20% / reading 32% proficiency, ranked #155 of 178 in NC (top 87%) — low school quality limits family demand, transient renter base, plan for 1-2y turnover.
- Zoned schools: Rocky Mount Middle (math 7% / reading 26%, grade F, #449 of 475 statewide, top 96%, 407 students, 97% FRL); Rocky Mount High (math 27% / reading 36%, grade F, #449 of 535 statewide, top 85%, 1,072 students, 76% FRL) — zoned schools average 86% FRL vs 59% district-wide (27 pts higher); higher-poverty schools than district average — tighter screening recommended.
- Market conditions: Rents rising fast (+5.5%/yr); 171 active listings in the ZIP; 500 units permitted in Nash County in 2024 (0 in 5+ unit buildings).
- At $4,619/mo this rent would consume 92% of the median local household income ($60k/yr) (locally 641% of renters already pay >50% of income on rent) — very limited rent-growth headroom before tenants either downsize or default.
Forward outlook
- Local home prices are declining (-3.0%/yr); year-one equity from $1k of loan paydown is wiped out by about $4k of value loss. Plan a longer hold.
- Nash County population projected at -12% by 2050 — secular population decline; favor cash flow + early exit over multi-decade hold.
- At projected returns (-3.0% appreciation + 5.5% rent growth), your $41k cash investment doubles in ~2 years — after that, you're playing with house money.
Negotiation context
- It's been on market 80 days — a 6% lower offer ($136k) is reasonable based on typical stale-listing flexibility.
- 3 sale attempts; this cycle's ask has dropped $14k (9%) from the opening price — seller is motivated, your offer sets the floor, not the list.
- Current owner paid $70k; list at $145k implies a 109% gain — meaningful room to come down on a strong offer.
Risks & watch-outs
- Climate carrying-cost: major wind risk, 68% chance of damaging wind over 30y; extreme-heat days projected 7→16/yr by 2055 (HVAC capex compounding) — expect insurance premiums to compound above CPI over the hold.
Questions for the listing agent
- It's been on market 80 days. Have you received any prior offers? Is the seller open to a 6% concession, seller financing, or rate buy-down credit?
- Can we see the unit-by-unit rent roll, current vacancy, and any below-market leases? What's the average tenancy length?
- What capital expenditures (roof, boiler, parking lot, exteriors) have been made in the last 5 years, and what's planned in the next 2?
- Built in 1972 — when were the roof, HVAC, electrical panel, plumbing, and water heater last replaced?
- Why hasn't it sold? Are there any deal-killer items the seller is aware of (foundation, flood, title, zoning, code violations)?
- Is there a deadline driving the sale (1031 exchange, divorce, estate, relocation)? That informs how much negotiation room exists.
- Schools are F-rated, which usually means shorter tenancies and higher turnover. Who's the typical renter profile here, and what's been the actual vacancy rate?
- Crime grade is F in this area — have there been break-ins, vandalism, or insurance claims at this property in the last 3 years? What carrier currently insures it and at what premium?
- What's the average days-on-market for RENTAL listings here right now (not sales)? A rising rental-DOM trend means longer vacancies and softer asking-rent achievability than the comps imply.
- What's the recent tenant-quality profile in this submarket — average credit score on applications, eviction rate, late-payment / NSF rate, and stable-employment percentage? A property-management company in the area should have these aggregated.
- How much new apartment / multifamily construction is in the pipeline within 1–3 miles? Heavy new supply (>2% of stock underway) typically softens rents 12–24 months out; light construction supports rent growth.
Investment metrics
- 1% rule
- 3.19% ✓
- Cap rate
- 29.24%
- Cash-on-cash
- 81.94%
- DSCR
- 4.65
- GRM
- 2.6
CMA / ARV
No comps found within radius.
Projected returns pro-forma
-3.0% appreciation · 5.51% rent growth · sell at horizon
- IRR
- 84.9%
- Equity multiple
- 5.06×
- Total profit
- $165,016
- Equity at exit
- $21,620
- IRR
- 88.7%
- Equity multiple
- 11.41×
- Total profit
- $422,674
- Equity at exit
- $12,537
Cash invested: $40,600 (down + closing). Projections, not guarantees.
Landlord ↔ Tenant lean methodology
- Overall (STATE)
- 85 Strongly Landlord-Friendly
- State North Carolina
- 85 Strongly Landlord-Friendly · R+3
- County
- — inherits STATE
- City
- — inherits STATE
ZIP-level market 27803
- Rents YoY
- 5.5%
- Active inventory
- 171
- Price-to-rent
- 10.5×
Monthly cashflow live
- Estimated rent
- $4,619 medium interval (Pro) →
- Mortgage (P&I)
- −$760
- Tax from tax record
- −$56 /mo · $672/yr
- Insurance
- −$60
- HOA
- −$0
- Vacancy / Maint / Mgmt
- −$970
- Net cashflow
- $2,772
Break-even live
4-unit breakdown (identical units grouped — click to expand)
| Units | Beds | Baths | Est. rent |
|---|---|---|---|
| 4× units | 2.0 | 1.5 | $4,620 |
| #1 | 2.0 | 1.5 | $1,155 |
| #2 | 2.0 | 1.5 | $1,155 |
| #3 | 2.0 | 1.5 | $1,155 |
| #4 | 2.0 | 1.5 | $1,155 |
| Total (4 units) | $4,619 | ||
UW: 25.0% down · 7.5% · 30yr · 1.5% tax · 5.0% vac · 8.0% maint · 8.0% mgmt
Financing live
Cash to close
- Down payment
- $36,250
- Closing costs
- $4,350
- Reserves months
- —
- Total cash needed
- —
Loan-product check · same deal, 3 products live
Conventional
25% down · 7.5% · 30yr
- Down + closing
- —
- Monthly P&I
- —
- Monthly cashflow
- —
- DSCR
- —
- Eligible?
- —
Personal DTI + credit; lowest rate.
DSCR
20% down · 8.5% · 30yr
- Down + closing
- —
- Monthly P&I
- —
- Monthly cashflow
- —
- DSCR
- —
- Eligible?
- —
No personal income docs; deal must DSCR.
Hard money
10% down · 12.0% · 12mo
- Down + closing
- —
- Monthly P&I
- —
- Monthly cashflow
- —
- DSCR
- —
- Eligible?
- —
Short-term bridge; refi at stabilization.
Listing history 18 events
-
2026-06-13statusdays on market $145,000 Pending 80 DOM
-
2026-06-10days on market $145,000 Active 78 DOM
-
2026-06-09days on market $145,000 Active 77 DOM
-
2026-06-08days on market $145,000 Active 76 DOM
-
2026-06-07days on market $145,000 Active 75 DOM
-
2026-06-03days on market $145,000 Active 71 DOM
-
2026-06-02days on market $145,000 Active 70 DOM
-
2026-06-01days on market $145,000 Active 69 DOM
-
2026-05-31days on market $145,000 Active 68 DOM
-
2026-05-30days on market $145,000 Active 67 DOM
-
2026-04-18status Active
-
2026-04-18price $145,000
-
2026-04-08historical Active Under Contract
-
2026-03-24$159,000 Active
-
2026-03-23historical
-
2026-02-18price $174,000
-
2025-09-27$189,000 Active
-
2025-04-09soldstatus $69,500
ⓘ Source: listings_history table (triggers on properties + properties_extension) + one-shot
backfill from property_details.listing_events for pre-trigger history.
Tax reassessment forecast NC · Resets to sale price
- Current annual tax
- $672 · $56/mo
- Projected year-2 tax
- $1,189 · $99/mo
- Expected delta
- +$517/yr (+$43/mo · 76.9%)
ⓘ Screening estimate from a state-policy table — verify with the county assessor before closing.
Climate risk First Street
- Flood 1/10 Low FEMA zone X (unshaded) · 0% chance over 30 yrs
- Wildfire 3/10 Moderate
- Heat 8/10 Severe 7 d/yr ≥107°F today · 16 d/yr by 30 yrs out
- Wind 6/10 Major 68% chance of damaging wind over 30 yrs
- Air quality 2/10 Low 1 unhealthy d/yr today · 2 by 30 yrs out
Nearby sold comps map
Loading sold comps map…
Walkable amenities ~0.75 mi
Loading nearby amenities…
Taxation est. · year 1
- Rental income
- $55,428
- − Mortgage interest
- −$8,122
- − Property taxes
- −$672
- − Insurance
- −$725
- − Repairs & maintenance
- −$4,434
- − Management
- −$4,434
- − Depreciation
- −$4,218
- Taxable income
- $32,822
- Est. tax owed @ 24.0%
- −$7,877
- After-tax cash flow
- $25,389/yr
For passive investors: Depreciation is non-cash, so a rental often shows a tax loss while cash-flowing — sheltering income. Rental losses are passive: they offset passive income freely, and up to $25,000/yr can offset ordinary (W-2) income if you actively participate and your MAGI is under $100k (phasing out to $0 by $150k); unused losses carry forward. On sale, claimed depreciation is recaptured at up to 25%, and gains may owe capital-gains tax (a 1031 exchange can defer both). Figures are a year-1 estimate at your 24.0% rate — not tax advice; consult a CPA.
Schools (NCES district)
- District
- Nash-Rocky Mount Schools
- NCES district ID
- 3703270
- Math proficiency
- 20% ▼ -3.00%
- Reading proficiency
- 32% ▲ 1.00%
- Median HH income
- $41,553
- Composite
- 22.04/100
- National rank
- #8198
- State rank
- #155 of 178 in NC
Livability — Rocky Mount
- Score
- 70/100
- State rank
- #134
- US rank
- #7692
Category grades
Schools grade is shown separately in the Schools card above.
Census & demographics
- Census place
- Rocky Mount, NC
- County
- Nash County · 50,768 people
- City population
- 70,300
- Metro
- Rocky Mount, NC
- Population (ZIP)
- 20,055
- Household income
- $60,124
- Rent vs Own
- Severe rent burden
- 641.0
Population outlook (Nash County) Hauer SSP2
- Today (2025)
- 91,107 people
- By 2030
- 89,193 · -2.1%
- By 2040
- 84,959 · -6.7%
- By 2050
- 80,517 · -11.6%
- By 2075
- 72,941 · -19.9%
- By 2100
- 63,602 · -30.2%
Race, ethnicity, and origin ACS 2023
- Neighborhood character
- Diverse neighborhood (Simpson 0.60)
- Race & ethnicity
- White 46% Black 44% Two or more races 6% Hispanic / Latino 5% Asian 1%
- Common ancestry
- Iranian 1% Italian 1% Slovak 1%
- Foreign-born
- 3% · Canada
- Languages at home
- 93% English-only · Spanish 5% Arabic 1% Other Indo-European 1%
Political lean MEDSL · Nash
- 2024 margin
- Toss-up / Even · D 48.7% · R 50.5%
- 2008→2024 swing
- -0.4pp no change · 2008: -1.3pp · 2024: -1.8pp
- All cycles
- 2024: R+1.8 2020: D+0.2 2016: R+0.2 2012: D+0.9 2008: R+1.3
Not yet ingested
- Civics
- —
Market trends
- HPI YoY
- ▼ -162.95%
- Current HPI
- 190.0204
- Rent YoY
- ▲ 5.51%
- Metro
- Rocky Mount, NC
- State GDP YoY
- ▲ 3.28%
- F500 in state
- 26
Industry mix (Fortune 500 HQ in NC)
| Industry | F500 HQs | Revenue |
|---|---|---|
| Financial Services | 2 | $213B |
|
||
| Retail | 2 | $95B |
|
||
| Industrial Conglomerate | 1 | $38B |
|
||
| Metals / Steel | 1 | $35B |
|
||
| Utilities | 1 | $30B |
|
||
| Industrial Machinery | 1 | $19B |
|
||
Price history
+108.6% since first listed8 events — show timeline
- 2026-04-18 Relisted — TMLS
- 2026-04-18 Price Changed $145,000 TMLS
- 2026-04-08 Contingent — TMLS
- 2026-03-24 Listed $159,000 TMLS
- 2026-03-23 Listing Removed — TMLS
- 2026-02-18 Price Changed $174,000 TMLS
- 2025-09-27 Listed $189,000 TMLS
- 2025-04-09 Sold (Public Records) $69,500 Public Records
Property tax history
+14.2%/yrLatest (2025): $672 · +0.0% YoY. Source: county tax records.
Cash-flow waterfall
monthlySold comps — $/sqft
last 12 mo · ≤1 miLoading sold comps…