 🔨 Auction
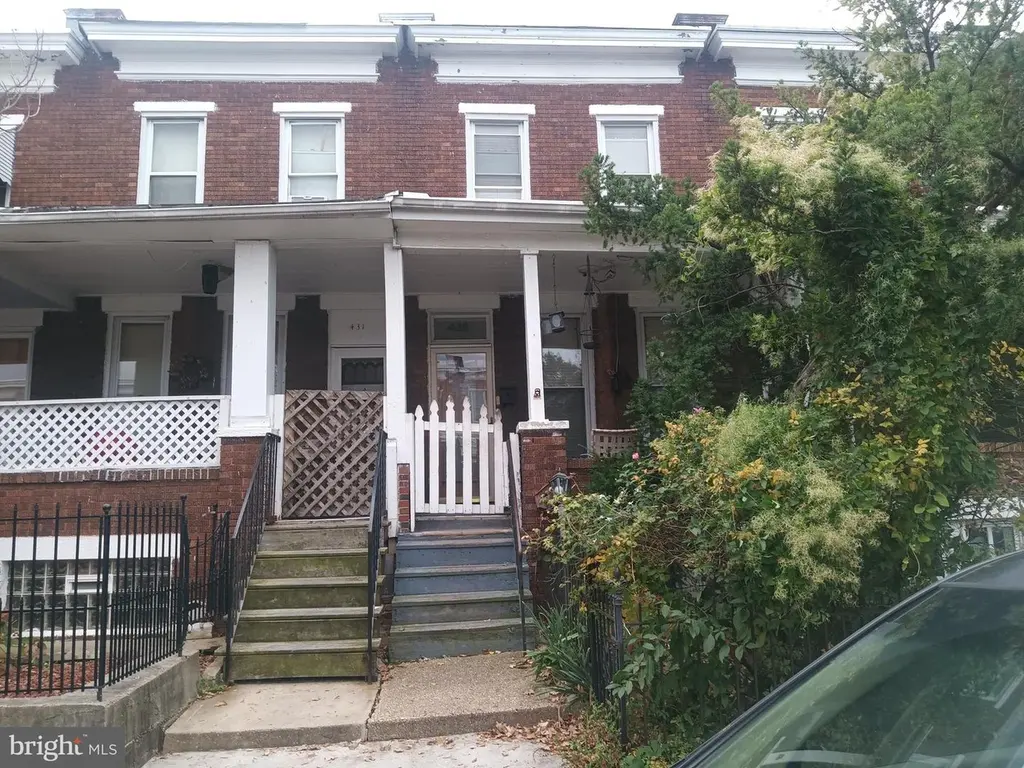
429 Ilchester Ave · Baltimore, MD
Flood risk 1/10 · Minimal
- FEMA flood zone
- X (unshaded)
- Chance of flooding over 30 yrs
- 0.0%
- Est. flood insurance / yr
- $473 – $860
Fire risk 1/10 · Minimal
- Est. fire insurance / yr
- $755 – $1,403
Heat risk 7/10 · Major
- Hot days now (above 103°F)
- 7 days/yr
- Hot days in 30 yrs
- 15 days/yr
Wind risk 6/10 · Moderate
- Chance of severe wind over 30 yrs
- 27.0%
Air-quality risk 4/10 · Minor
- Unhealthy air days now
- 6 days/yr
- Unhealthy air days in 30 yrs
- 7 days/yr
Risk factors via First Street. Map © Google.
Why this score? — see what drove the D grade
The composite is a weighted blend of 9 inputs, each scored 0–100. Each bar is that input's sub-score; the figure is the points it added to the 100-point composite (weight × sub-score).
- Cash flow +15.1/30.0
- ARV discount +7.5/15.0
- DSCR +4.6/10.0
- 1% rule +4.2/10.0
- Livability +3.8/5.0
- Rent growth +2.9/5.0
- Condition / age +2.5/5.0
- Schools +1.0/10.0
- Appreciation +0.0/10.0
$35,000
🖨 Deal sheet 📄 Offer letter ✓ Due diligence
Listing remarks MLS
ONLINE AUCTION: This auction takes place on the Ashland Auction Group website bidding platform. Bidding begins 6/11/2026 @ 10:00 AM. Bidding ends 6/15/2026 @ 12:20 PM. The list price is the suggested opening bid. Deposit: $7,500. This two-story townhouse is located in the Harwood neighborhood of Baltimore City. Residents can enjoy the nearby facilities and attractions such as the Baltimore Museum of Art, Johns Hopkins University, and Druid Hill Park. The property is occupied. The area offers convenient access to major routes, including Interstate 83 and the Baltimore Beltway, ensuring efficient travel to other parts of the city and surrounding region.
Key facts
- Built 1920
- Listed 238 days
Neighborhood map
What this means for you Summary
Snapshot
- This is a 2-bed/1.0-bath townhouse listed at $35k.
Deal economics
- At list price, monthly cash flow is $58 ($701/yr) — positive.
- The deal already cash-flows at list — no discount required.
- Meets the 1% rule at list price ($2k rent vs $35k).
- Recommended offer: $31k (12.0% below list) — sets the bar for market timing.
Location & tenants
- Location reads 76/100 on livability (#90 in MD, #3,396 nationally) — a middle-class / working-renter tenant base. Strengths: amenities A+, commute A+, housing A+; Watch: schools D, crime F.
- Baltimore City Public Schools (urban): math 7% / reading 16% proficiency, ranked #24 of 24 in MD (top 100%) — low school quality limits family demand, transient renter base, plan for 1-2y turnover; 79% free/reduced lunch — lower-income household profile, screen leases tightly.
- Market conditions: Rents rising (+1.6%/yr); 325 active listings in the ZIP; 40 comparable units currently listed for rent nearby; rentals at typical pace (median 24d on market — plan ~3-4 weeks tenant-placement turnaround); 1,273 units permitted in Baltimore city in 2024 (1,104 in 5+ unit buildings).
- This rent runs 31% of the median local income ($62k/yr) — at the standard rent-burdened threshold; future hikes will face affordability resistance.
Forward outlook
- Local home prices are declining (-3.0%/yr); year-one equity from $1k of loan paydown is wiped out by about $5k of value loss. Plan a longer hold.
- Baltimore County population projected to shrink 4% by 2050 — rents likely to lag national; underwrite the cash flow, not the appreciation.
Negotiation context
- It's been on market 238 days — a 12% lower offer ($31k) is reasonable based on typical stale-listing flexibility.
Risks & watch-outs
- Watch-outs: property tax is 7.5% of price; built in 1920 — expect roof / HVAC / electrical / plumbing capex.
- Climate carrying-cost: major wind risk, 27% chance of damaging wind over 30y; extreme-heat days projected 7→15/yr by 2055 (HVAC capex compounding) — expect insurance premiums to compound above CPI over the hold.
Questions for the listing agent
- It's been on market 238 days. Have you received any prior offers? Is the seller open to a 12% concession, seller financing, or rate buy-down credit?
- Built in 1920 — when were the roof, HVAC, electrical panel, plumbing, and water heater last replaced?
- Property tax is high relative to price — has the assessment been appealed recently, and will the sale trigger a re-assessment?
- Why hasn't it sold? Are there any deal-killer items the seller is aware of (foundation, flood, title, zoning, code violations)?
- Is there a deadline driving the sale (1031 exchange, divorce, estate, relocation)? That informs how much negotiation room exists.
- Schools are D-rated, which usually means shorter tenancies and higher turnover. Who's the typical renter profile here, and what's been the actual vacancy rate?
- Crime grade is F in this area — have there been break-ins, vandalism, or insurance claims at this property in the last 3 years? What carrier currently insures it and at what premium?
- The area grade is low — what's the realistic commute time and amenity access for the typical tenant pool here? Any planned neighborhood developments (good or bad) we should know about?
- What's the average days-on-market for RENTAL listings here right now (not sales)? A rising rental-DOM trend means longer vacancies and softer asking-rent achievability than the comps imply.
- What's the recent tenant-quality profile in this submarket — average credit score on applications, eviction rate, late-payment / NSF rate, and stable-employment percentage? A property-management company in the area should have these aggregated.
- How much new for-sale + rental construction is in the pipeline within 1–3 miles? Heavy new supply typically softens prices + rents 12–24 months out; constrained supply supports both.
Investment metrics
- 1% rule
- 0.92% ✗
- Cap rate
- 6.69%
- Cash-on-cash
- 1.43%
- DSCR
- 1.06
- GRM
- 9.1
CMA / ARV
- ARV (median comp)
- $174,929
- List price
- $35,000
- Delta
- -79.99%
- Verdict
- UNDERPRICED
- Comps
- 20 within 1.0 mi
Show comp detail 12 sales within ~0.75 mi
| Address | Dist | Beds/Ba | Sqft | Sold | Price | $/sf | Match |
|---|---|---|---|---|---|---|---|
| 616 E 30th St | 0.19mi | 2/1.0 | 1,092 (-8%) | 1mo | $65,000 | $60 | 76 |
| 2956 Greenmount Ave | 0.14mi | 3/2.0 (+1) | 1,130 (-5%) | 1mo | $209,395 | $185 | 76 |
| 2821 Remington Ave | 0.61mi | 2/2.0 | 1,170 (-2%) | 1mo | $265,000 | $226 | 64 |
| 3405 Greenway #302 | 0.62mi | 2/1.5 | 1,221 (+3%) | 1mo | $265,000 | $217 | 64 |
| 2540 Greenmount Ave | 0.24mi | 3/1.0 (+1) | 1,340 (+13%) | 0mo | $79,000 | $59 | 62 |
| 728 Bartlett Ave | 0.52mi | 3/1.0 (+1) | 1,100 (-7%) | 2mo | $40,000 | $36 | 57 |
| 604 E 35th St E | 0.60mi | 3/1.0 (+1) | 1,260 (+6%) | 1mo | $94,000 | $75 | 56 |
| 515 E 35th St | 0.57mi | 3/1.5 (+1) | 1,260 (+6%) | 1mo | $135,999 | $108 | 56 |
| 2713 Hampden Ave | 0.73mi | 2/2.5 | 1,138 (-4%) | 1mo | $320,000 | $281 | 52 |
| 2559 Garrett Ave | 0.70mi | 3/3.0 (+1) | 1,202 (+1%) | 2mo | $205,000 | $171 | 51 |
| 2602 Miles Ave | 0.69mi | 3/2.0 (+1) | 1,084 (-9%) | 1mo | $240,000 | $221 | 43 |
| 2545 Cecil Ave | 0.63mi | 3/2.5 (+1) | 1,318 (+11%) | 1mo | $215,000 | $163 | 40 |
Match score weights: distance 35% · size 25% · config 20% · recency 20%. Top-matched comps best support the ARV.
Projected returns pro-forma
-3.0% appreciation · 1.63% rent growth · sell at horizon
- IRR
- -15.6%
- Equity multiple
- 0.45×
- Total profit
- $-26,782
- Equity at exit
- $26,082
- IRR
- -9.6%
- Equity multiple
- 0.45×
- Total profit
- $-27,139
- Equity at exit
- $15,125
Cash invested: $48,980 (down + closing). Projections, not guarantees.
Landlord ↔ Tenant lean methodology
- Overall (CITY)
- 12 Strongly Tenant-Friendly
- State Maryland
- 27 Tenant-Leaning · D+14
- County
- — inherits STATE
- City Baltimore
- 12 Strongly Tenant-Friendly · D+58
ZIP-level market 21218
- Rents YoY
- 1.6%
- Active inventory
- 325
- Price-to-rent
- 1.8×
Monthly cashflow live
- Estimated rent
- $1,604 high interval (Pro) →
- Mortgage (P&I)
- −$917
- Tax est. 1.5%
- −$219 /mo · $2,624/yr
- Insurance
- −$73
- HOA
- −$0
- Vacancy / Maint / Mgmt
- −$337
- Net cashflow
- $58
Break-even live
UW: 25.0% down · 7.5% · 30yr · 1.5% tax · 5.0% vac · 8.0% maint · 8.0% mgmt
Financing live
Cash to close
- Down payment
- $43,732
- Closing costs
- $5,248
- Reserves months
- —
- Total cash needed
- —
Loan-product check · same deal, 3 products live
Conventional
25% down · 7.5% · 30yr
- Down + closing
- —
- Monthly P&I
- —
- Monthly cashflow
- —
- DSCR
- —
- Eligible?
- —
Personal DTI + credit; lowest rate.
DSCR
20% down · 8.5% · 30yr
- Down + closing
- —
- Monthly P&I
- —
- Monthly cashflow
- —
- DSCR
- —
- Eligible?
- —
No personal income docs; deal must DSCR.
Hard money
10% down · 12.0% · 12mo
- Down + closing
- —
- Monthly P&I
- —
- Monthly cashflow
- —
- DSCR
- —
- Eligible?
- —
Short-term bridge; refi at stabilization.
Rent comps 40 comps
| Address | Beds | Baths | Sqft | Rent | $/sqft | DOM | Units | Dist |
|---|---|---|---|---|---|---|---|---|
| 436 Ilchester Ave Unit 2 Baltimore, MD | 1.0 | 1.0 | 985 | $1,195 | $1.21 | 43d | 1 | 0.01mi |
| 436 Ilchester Ave Unit 1 Baltimore, MD | 2.0 | 2.0 | 1002 | $1,350 | $1.35 | 43d | 1 | 0.01mi |
| 402 E 28th St Baltimore, MD | 3.0 | 1.0 | 1436 | $2,200 | $1.53 | 43d | 1 | 0.07mi |
| 519 E 28th St Baltimore, MD | 3.0 | 2.0 | 1500 | $2,000 | $1.33 | 4d | 1 | 0.13mi |
| 2821 Mathews St Unit 27-668 Baltimore, MD | 2.0 | 1.0 | 730 | $1,050 | $1.44 | 23d | 1 | 0.14mi |
| 2821 Mathews St Unit 27-666 Baltimore, MD | 1.0 | 1.0 | 730 | $1,050 | $1.44 | 23d | 1 | 0.14mi |
| 428 E Lorraine Ave Unit 1 Baltimore, MD | 3.0 | 1.5 | 1344 | $1,875 | $1.40 | 43d | 1 | 0.19mi |
| 428 E Lorraine Ave Baltimore, MD | 3.0 | 2.0 | 1344 | $1,875 | $1.40 | 23d | 1 | 0.19mi |
| 450 E Lorraine Ave Baltimore, MD | 3.0 | 1.0 | 1344 | $1,695 | $1.26 | 43d | 1 | 0.20mi |
| 3012 Mathews St Baltimore, MD | 2.0 | 1.0 | 996 | $1,100 | $1.10 | 17d | 1 | 0.20mi |
| 400 E Lorraine Ave Baltimore, MD | 3.0 | 1.0 | 1500 | $1,800 | $1.20 | 20d | 1 | 0.20mi |
| 411 E Lorraine Ave Baltimore, MD | 3.0 | 1.5 | 1344 | $2,200 | $1.64 | 23d | 1 | 0.22mi |
| 3026 Mathews St Baltimore, MD | 2.0 | 1.0 | 996 | $1,350 | $1.36 | 14d | 1 | 0.22mi |
| 205 E 30th St Baltimore, MD | 1.0 | 1.0 | 900 | $1,450 | $1.61 | 10d | 1 | 0.25mi |
| 616 Montpelier St Baltimore, MD | 3.0 | 1.0 | 1150 | $1,750 | $1.52 | 10d | 1 | 0.27mi |
| 2535 Greenmount Ave Unit 2 Baltimore, MD | 2.0 | 1.0 | 800 | $1,195 | $1.49 | 43d | 1 | 0.28mi |
| 615 Homestead St Unit 1B Baltimore, MD | 1.0 | 1.0 | 700 | $1,225 | $1.75 | 43d | 1 | 0.28mi |
| 2516 Barclay St Baltimore, MD | 3.0 | 1.0 | 992 | $1,375 | $1.39 | 16d | 1 | 0.29mi |
| 3126 Guilford Ave Apt A Baltimore, MD | 2.0 | 1.0 | 700 | $1,770 | $2.53 | 3d | 1 | 0.32mi |
| 2637 Saint Paul St Unit 1A Baltimore, MD | 2.0 | 1.0 | 850 | $1,450 | $1.71 | 4d | 1 | 0.33mi |
| 3130 Guilford Ave Apt B Baltimore, MD | 2.0 | 1.0 | 700 | $1,790 | $2.56 | 17d | 1 | 0.33mi |
| 2938 Saint Paul St Baltimore, MD | 1.0 | 1.0 | 750 | $1,350 | $1.80 | 43d | 1 | 0.34mi |
| 936 Montpelier St Baltimore, MD | 2.0 | 1.0 | 1260 | $1,450 | $1.15 | 23d | 1 | 0.35mi |
| 3135 N Calvert St Baltimore, MD | 1.0 | 1.0 | 1000 | $1,450 | $1.45 | 17d | 1 | 0.36mi |
| 3221 Guilford Ave Apt A Baltimore, MD | 3.0 | 1.5 | 1025 | $2,925 | $2.85 | 17d | 1 | 0.37mi |
| 2503 N Calvert St Unit 1 Baltimore, MD | 1.0 | 1.0 | 750 | $900 | $1.20 | 23d | 1 | 0.37mi |
| 2933 N Charles St Unit B Baltimore, MD | 1.0 | 1.0 | 990 | $1,700 | $1.72 | 4d | 1 | 0.38mi |
| 2400 Barclay St Unit A Baltimore, MD | 1.0 | 1.0 | 750 | $1,190 | $1.59 | 20d | 1 | 0.44mi |
| 3201 Saint Paul St Baltimore, MD | 1.0–2.0 | 1.5–2.0 | 1532 | $3,200 | $2.09 | 2d | 1 | 0.45mi |
| 18 W 27th St Baltimore, MD | 1.0 | 1.0 | 680 | $1,250 | $1.84 | 43d | 3 | 0.47mi |
| 2440 Saint Paul St Unit 4E Baltimore, MD | 2.0 | 2.0 | 891 | $1,625 | $1.82 | 43d | 1 | 0.48mi |
| 2752 Maryland Ave Unit 2ND FLOOR Baltimore, MD | 2.0 | 1.0 | 900 | $1,500 | $1.67 | 17d | 1 | 0.48mi |
| 646 Cokesbury Ave Baltimore, MD | 2.0 | 1.5 | 1200 | $1,299 | $1.08 | 43d | 1 | 0.49mi |
| 2314 Hunter St Unit 1 Baltimore, MD | 1.0 | 1.0 | 1000 | $1,185 | $1.19 | 43d | 1 | 0.52mi |
| 2315 St Paul St Baltimore, MD | 1.0–2.0 | 1.0 | 579 | $1,595 | $2.75 | 1d | 5 | 0.54mi |
| 3501 Saint Paul St Baltimore, MD | 3.0 | 1.0–2.5 | 916 | $2,142 | $2.34 | 1d | 172 | 0.56mi |
| 2300 N Calvert St Baltimore, MD | 1.0–2.0 | 1.0–2.0 | 1100 | $1,995 | $1.81 | 2d | 2 | 0.57mi |
| 724 E 35th St Baltimore, MD | 3.0 | 1.5 | 1368 | $2,000 | $1.46 | 14d | 1 | 0.59mi |
| 3529 Greenmount Ave Baltimore, MD | 3.0 | 2.0 | 1316 | $1,575 | $1.20 | 43d | 1 | 0.59mi |
| 2606 Cecil Ave Baltimore, MD | 2.0 | 1.5 | 1200 | $1,500 | $1.25 | 43d | 1 | 0.63mi |
Listing history 16 events
-
2026-06-18days on market $35,000 Active 238 DOM
-
2026-06-17days on market $35,000 Active 237 DOM
-
2026-06-16days on market $35,000 Active 236 DOM
-
2026-06-15days on market $35,000 Active 235 DOM
-
2026-06-13days on market $35,000 Active 233 DOM
-
2026-06-09days on market $35,000 Active 229 DOM
-
2026-06-08days on market $35,000 Active 228 DOM
-
2026-06-07days on market $35,000 Active 227 DOM
-
2026-06-04days on market $35,000 Active 224 DOM
-
2026-06-03days on market $35,000 Active 223 DOM
-
2026-06-02days on market $35,000 Active 222 DOM
-
2026-06-01days on market $35,000 Active 221 DOM
-
2026-05-31days on market $35,000 Active 220 DOM
-
2025-10-23price $35,000 662-char remark
Show marketing remark (662 chars)
ONLINE AUCTION: This auction takes place on the Ashland Auction Group website bidding platform. Bidding begins 6/11/2026 @ 10:00 AM. Bidding ends 6/15/2026 @ 12:20 PM. The list price is the suggested opening bid. Deposit: $7,500. This two-story townhouse is located in the Harwood neighborhood of Baltimore City. Residents can enjoy the nearby facilities and attractions such as the Baltimore Museum of Art, Johns Hopkins University, and Druid Hill Park. The property is occupied. The area offers convenient access to major routes, including Interstate 83 and the Baltimore Beltway, ensuring efficient travel to other parts of the city and surrounding region.
-
2025-10-23$10,000 Active 662-char remark
Show marketing remark (662 chars)
ONLINE AUCTION: This auction takes place on the Ashland Auction Group website bidding platform. Bidding begins 6/11/2026 @ 10:00 AM. Bidding ends 6/15/2026 @ 12:20 PM. The list price is the suggested opening bid. Deposit: $7,500. This two-story townhouse is located in the Harwood neighborhood of Baltimore City. Residents can enjoy the nearby facilities and attractions such as the Baltimore Museum of Art, Johns Hopkins University, and Druid Hill Park. The property is occupied. The area offers convenient access to major routes, including Interstate 83 and the Baltimore Beltway, ensuring efficient travel to other parts of the city and surrounding region.
-
2023-02-06soldstatus $396,250
ⓘ Source: listings_history table (triggers on properties + properties_extension) + one-shot
backfill from property_details.listing_events for pre-trigger history.
Climate risk First Street
- Flood 1/10 Low FEMA zone X (unshaded) · 0% chance over 30 yrs
- Wildfire 1/10 Low
- Heat 7/10 Severe 7 d/yr ≥103°F today · 15 d/yr by 30 yrs out
- Wind 6/10 Major 27% chance of damaging wind over 30 yrs
- Air quality 4/10 Moderate 6 unhealthy d/yr today · 7 by 30 yrs out
Nearby sold comps map
Loading sold comps map…
Walkable amenities ~0.75 mi
Loading nearby amenities…
Taxation est. · year 1
- Rental income
- $19,251
- − Mortgage interest
- −$9,799
- − Property taxes
- −$2,624
- − Insurance
- −$875
- − Repairs & maintenance
- −$1,540
- − Management
- −$1,540
- − Depreciation
- −$5,089
- Taxable loss
- −$2,216
- Est. tax savings @ 24.0%
- +$532
- After-tax cash flow
- $1,233/yr
For passive investors: Depreciation is non-cash, so a rental often shows a tax loss while cash-flowing — sheltering income. Rental losses are passive: they offset passive income freely, and up to $25,000/yr can offset ordinary (W-2) income if you actively participate and your MAGI is under $100k (phasing out to $0 by $150k); unused losses carry forward. On sale, claimed depreciation is recaptured at up to 25%, and gains may owe capital-gains tax (a 1031 exchange can defer both). Figures are a year-1 estimate at your 24.0% rate — not tax advice; consult a CPA.
Schools (NCES district)
- District
- Baltimore City Public Schools
- NCES district ID
- 2400090
- Math proficiency
- 7% ▼ -9.00%
- Reading proficiency
- 16% ▼ -5.00%
- Median HH income
- $42,108
- Composite
- 10.08/100
- National rank
- #9805
- State rank
- #24 of 24 in MD
Livability — Baltimore
- Score
- 76/100
- State rank
- #90
- US rank
- #3396
Category grades
Schools grade is shown separately in the Schools card above.
Census & demographics
- Census place
- Baltimore, MD
- County
- Baltimore City · 558,601 people
- City population
- 588,727
- Metro
- Baltimore-Columbia-Towson, MD
- Population (ZIP)
- 44,014
- Household income
- $62,488
- Rent vs Own
- Severe rent burden
- 2564.0
Population outlook (Baltimore County) Hauer SSP2
- Today (2025)
- 624,249 people
- By 2030
- 621,541 · -0.4%
- By 2040
- 609,756 · -2.3%
- By 2050
- 597,249 · -4.3%
- By 2075
- 552,236 · -11.5%
- By 2100
- 513,934 · -17.7%
Race, ethnicity, and origin ACS 2023
- Neighborhood character
- Diverse neighborhood (Simpson 0.58)
- Race & ethnicity
- Black 60% White 26% Two or more races 6% Hispanic / Latino 5% Asian 5%
- Hispanic origin (detail)
- Common ancestry
- Romanian 2% Italian 1% Scotch-Irish 1%
- Foreign-born
- 10% · Canada, China, South Korea
- Languages at home
- 87% English-only · Spanish 4% French/Haitian/Cajun 2% Chinese 2%
Political lean MEDSL · Baltimore
- 2024 margin
- Solid D (+73.0) · D 85.2% · R 12.2% · Other 2.6%
- 2008→2024 swing
- -2.5pp toward R · 2008: 75.5pp · 2024: 73.0pp
- All cycles
- 2024: D+73.0 2020: D+76.6 2016: D+74.6 2012: D+76.4 2008: D+75.5
Not yet ingested
- Civics
- —
Market trends
- HPI YoY
- ▼ -463.14%
- Current HPI
- 292.3986
- Rent YoY
- ▲ 1.63%
- Metro
- Baltimore-Columbia-Towson, MD
- State GDP YoY
- ▲ 2.97%
- F500 in state
- 12
Industry mix (Fortune 500 HQ in MD)
| Industry | F500 HQs | Revenue |
|---|---|---|
| Aerospace / Defense | 1 | $71B |
|
||
| Utilities | 1 | $25B |
|
||
| Hotels | 1 | $24B |
|
||
| Consumer Goods | 1 | $7B |
|
||
| Real Estate | 1 | $6B |
|
||
| Chemicals | 1 | $2B |
|
||
Price history
-91.2% since first listed3 events — show timeline
- 2025-10-23 Price Changed $35,000 BRIGHT MLS
- 2025-10-23 Listed $10,000 BRIGHT MLS
- 2023-02-06 Sold (Public Records) $396,250 Public Records
Property tax history
+2.0%/yrLatest (2025): $3,025 · +5.4% YoY. Source: county tax records.
Cash-flow waterfall
monthlySold comps — $/sqft
last 12 mo · ≤1 miLoading sold comps…