11 King Arthur Dr · Niantic, CT
Flood risk 1/10 · Minimal
- FEMA flood zone
- X (unshaded)
- Chance of flooding over 30 yrs
- 0.0%
- Est. flood insurance / yr
- $507 – $1,088
Fire risk 3/10 · Minor
- Est. fire insurance / yr
- $829 – $1,539
Heat risk 6/10 · Moderate
- Hot days now (above 95°F)
- 7 days/yr
- Hot days in 30 yrs
- 16 days/yr
Wind risk 8/10 · Major
- Chance of severe wind over 30 yrs
- 80.0%
Air-quality risk 3/10 · Minor
- Unhealthy air days now
- 3 days/yr
- Unhealthy air days in 30 yrs
- 4 days/yr
Risk factors via First Street. Map © Google.
Why this score? — see what drove the D+ grade
The composite is a weighted blend of 9 inputs, each scored 0–100. Each bar is that input's sub-score; the figure is the points it added to the 100-point composite (weight × sub-score).
- Cash flow +14.8/30.0
- ARV discount +7.5/15.0
- 1% rule +6.0/10.0
- Schools +5.5/10.0
- DSCR +4.5/10.0
- Livability +3.9/5.0
- Rent growth +2.5/5.0
- Condition / age +1.0/5.0
- Appreciation +0.0/10.0
$235,000
🖨 Deal sheet 📄 Offer letter ✓ Due diligence
Listing remarks MLS
End unit - bright & sunny - hardwood pergo flooring in entry w/ elevated dining area. Updated kitchen, painted cabinets w/ newer counter tops. Condo fee is 180 & 60 for oil. Association is in process of preparing to work on ** see additional remarks ** the mansard asphalt areasto replace the shingles. Updated vinyl floors in kt & baths.
Key facts
- Open patio area
- Parks
- Golf course
Tags
Neighborhood map
What this means for you Summary
Snapshot
- This is a 2-bed/2.0-bath condo listed at $235k. Condition is rated poor.
Deal economics
- At list price, monthly cash flow is $66 ($787/yr) — positive.
- The deal already cash-flows at list — no discount required.
- Meets the 1% rule at list price ($3k rent vs $235k).
- Recommended offer: $231k (1.5% below list) — sets the bar for market timing.
- Cap rate 6.6% vs local median 3.0% in Niantic — top-decile yield for the area; either an underpriced asset or a hidden risk that comps aren't pricing in. Stress-test before assuming the spread holds.
Location & tenants
- Location reads 78/100 on livability (#35 in CT, #2,462 nationally) — a middle-class / working-renter tenant base. Strengths: schools A+, crime A+, employment A+; Watch: cost of living D+, amenities F, commute F.
- East Lyme School District (rural): math 55% / reading 68% proficiency, ranked #42 of 153 in CT (top 28%) — acceptable for families but not a draw, mixed tenant base, ~2y average lease; only 10% free/reduced lunch — higher-income household profile.
- Market conditions: 61 active listings in the ZIP; 6 comparable units currently listed for rent nearby; rentals leasing fast (median 13d on market — plan ~1-2 weeks tenant-placement turnaround); solid renter incomes; 487 units permitted in Southeastern Connecticut Planning Region in 2024 (244 in 5+ unit buildings).
- This rent runs 33% of the median local income ($93k/yr) — at the standard rent-burdened threshold; future hikes will face affordability resistance.
Forward outlook
- Local home prices are declining (-3.0%/yr); year-one equity from $2k of loan paydown is wiped out by about $7k of value loss. Plan a longer hold.
Negotiation context
- It's been on market 15 days — a 2% lower offer ($231k) is reasonable based on typical stale-listing flexibility.
- 30 sale attempts since 29y ago; this cycle's ask is 77% above the opening price — seller raised mid-cycle; expect resistance to lowballs.
- Current owner paid $133k; list at $235k implies a 77% gain — meaningful room to come down on a strong offer.
Risks & watch-outs
- Climate carrying-cost: severe wind risk, 80% chance of damaging wind over 30y; extreme-heat days projected 7→16/yr by 2055 (HVAC capex compounding) — expect insurance premiums to compound above CPI over the hold.
Questions for the listing agent
- Have any recent inspections been done? Can we get a copy of the seller's disclosures and any deferred-maintenance estimates?
- Built in 1969 — when were the roof, HVAC, electrical panel, plumbing, and water heater last replaced?
- What does the HOA fee cover, when was the last increase, and are there any pending special assessments or reserve-fund shortfalls?
- Any open or pending special assessments — roof, HVAC, plumbing, elevator, façade? What's the per-unit balance and payoff schedule, and is the seller paying it off at close or rolling it to the buyer?
- Is there a deadline driving the sale (1031 exchange, divorce, estate, relocation)? That informs how much negotiation room exists.
- Schools are A-rated — typically a magnet for longer-tenancy family renters. What's the average tenant stay here, and is there a school-zone premium baked into asking?
- The area grade is low — what's the realistic commute time and amenity access for the typical tenant pool here? Any planned neighborhood developments (good or bad) we should know about?
- What's the average days-on-market for RENTAL listings here right now (not sales)? A rising rental-DOM trend means longer vacancies and softer asking-rent achievability than the comps imply.
- What's the recent tenant-quality profile in this submarket — average credit score on applications, eviction rate, late-payment / NSF rate, and stable-employment percentage? A property-management company in the area should have these aggregated.
- How much new apartment / multifamily construction is in the pipeline within 1–3 miles? Heavy new supply (>2% of stock underway) typically softens rents 12–24 months out; light construction supports rent growth.
Investment metrics
- 1% rule
- 1.10% ✓
- Cap rate
- 6.63%
- Cash-on-cash
- 1.20%
- DSCR
- 1.05
- GRM
- 7.6
CMA / ARV
No comps found within radius.
Projected returns pro-forma
-3.0% appreciation · 3.0% rent growth · sell at horizon
- IRR
- -14.3%
- Equity multiple
- 0.49×
- Total profit
- $-33,645
- Equity at exit
- $35,039
- IRR
- -5.3%
- Equity multiple
- 0.65×
- Total profit
- $-22,868
- Equity at exit
- $20,319
Cash invested: $65,800 (down + closing). Projections, not guarantees.
Landlord ↔ Tenant lean methodology
- Overall (STATE)
- 27 Tenant-Leaning
- State Connecticut
- 27 Tenant-Leaning · D+7
- County
- — inherits STATE
- City
- — inherits STATE
ZIP-level market 06357
- Home prices YoY
- -21.9%
- Active inventory
- 61
- Price-to-rent
- 7.6×
Monthly cashflow live
- Estimated rent
- $2,592 high interval (Pro) →
- Mortgage (P&I)
- −$1,232
- Tax est. 1.5%
- −$294 /mo · $3,525/yr
- Insurance
- −$98
- HOA est. from 7 same-building comps
- −$358
- Vacancy / Maint / Mgmt
- −$544
- Net cashflow
- $66
Break-even live
UW: 25.0% down · 7.5% · 30yr · 1.5% tax · 5.0% vac · 8.0% maint · 8.0% mgmt
Financing live
Cash to close
- Down payment
- $58,750
- Closing costs
- $7,050
- Reserves months
- —
- Total cash needed
- —
Loan-product check · same deal, 3 products live
Conventional
25% down · 7.5% · 30yr
- Down + closing
- —
- Monthly P&I
- —
- Monthly cashflow
- —
- DSCR
- —
- Eligible?
- —
Personal DTI + credit; lowest rate.
DSCR
20% down · 8.5% · 30yr
- Down + closing
- —
- Monthly P&I
- —
- Monthly cashflow
- —
- DSCR
- —
- Eligible?
- —
No personal income docs; deal must DSCR.
Hard money
10% down · 12.0% · 12mo
- Down + closing
- —
- Monthly P&I
- —
- Monthly cashflow
- —
- DSCR
- —
- Eligible?
- —
Short-term bridge; refi at stabilization.
Rent comps 6 comps
| Address | Beds | Baths | Sqft | Rent | $/sqft | DOM | Units | Dist |
|---|---|---|---|---|---|---|---|---|
| 1 Lighthouse Ln East Lyme, CT | 1.0–3.0 | 1.0–2.5 | 1550 | $3,145 | $2.03 | 13d | 7 | 0.80mi |
| 1 Maple Tree Ln East Lyme, CT | 3.0 | 1.0–2.0 | 960 | $2,682 | $2.79 | 13d | 11 | 0.93mi |
| 32 Upper Pattagansett Rd #25 East Lyme, CT | 2.0 | 2.5 | 1228 | $2,300 | $1.87 | 43d | 1 | 1.23mi |
| 231 Boston Post Rd #9 East Lyme, CT | 2.0 | 1.5 | 1018 | $2,300 | $2.26 | 43d | 1 | 1.27mi |
| 231 Boston Post Rd #9 East Lyme, CT | 2.0 | 1.5 | 1088 | $2,300 | $2.11 | 13d | 1 | 1.27mi |
| 14 Stoney Brook Dr Waterford, CT | 2.0 | 1.5 | 720 | $2,300 | $3.19 | 13d | 1 | 1.40mi |
HOA detail condo
- Monthly dues
- $0 · $0/yr
- Assessments
- None detected in remarks — confirm with the listing agent.
Listing history 50 events
-
2026-05-12$235,000 Active 376-char remark
-
2004-07-02soldstatus $132,900 350-char remark
Show marketing remark (350 chars)
End unit - bright & sunny - hardwood pergo flooring in entry w/ elevated dining area. Updated kitchen, painted cabinets w/ newer counter tops. Condo fee is 180 & 60 for oil. Association is in process of preparing to work on ** see additional remarks ** the mansard asphalt areasto replace the shingles. Updated vinyl floors in kt & baths.
-
2004-05-19$132,900 350-char remark
Show marketing remark (350 chars)
End unit - bright & sunny - hardwood pergo flooring in entry w/ elevated dining area. Updated kitchen, painted cabinets w/ newer counter tops. Condo fee is 180 & 60 for oil. Association is in process of preparing to work on ** see additional remarks ** the mansard asphalt areasto replace the shingles. Updated vinyl floors in kt & baths.
-
2002-09-11soldstatus $102,000
Show marketing remark (207 chars)
Lovely 2 bdrm, 1.5 Bath townhouse-style condominium w/ sunken living rm and lovely floorplan. Washer & dryer on upper level. Lovely views of grounds from rear deck. A fantastic find! Don t miss this one!
-
2002-08-30soldstatus $101,900
-
2002-06-21$99,900
Show marketing remark (207 chars)
Lovely 2 bdrm, 1.5 Bath townhouse-style condominium w/ sunken living rm and lovely floorplan. Washer & dryer on upper level. Lovely views of grounds from rear deck. A fantastic find! Don t miss this one!
-
2002-05-24soldstatus $99,900
-
2002-05-04$101,900
-
2002-04-11soldstatus $104,000
-
2002-04-08$99,900
-
2002-03-13$109,900
-
2002-01-14soldstatus $81,000
-
2001-12-12$89,900
-
2001-12-05soldstatus $85,500
-
2001-11-15soldstatus $88,900
-
2001-10-02$85,000
-
2001-09-15$88,900
-
2001-06-29soldstatus $82,500
-
2001-05-07soldstatus $67,000
-
2001-05-01$82,500
-
2001-04-03soldstatus $69,900
-
2001-03-20soldstatus $70,000
-
2001-02-26$72,900
-
2001-02-08$69,900
-
2001-01-31soldstatus $69,900
-
2000-11-25$69,900
-
2000-11-17soldstatus $68,000
-
2000-11-10soldstatus $68,000
-
2000-11-10$68,500
-
2000-10-14historical
-
2000-09-16historical
-
2000-07-14soldstatus $71,000
-
2000-06-23soldstatus $70,000
-
2000-06-03$71,900
-
2000-04-27soldstatus $68,500
-
2000-04-25$68,500
-
2000-04-03$72,900
-
2000-03-24$74,900
-
2000-03-16$72,900
-
2000-02-28soldstatus $59,000
-
2000-01-14$78,900
-
1999-12-31historical
-
1999-12-27$59,900
-
1999-10-05soldstatus $47,000
-
1999-09-17soldstatus $60,000
-
1999-09-14$60,000
-
1999-08-05$49,500
-
1999-05-07$68,900
-
1999-04-08$58,900
-
1999-03-12soldstatus $54,000
ⓘ Source: listings_history table (triggers on properties + properties_extension) + one-shot
backfill from property_details.listing_events for pre-trigger history.
Climate risk First Street
- Flood 1/10 Low FEMA zone X (unshaded) · 0% chance over 30 yrs
- Wildfire 3/10 Moderate
- Heat 6/10 Major 7 d/yr ≥95°F today · 16 d/yr by 30 yrs out
- Wind 8/10 Severe 80% chance of damaging wind over 30 yrs
- Air quality 3/10 Moderate 3 unhealthy d/yr today · 4 by 30 yrs out
Nearby sold comps map
Loading sold comps map…
Walkable amenities ~0.75 mi
Loading nearby amenities…
Taxation est. · year 1
- Rental income
- $31,103
- − Mortgage interest
- −$13,164
- − Property taxes
- −$3,525
- − Insurance
- −$1,175
- − Repairs & maintenance
- −$2,488
- − Management
- −$2,488
- − HOA
- −$4,296
- − Depreciation
- −$6,836
- Taxable loss
- −$2,870
- Est. tax savings @ 24.0%
- +$689
- After-tax cash flow
- $1,475/yr
For passive investors: Depreciation is non-cash, so a rental often shows a tax loss while cash-flowing — sheltering income. Rental losses are passive: they offset passive income freely, and up to $25,000/yr can offset ordinary (W-2) income if you actively participate and your MAGI is under $100k (phasing out to $0 by $150k); unused losses carry forward. On sale, claimed depreciation is recaptured at up to 25%, and gains may owe capital-gains tax (a 1031 exchange can defer both). Figures are a year-1 estimate at your 24.0% rate — not tax advice; consult a CPA.
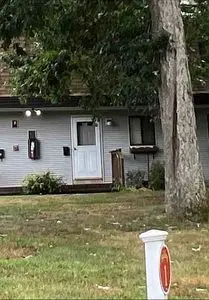
Condition & rehab AI · 1 photo
This property requires extensive repairs and updates to bring it up to a livable condition. Immediate focus should be on the roof and exterior siding to ensure safety and improve curb appeal.
Repairs flagged
- Major roof — Missing shingles
- Major exterior siding — Weathered and damaged
- Major flooring — Worn-out carpet
- Major interior walls — Peeling paint
- Major bathrooms — Visible damage to fixtures
- Major kitchen — Visible damage to cabinets and countertops
Value-add opportunities
- Both New roof — Critical to safety and appearance
- Both New siding — Improves curb appeal and durability
- Both New flooring — Enhances comfort and value
- Both Paint interior walls — Fresh paint improves aesthetics
- Both Replace bathroom fixtures — Modernizes and improves functionality
- Both Replace kitchen cabinets and countertops — Modernizes and improves functionality
Renovation cost estimate screening
| Repair item | Severity | Est. cost |
|---|---|---|
| roof · Missing shingles | Major | $15,000–50,000 |
| exterior siding · Weathered and damaged | Major | $15,000–50,000 |
| flooring · Worn-out carpet | Major | $15,000–50,000 |
| interior walls · Peeling paint | Major | $15,000–50,000 |
| bathrooms · Visible damage to fixtures | Major | $15,000–50,000 |
| kitchen · Visible damage to cabinets and countertops | Major | $15,000–50,000 |
| Total estimated repair cost · 6 items | $90,000–300,000 |
Value-add ROI direction
- Both New roof — Critical to safety and appearance ↑
- Both New siding — Improves curb appeal and durability ↑
- Both New flooring — Enhances comfort and value ↑
- Both Paint interior walls — Fresh paint improves aesthetics ↑
- Both Replace bathroom fixtures — Modernizes and improves functionality ↑
- Both Replace kitchen cabinets and countertops — Modernizes and improves functionality ↑
ⓘ Cost ranges are severity-bucket heuristics (US national rule-of-thumb). Get contractor quotes + a written scope before underwriting a rehab budget.
Schools (NCES district)
- District
- East Lyme School District
- NCES district ID
- 0901320
- Math proficiency
- 55% ▼ -10.00%
- Reading proficiency
- 68% ▼ -7.00%
- Median HH income
- $81,441
- Composite
- 55.28/100
- National rank
- #1264
- State rank
- #42 of 153 in CT
Livability — Niantic
- Score
- 78/100
- State rank
- #35
- US rank
- #2462
Category grades
Schools grade is shown separately in the Schools card above.
Census & demographics
- County
- New London County · 147,197 people
- City population
- 11,332
- Metro
- Norwich-New London, CT
- Population (ZIP)
- 11,332
- Household income
- $93,026
- Rent vs Own
- Severe rent burden
- 329.0
Population outlook (Southeastern Connecticut County) Hauer SSP2
- By 2040
- 293,442
Race, ethnicity, and origin ACS 2023
- Neighborhood character
- Predominantly White (83%)
- Race & ethnicity
- White 83% Asian 6% Two or more races 6% Hispanic / Latino 4% Black 3%
- Common ancestry
- Romanian 7% Lithuanian 6% Slovak 3%
- Foreign-born
- 10% · Canada, China
- Languages at home
- 86% English-only · Other Indo-European 5% Spanish 3% Other Asian/Pacific 2%
Political lean MEDSL · Southeastern Connecticut
- 2024 margin
- D (+13.0) · D 55.6% · R 42.6% · Other 1.8%
- All cycles
- 2024: D+13.0
Not yet ingested
- Civics
- —
Market trends
- HPI YoY
- ▼ -87.97%
- Current HPI
- 313.6313
- Rent YoY
- —
- Metro
- Norwich-New London, CT
- State GDP YoY
- ▲ 1.06%
- F500 in state
- 38
Industry mix (Fortune 500 HQ in CT)
| Industry | F500 HQs | Revenue |
|---|---|---|
| Industrial Machinery | 4 | $38B |
|
||
| Insurance | 3 | $71B |
|
||
| Financial Services | 2 | $25B |
|
||
| Transportation / Logistics | 2 | $18B |
|
||
| Healthcare | 1 | $247B |
|
||
| Telecommunications | 1 | $55B |
|
||
Price history
+121.9% since first listed60 events — show timeline
- 2004-07-02 Sold (MLS) $132,900 Smart MLS
- 2004-05-19 Listed $132,900 Smart MLS
- 2002-09-11 Sold (MLS) $102,000 Smart MLS
- 2002-08-30 Sold (MLS) $101,900 Smart MLS
- 2002-06-21 Listed $99,900 Smart MLS
- 2002-05-24 Sold (MLS) $99,900 Smart MLS
- 2002-05-04 Listed $101,900 Smart MLS
- 2002-04-11 Sold (MLS) $104,000 Smart MLS
- 2002-04-08 Listed $99,900 Smart MLS
- 2002-03-13 Listed $109,900 Smart MLS
- 2002-01-14 Sold (MLS) $81,000 Smart MLS
- 2001-12-12 Listed $89,900 Smart MLS
- 2001-12-05 Sold (MLS) $85,500 Smart MLS
- 2001-11-15 Sold (MLS) $88,900 Smart MLS
- 2001-10-02 Listed $85,000 Smart MLS
- 2001-09-15 Listed $88,900 Smart MLS
- 2001-06-29 Sold (MLS) $82,500 Smart MLS
- 2001-05-07 Sold (MLS) $67,000 Smart MLS
- 2001-05-01 Listed $82,500 Smart MLS
- 2001-04-03 Sold (MLS) $69,900 Smart MLS
- 2001-03-20 Sold (MLS) $70,000 Smart MLS
- 2001-02-26 Listed $72,900 Smart MLS
- 2001-02-08 Listed $69,900 Smart MLS
- 2001-01-31 Sold (MLS) $69,900 Smart MLS
- 2000-11-25 Listed $69,900 Smart MLS
- 2000-11-17 Sold (MLS) $68,000 Smart MLS
- 2000-11-10 Listed $68,500 Smart MLS
- 2000-11-10 Sold (MLS) $68,000 Smart MLS
- 2000-10-14 Listing Removed — Smart MLS
- 2000-09-16 Listing Removed — Smart MLS
- 2000-07-14 Sold (MLS) $71,000 Smart MLS
- 2000-06-23 Sold (MLS) $70,000 Smart MLS
- 2000-06-03 Listed $71,900 Smart MLS
- 2000-04-27 Sold (MLS) $68,500 Smart MLS
- 2000-04-25 Listed $68,500 Smart MLS
- 2000-04-03 Listed $72,900 Smart MLS
- 2000-03-24 Listed $74,900 Smart MLS
- 2000-03-16 Listed $72,900 Smart MLS
- 2000-02-28 Sold (MLS) $59,000 Smart MLS
- 2000-01-14 Listed $78,900 Smart MLS
- 1999-12-31 Listing Removed — Smart MLS
- 1999-12-27 Listed $59,900 Smart MLS
- 1999-10-05 Sold (MLS) $47,000 Smart MLS
- 1999-09-17 Sold (MLS) $60,000 Smart MLS
- 1999-09-14 Listed $60,000 Smart MLS
- 1999-08-05 Listed $49,500 Smart MLS
- 1999-05-07 Listed $68,900 Smart MLS
- 1999-04-08 Listed $58,900 Smart MLS
- 1999-03-12 Sold (MLS) $54,000 Smart MLS
- 1998-10-31 Sold (MLS) $48,000 Smart MLS
- 1998-10-01 Listed $62,500 Smart MLS
- 1998-09-24 Sold (MLS) $66,200 Smart MLS
- 1998-07-16 Sold (MLS) $54,000 Smart MLS
- 1998-06-03 Listing Removed — Smart MLS
- 1998-06-03 Listed $49,900 Smart MLS
- 1998-06-03 Listed $49,900 Smart MLS
- 1998-05-06 Sold (MLS) $55,000 Smart MLS
- 1998-04-30 Listed $54,000 Smart MLS
- 1998-03-27 Listed $69,900 Smart MLS
- 1997-05-10 Listed $59,900 Smart MLS
Cash-flow waterfall
monthlySold comps — $/sqft
last 12 mo · ≤1 miLoading sold comps…