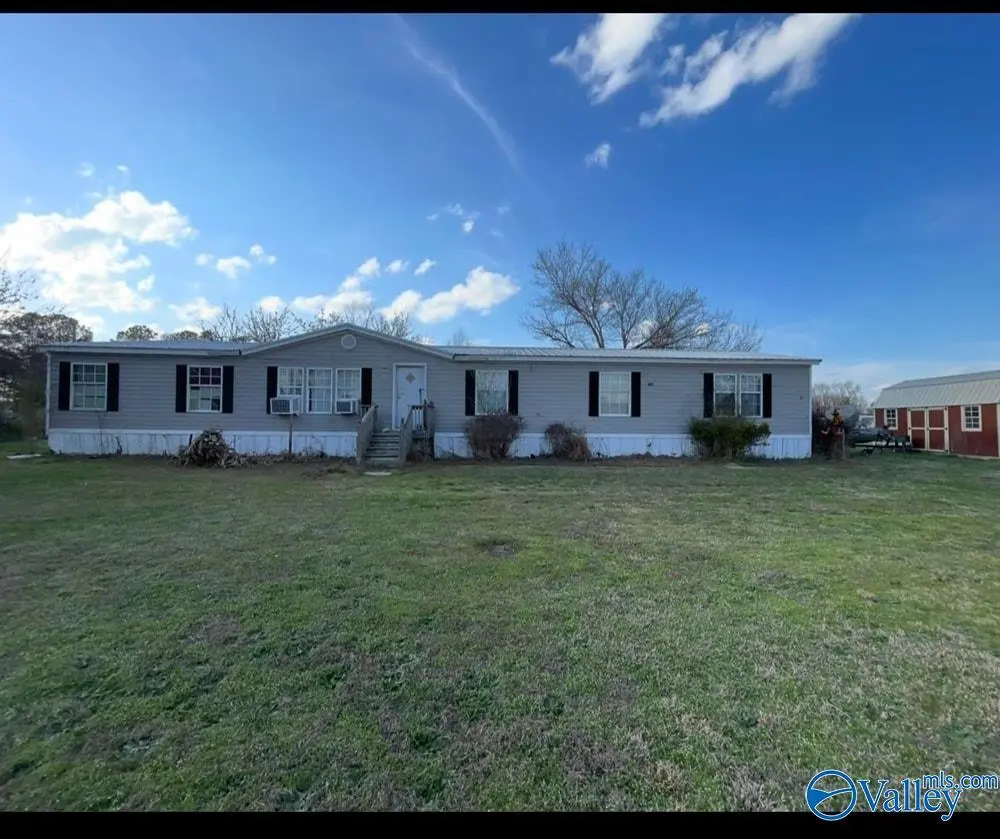
701 Cemetary Rd · Holly Pond, AL
Flood risk 1/10 · Minimal
- FEMA flood zone
- X (unshaded)
- Chance of flooding over 30 yrs
- 0.0%
- Est. flood insurance / yr
- $507 – $1,088
Fire risk 5/10 · Moderate
- Est. fire insurance / yr
- $916 – $1,700
Heat risk 5/10 · Moderate
- Hot days now (above 105°F)
- 7 days/yr
- Hot days in 30 yrs
- 19 days/yr
Wind risk 5/10 · Moderate
- Chance of severe wind over 30 yrs
- 26.0%
Air-quality risk 2/10 · Minimal
- Unhealthy air days now
- 0 days/yr
- Unhealthy air days in 30 yrs
- 3 days/yr
Risk factors via First Street. Map © Google.
Why this score? — see what drove the C- grade
The composite is a weighted blend of 9 inputs, each scored 0–100. Each bar is that input's sub-score; the figure is the points it added to the 100-point composite (weight × sub-score).
- ARV discount +13.6/15.0
- Appreciation +10.0/10.0
- Cash flow +9.9/30.0
- 1% rule +3.0/10.0
- Livability +3.0/5.0
- DSCR +2.8/10.0
- Schools +2.8/10.0
- Rent growth +2.5/5.0
- Condition / age +2.5/5.0
$195,000
🖨 Deal sheet 📄 Offer letter ✓ Due diligence
Listing remarks MLS
Spacious 4BR/2BA double wide on 2.65 acres offering peaceful country living! Approx. 1,920 ft² this home features a bright living room with vaulted ceilings and a separate den complete with fireplace and vaulted ceilings—perfect for relaxing or entertaining. Kitchen has an island, U-shaped bar and a dining room for large family events. Functional layout includes laundry and utility rooms. Recent 2025 updates include plumbing, tankless water heater, and new rain head shower faucets. Enjoy the back deck overlooking private acreage—perfect for a mini farm, gardening, or animals. Property includes a barn-style shed and additional storage building. Priced at $195,000—schedule your showing today!
Key facts
- 0.66 acre lot
- Built 2004
- Listed 86 days
Neighborhood map
What this means for you Summary
Snapshot
- This is a 4-bed/2.0-bath manufactured listed at $195k.
Deal economics
- At list price, monthly cash flow is $-120 ($-1k/yr) — negative.
- To cash-flow at today's rent, offer at most $178k (8.9% below list).
- To meet the 1% rule (rent ≥ 1% of price), the offer needs to be $155k (20.3% below list).
- Recommended offer: $155k (20.3% below list) — sets the bar for 1% rule.
- Cap rate 5.6% vs local median 3.9% in Holly Pond — top-decile yield for the area; either an underpriced asset or a hidden risk that comps aren't pricing in. Stress-test before assuming the spread holds.
Location & tenants
- Location reads 59/100 on livability (#326 in AL) — a working-class tenant base; expect higher turnover. Strengths: cost of living A+, housing A; Watch: schools C-, crime D+, amenities F.
- Cullman County (rural): math 19% / reading 49% proficiency, ranked #49 of 129 in AL (top 38%) — families likely to look elsewhere, expect single-tenant / working-renter base with shorter leases.
- Market conditions: 35 active listings in the ZIP; 180 units permitted in Cullman County in 2024 (0 in 5+ unit buildings).
Forward outlook
- In year one you build about $21k of equity ($1k loan paydown + $20k appreciation (10.0% local appreciation)).
- By year 2, paydown + projected appreciation supports a ~$34k cash-out refi (75% LTV) — recoverable capital for the next deal without selling this one.
Negotiation context
- It's been on market 87 days — a 6% lower offer ($183k) is reasonable based on typical stale-listing flexibility.
- 7 sale attempts since 2y ago with the ask held roughly flat each time — persistent listings suggest the price (not the market) is what's stuck; bring a comps-based counter.
- Current owner paid $101k; list at $195k implies a 93% gain — meaningful room to come down on a strong offer.
Risks & watch-outs
- Climate carrying-cost: moderate wind risk, 26% chance of damaging wind over 30y; moderate wildfire risk; extreme-heat days projected 7→19/yr by 2055 (HVAC capex compounding) — expect insurance premiums to compound above CPI over the hold.
Questions for the listing agent
- What do current leases actually rent for vs. the listed asking? Can we see a recent rent roll and the last 12 months of T-12 income?
- It's been on market 87 days. Have you received any prior offers? Is the seller open to a 20% concession, seller financing, or rate buy-down credit?
- Why hasn't it sold? Are there any deal-killer items the seller is aware of (foundation, flood, title, zoning, code violations)?
- Is there a deadline driving the sale (1031 exchange, divorce, estate, relocation)? That informs how much negotiation room exists.
- Crime grade is D in this area — have there been break-ins, vandalism, or insurance claims at this property in the last 3 years? What carrier currently insures it and at what premium?
- What's the average days-on-market for RENTAL listings here right now (not sales)? A rising rental-DOM trend means longer vacancies and softer asking-rent achievability than the comps imply.
- What's the recent tenant-quality profile in this submarket — average credit score on applications, eviction rate, late-payment / NSF rate, and stable-employment percentage? A property-management company in the area should have these aggregated.
- How much new for-sale + rental construction is in the pipeline within 1–3 miles? Heavy new supply typically softens prices + rents 12–24 months out; constrained supply supports both.
Investment metrics
- 1% rule
- 0.80% ✗
- Cap rate
- 5.56%
- Cash-on-cash
- -2.63%
- DSCR
- 0.88
- GRM
- 10.5
CMA / ARV
- ARV (median comp)
- $225,660
- List price
- $195,000
- Delta
- -13.59%
- Verdict
- UNDERPRICED
- Comps
- 20 within 1.0 mi
Projected returns pro-forma
10.0% appreciation · 3.0% rent growth · sell at horizon
- IRR
- 22.4%
- Equity multiple
- 2.81×
- Total profit
- $98,593
- Equity at exit
- $175,671
- IRR
- 20.1%
- Equity multiple
- 6.43×
- Total profit
- $296,389
- Equity at exit
- $378,842
Cash invested: $54,600 (down + closing). Projections, not guarantees.
Landlord ↔ Tenant lean methodology
- Overall (STATE)
- 90 Strongly Landlord-Friendly
- State Alabama
- 90 Strongly Landlord-Friendly · R+15
- County
- — inherits STATE
- City
- — inherits STATE
ZIP-level market 35083
- Home prices YoY
- 8.9%
- Active inventory
- 35
- Price-to-rent
- 10.5×
Monthly cashflow live
- Estimated rent
- $1,554 medium interval (Pro) →
- Mortgage (P&I)
- −$1,023
- Tax est. 1.5%
- −$244 /mo · $2,925/yr
- Insurance
- −$81
- HOA
- −$0
- Vacancy / Maint / Mgmt
- −$326
- Net cashflow
- $-120
Break-even live
UW: 25.0% down · 7.5% · 30yr · 1.5% tax · 5.0% vac · 8.0% maint · 8.0% mgmt
Financing live
Cash to close
- Down payment
- $48,750
- Closing costs
- $5,850
- Reserves months
- —
- Total cash needed
- —
Loan-product check · same deal, 3 products live
Conventional
25% down · 7.5% · 30yr
- Down + closing
- —
- Monthly P&I
- —
- Monthly cashflow
- —
- DSCR
- —
- Eligible?
- —
Personal DTI + credit; lowest rate.
DSCR
20% down · 8.5% · 30yr
- Down + closing
- —
- Monthly P&I
- —
- Monthly cashflow
- —
- DSCR
- —
- Eligible?
- —
No personal income docs; deal must DSCR.
Hard money
10% down · 12.0% · 12mo
- Down + closing
- —
- Monthly P&I
- —
- Monthly cashflow
- —
- DSCR
- —
- Eligible?
- —
Short-term bridge; refi at stabilization.
Listing history 31 events
-
2026-06-19days on market $195,000 Active 87 DOM
-
2026-06-18days on market $195,000 Active 86 DOM
-
2026-06-17days on market $195,000 Active 85 DOM
-
2026-06-16days on market $195,000 Active 84 DOM
-
2026-06-15days on market $195,000 Active 83 DOM
-
2026-06-14days on market $195,000 Active 81 DOM
-
2026-06-12days on market $195,000 Active 80 DOM
-
2026-06-09days on market $195,000 Active 77 DOM
-
2026-06-08days on market $195,000 Active 76 DOM
-
2026-06-07days on market $195,000 Active 75 DOM
-
2026-06-05days on market $195,000 Active 72 DOM
-
2026-06-03days on market $195,000 Active 71 DOM
-
2026-06-02days on market $195,000 Active 70 DOM
-
2026-06-01days on market $195,000 Active 69 DOM
-
2026-05-31days on market $195,000 Active 68 DOM
-
2026-05-30days on market $195,000 Active 67 DOM
-
2026-03-24$195,000 Active 722-char remark
Show marketing remark (722 chars)
Spacious 4BR/2BA double wide on 2.65 acres offering peaceful country living! Approx. 1,920 ft² this home features a bright living room with vaulted ceilings and a separate den complete with fireplace and vaulted ceilings—perfect for relaxing or entertaining. Kitchen has an island, U-shaped bar and a dining room for large family events. Functional layout includes laundry and utility rooms. Recent 2025 updates include plumbing, tankless water heater, and new rain head shower faucets. Enjoy the back deck overlooking private acreage—perfect for a mini farm, gardening, or animals. Property includes a barn-style shed and additional storage building. Priced at $195,000—schedule your showing today!
-
2025-07-01soldstatus $101,000
-
2025-04-03status Pending
-
2025-04-03status Pending
-
2025-03-26price $109,900
-
2025-03-18status Active
-
2025-03-18status Active
-
2025-02-12status Pending
-
2025-02-12status Pending
-
2025-02-04status Active
-
2025-01-22status Active
-
2024-12-30status Pending
-
2024-12-30status Pending
-
2024-12-10$119,900 Active
-
2024-12-10$119,900 Active
ⓘ Source: listings_history table (triggers on properties + properties_extension) + one-shot
backfill from property_details.listing_events for pre-trigger history.
Climate risk First Street
- Flood 1/10 Low FEMA zone X (unshaded) · 0% chance over 30 yrs
- Wildfire 5/10 Major
- Heat 5/10 Major 7 d/yr ≥105°F today · 19 d/yr by 30 yrs out
- Wind 5/10 Major 26% chance of damaging wind over 30 yrs
- Air quality 2/10 Low 0 unhealthy d/yr today · 3 by 30 yrs out
Nearby sold comps map
Loading sold comps map…
Walkable amenities ~0.75 mi
Loading nearby amenities…
Taxation est. · year 1
- Rental income
- $18,650
- − Mortgage interest
- −$10,923
- − Property taxes
- −$2,925
- − Insurance
- −$975
- − Repairs & maintenance
- −$1,492
- − Management
- −$1,492
- − Depreciation
- −$5,673
- Taxable loss
- −$4,830
- Est. tax savings @ 24.0%
- +$1,159
- After-tax cash flow
- $-279/yr
For passive investors: Depreciation is non-cash, so a rental often shows a tax loss while cash-flowing — sheltering income. Rental losses are passive: they offset passive income freely, and up to $25,000/yr can offset ordinary (W-2) income if you actively participate and your MAGI is under $100k (phasing out to $0 by $150k); unused losses carry forward. On sale, claimed depreciation is recaptured at up to 25%, and gains may owe capital-gains tax (a 1031 exchange can defer both). Figures are a year-1 estimate at your 24.0% rate — not tax advice; consult a CPA.
Schools (NCES district)
- District
- Cullman County
- NCES district ID
- 0101020
- Math proficiency
- 19% ▼ -35.00%
- Reading proficiency
- 49% ▲ 1.00%
- Median HH income
- $39,449
- Composite
- 28.39/100
- National rank
- #6767
- State rank
- #49 of 129 in AL
Livability — Holly Pond
- Score
- 59/100
- State rank
- #326
- US rank
- #19930
Category grades
Schools grade is shown separately in the Schools card above.
Census & demographics
- Census place
- Holly Pond, AL
- Population (ZIP)
- 4,276
Population outlook (Cullman County) Hauer SSP2
- Today (2025)
- 84,522 people
- By 2030
- 85,402 · +1.0%
- By 2040
- 86,152 · +1.9%
- By 2050
- 85,202 · +0.8%
- By 2075
- 79,679 · -5.7%
- By 2100
- 66,943 · -20.8%
Race, ethnicity, and origin ACS 2023
- Neighborhood character
- Predominantly White (93%)
- Race & ethnicity
- White 93% Hispanic / Latino 6% Two or more races 4%
- Hispanic origin (detail)
- Mexican 6%
- Common ancestry
- Slovak 2% Italian 2% Romanian 1%
- Foreign-born
- 2% · Canada
- Languages at home
- 96% English-only · Spanish 4%
Political lean MEDSL · Cullman
- 2024 margin
- Solid R (+80.5) · D 9.4% · R 89.9%
- 2008→2024 swing
- -15.3pp toward R · 2008: -65.2pp · 2024: -80.5pp
- All cycles
- 2024: R+80.5 2020: R+77.4 2016: R+77.8 2012: R+69.5 2008: R+65.2
Not yet ingested
- Civics
- —
Market trends
- HPI YoY
- ▲ 21.05%
- Current HPI
- 258.1263
- Rent YoY
- —
- Metro
- —
- State GDP YoY
- ▲ 2.94%
- F500 in state
- 4
Industry mix (Fortune 500 HQ in AL)
| Industry | F500 HQs | Revenue |
|---|---|---|
| Financial Services | 1 | $8B |
|
||
| Healthcare | 1 | $5B |
|
||
Price history
+62.6% since first listed15 events — show timeline
- 2026-03-24 Listed $195,000 VMLS
- 2025-07-01 Sold (Public Records) $101,000 Public Records
- 2025-04-03 Pending — SAARMLS
- 2025-04-03 Pending — Greater Alabama MLS
- 2025-03-26 Price Changed $109,900 SAARMLS
- 2025-03-18 Relisted — SAARMLS
- 2025-03-18 Relisted — Greater Alabama MLS
- 2025-02-12 Pending — SAARMLS
- 2025-02-12 Pending — Greater Alabama MLS
- 2025-02-04 Relisted — SAARMLS
- 2025-01-22 Relisted — Greater Alabama MLS
- 2024-12-30 Pending — SAARMLS
- 2024-12-30 Pending — Greater Alabama MLS
- 2024-12-10 Listed $119,900 Greater Alabama MLS
- 2024-12-10 Listed $119,900 SAARMLS
Cash-flow waterfall
monthlySold comps — $/sqft
last 12 mo · ≤1 miLoading sold comps…