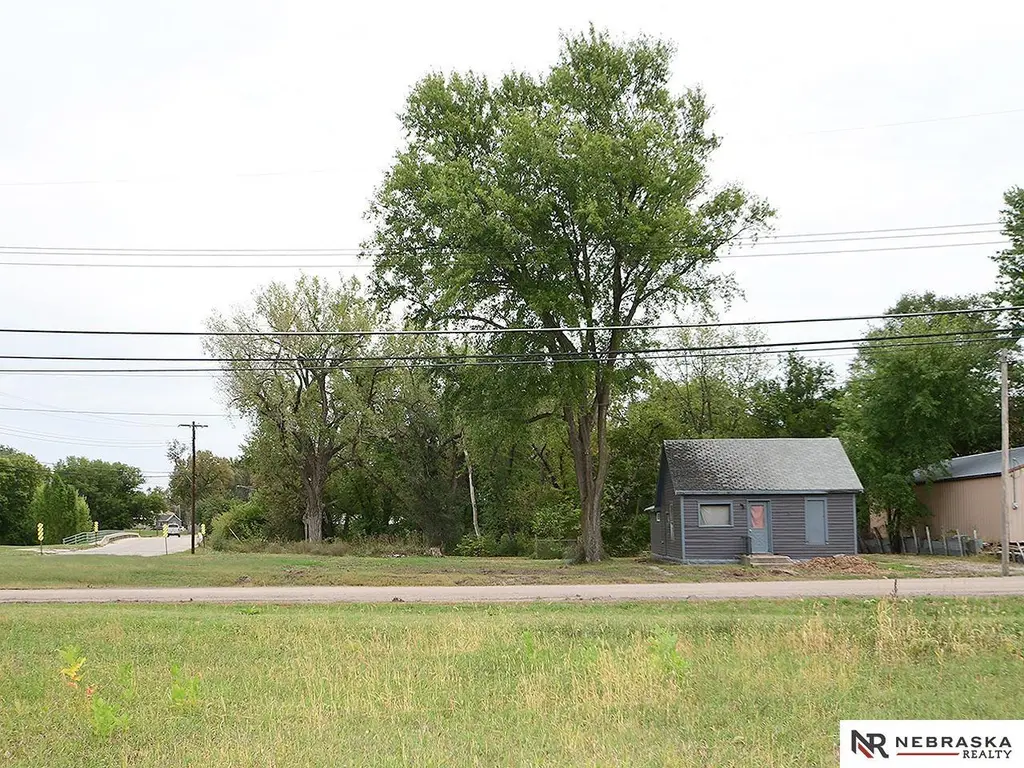
115 S York Ave · York, NE
Flood risk No data
- FEMA flood zone
- —
- Chance of flooding over 30 yrs
- —
- Est. flood insurance / yr
- —
Fire risk No data
- Est. fire insurance / yr
- —
Heat risk 3/10 · Minor
- Hot days now (above threshold)
- 7 days/yr
- Hot days in 30 yrs
- 15 days/yr
Wind risk No data
- Chance of severe wind over 30 yrs
- —
Air-quality risk 1/10 · Minimal
- Unhealthy air days now
- 0 days/yr
- Unhealthy air days in 30 yrs
- 0 days/yr
Risk factors via First Street. Map © Google.
Why this score? — see what drove the B+ grade
The composite is a weighted blend of 9 inputs, each scored 0–100. Each bar is that input's sub-score; the figure is the points it added to the 100-point composite (weight × sub-score).
- Cash flow +30.0/30.0
- ARV discount +15.0/15.0
- DSCR +10.0/10.0
- 1% rule +9.0/10.0
- Schools +4.5/10.0
- Livability +4.0/5.0
- Rent growth +2.5/5.0
- Condition / age +2.5/5.0
- Appreciation +0.0/10.0
$69,500
🖨 Deal sheet 📄 Offer letter ✓ Due diligence
Listing remarks
INVESTOR & BUILDER ALERT — RARE OPPORTUNITY! Don’t miss your chance to own one of the few in-town . 66 acre lots available! This property is all about location, space, and potential — featuring no backyard neighbors, a peaceful creek and walking trail directly behind, and a charming city gazebo right across the street. The existing structure is NOT livable and is being sold as land only, making this the perfect blank canvas for your next build or investment project. Build your dream home Develop in a highly desirable setting Enjoy privacy + nature with in-town convenience Opportunities like this don’t come around often — secure it before someone else do
Key facts
- Trail access
- Stream access
- Triple lot
Tags
Property features AI
Finance
- Other: Living area reported as 618 square feet; Lot included in price
Exterior
- Parking: No garage
- Utilities: Public water; Electricity available / electric on property
- Home design: Single family residence; Residential property; Not new / not a model; One-story (main floor living shown)
- Construction: Built in 1920; Masonite exterior; Composition roof; Block foundation
- Exterior features: City lot; Lot over 1/2 up to 1 acre; Lot dimensions approximately 150 x 220 x 150 x 148
Interior
- Bedrooms: Master bedroom on the main floor
- Bathrooms: 1 full bathroom (main level)
- Heating & cooling: No fuel heating
- Interior features: No fireplaces; No basement
Neighborhood map
What this means for you Summary
Snapshot
- This is a 1-bed/1.0-bath single-family listed at $70k.
Deal economics
- At list price, monthly cash flow is $349 ($4k/yr) — positive.
- The deal already cash-flows at list — no discount required.
- Meets the 1% rule at list price ($974 rent vs $70k).
- Recommended offer: $67k (3.0% below list) — sets the bar for market timing.
- Cap rate 12.3% vs local median 3.2% in York — top-decile yield for the area; either an underpriced asset or a hidden risk that comps aren't pricing in. Stress-test before assuming the spread holds.
Location & tenants
- Location reads 80/100 on livability (#24 in NE, #1,666 nationally) — a professional / high-income tenant draw. Strengths: cost of living A+, housing A+, health & safety A+; Watch: amenities F, commute F.
- York Public Schools (town): math 55% / reading 51% proficiency, ranked #55 of 111 in NE (top 50%) — acceptable for families but not a draw, mixed tenant base, ~2y average lease.
- Zoned schools: York Elementary School (math 58% / reading 50%, grade C, #194 of 502 statewide, top 39%, 594 students, 50% FRL); York Middle School (math 54% / reading 52%, grade C+, #41 of 128 statewide, top 32%, 315 students, 44% FRL); York High School (math 52% / reading 47%, grade D, #107 of 261 statewide, top 52%, 522 students, 39% FRL).
- Market conditions: 74 active listings in the ZIP; 29 units permitted in York County in 2024 (0 in 5+ unit buildings).
Forward outlook
- Local home prices are declining (-3.0%/yr); year-one equity from $481 of loan paydown is wiped out by about $2k of value loss. Plan a longer hold.
- York County population projected at +8% by 2050 — modest demand growth; plan on rents tracking national, not racing it.
- At projected returns (-3.0% appreciation + 3.0% rent growth), your $19k cash investment doubles in ~6 years — after that, you're playing with house money.
Negotiation context
- It's been on market 48 days — a 3% lower offer ($67k) is reasonable based on typical stale-listing flexibility.
- 4 sale attempts with the ask held roughly flat each time — persistent listings suggest the price (not the market) is what's stuck; bring a comps-based counter.
Risks & watch-outs
- Watch-outs: built in 1920 — expect roof / HVAC / electrical / plumbing capex.
Questions for the listing agent
- It's been on market 48 days. Have you received any prior offers? Is the seller open to a 3% concession, seller financing, or rate buy-down credit?
- Built in 1920 — when were the roof, HVAC, electrical panel, plumbing, and water heater last replaced?
- Is there a deadline driving the sale (1031 exchange, divorce, estate, relocation)? That informs how much negotiation room exists.
- Schools are A-rated — typically a magnet for longer-tenancy family renters. What's the average tenant stay here, and is there a school-zone premium baked into asking?
- What's the average days-on-market for RENTAL listings here right now (not sales)? A rising rental-DOM trend means longer vacancies and softer asking-rent achievability than the comps imply.
- What's the recent tenant-quality profile in this submarket — average credit score on applications, eviction rate, late-payment / NSF rate, and stable-employment percentage? A property-management company in the area should have these aggregated.
- How much new for-sale + rental construction is in the pipeline within 1–3 miles? Heavy new supply typically softens prices + rents 12–24 months out; constrained supply supports both.
Investment metrics
- 1% rule
- 1.40% ✓
- Cap rate
- 12.32%
- Cash-on-cash
- 21.52%
- DSCR
- 1.96
- GRM
- 5.9
CMA / ARV
- ARV (median comp)
- $98,222
- List price
- $69,500
- Delta
- -29.24%
- Verdict
- UNDERPRICED
- Comps
- 12 within 1.0 mi
Projected returns pro-forma
-3.0% appreciation · 3.0% rent growth · sell at horizon
- IRR
- 14.1%
- Equity multiple
- 1.56×
- Total profit
- $10,938
- Equity at exit
- $10,363
- IRR
- 22.8%
- Equity multiple
- 2.96×
- Total profit
- $38,050
- Equity at exit
- $6,009
Cash invested: $19,460 (down + closing). Projections, not guarantees.
Landlord ↔ Tenant lean methodology
- Overall (STATE)
- 83 Strongly Landlord-Friendly
- State Nebraska
- 83 Strongly Landlord-Friendly · R+13
- County
- — inherits STATE
- City
- — inherits STATE
ZIP-level market 68467
- Active inventory
- 74
- Price-to-rent
- 5.9×
Monthly cashflow live
- Estimated rent
- $974 medium interval (Pro) →
- Mortgage (P&I)
- −$364
- Tax from tax record
- −$27 /mo · $327/yr
- Insurance
- −$29
- HOA
- −$0
- Vacancy / Maint / Mgmt
- −$205
- Net cashflow
- $349
Break-even live
UW: 25.0% down · 7.5% · 30yr · 1.5% tax · 5.0% vac · 8.0% maint · 8.0% mgmt
Financing live
Cash to close
- Down payment
- $17,375
- Closing costs
- $2,085
- Reserves months
- —
- Total cash needed
- —
Loan-product check · same deal, 3 products live
Conventional
25% down · 7.5% · 30yr
- Down + closing
- —
- Monthly P&I
- —
- Monthly cashflow
- —
- DSCR
- —
- Eligible?
- —
Personal DTI + credit; lowest rate.
DSCR
20% down · 8.5% · 30yr
- Down + closing
- —
- Monthly P&I
- —
- Monthly cashflow
- —
- DSCR
- —
- Eligible?
- —
No personal income docs; deal must DSCR.
Hard money
10% down · 12.0% · 12mo
- Down + closing
- —
- Monthly P&I
- —
- Monthly cashflow
- —
- DSCR
- —
- Eligible?
- —
Short-term bridge; refi at stabilization.
Listing history 28 events
-
2026-06-18days on market $69,500 Active 48 DOM
-
2026-06-17days on market $69,500 Active 47 DOM
-
2026-06-16days on market $69,500 Active 46 DOM
-
2026-06-15days on market $69,500 Active 45 DOM
-
2026-06-13days on market $69,500 Active 43 DOM
-
2026-06-12days on market $69,500 Active 42 DOM
-
2026-06-09days on market $69,500 Active 39 DOM
-
2026-06-08days on market $69,500 Active 38 DOM
-
2026-06-07days on market $69,500 Active 37 DOM
-
2026-06-07days on market $69,500 Active 36 DOM
-
2026-06-04days on market $69,500 Active 33 DOM
-
2026-06-02days on market $69,500 Active 32 DOM
-
2026-06-01days on market $69,500 Active 31 DOM
-
2026-05-31days on market $69,500 Active 30 DOM
-
2026-05-19historical
-
2026-05-01$69,500 New 713-char remark
-
2026-04-03price $69,500
-
2025-11-26$79,000 New
-
2025-11-18historical
-
2025-10-06price $79,900
-
2025-09-29$86,000 New
-
2025-05-12soldstatus $76,000
-
2025-04-28soldstatus $49,000
-
2025-03-11historical
-
2025-01-27$70,000 New
-
2004-06-02soldstatus $17,000
-
2003-06-06soldstatus $15,500
-
1999-04-30soldstatus $16,000
ⓘ Source: listings_history table (triggers on properties + properties_extension) + one-shot
backfill from property_details.listing_events for pre-trigger history.
Tax reassessment forecast NE · Resets to sale price
- Current annual tax
- $327 · $27/mo
- Projected year-2 tax
- $1,202 · $100/mo
- Expected delta
- +$875/yr (+$73/mo · 267.6%)
ⓘ Screening estimate from a state-policy table — verify with the county assessor before closing.
Climate risk First Street
- Heat 3/10 Moderate
- Air quality 1/10 Low 0 unhealthy d/yr today · 0 by 30 yrs out
Nearby sold comps map
Loading sold comps map…
Walkable amenities ~0.75 mi
Loading nearby amenities…
Taxation est. · year 1
- Rental income
- $11,690
- − Mortgage interest
- −$3,893
- − Property taxes
- −$327
- − Insurance
- −$348
- − Repairs & maintenance
- −$935
- − Management
- −$935
- − Depreciation
- −$2,022
- Taxable income
- $3,230
- Est. tax owed @ 24.0%
- −$775
- After-tax cash flow
- $3,412/yr
For passive investors: Depreciation is non-cash, so a rental often shows a tax loss while cash-flowing — sheltering income. Rental losses are passive: they offset passive income freely, and up to $25,000/yr can offset ordinary (W-2) income if you actively participate and your MAGI is under $100k (phasing out to $0 by $150k); unused losses carry forward. On sale, claimed depreciation is recaptured at up to 25%, and gains may owe capital-gains tax (a 1031 exchange can defer both). Figures are a year-1 estimate at your 24.0% rate — not tax advice; consult a CPA.
Schools (NCES district)
- District
- York Public Schools
- NCES district ID
- 3179050
- Math proficiency
- 55% ▼ -9.00%
- Reading proficiency
- 51% ▼ -4.00%
- Median HH income
- $48,726
- Composite
- 45.18/100
- National rank
- #2675
- State rank
- #55 of 111 in NE
Livability — York
- Score
- 80/100
- State rank
- #24
- US rank
- #1666
Category grades
Schools grade is shown separately in the Schools card above.
Census & demographics
- Census place
- York, NE
- City population
- 9,688
- Population (ZIP)
- 9,688
Population outlook (York County) Hauer SSP2
- Today (2025)
- 13,976 people
- By 2030
- 14,103 · +0.9%
- By 2040
- 14,490 · +3.7%
- By 2050
- 15,059 · +7.7%
- By 2075
- 18,276 · +30.8%
- By 2100
- 21,449 · +53.5%
Race, ethnicity, and origin ACS 2023
- Neighborhood character
- Predominantly White (88%)
- Race & ethnicity
- White 88% Hispanic / Latino 7% Two or more races 6% Black 1%
- Hispanic origin (detail)
- Mexican 3% Puerto Rican 1%
- Common ancestry
- Iranian 2% Romanian 1% Italian 1%
- Foreign-born
- 3% · Canada
- Languages at home
- 94% English-only · Spanish 4% Other Asian/Pacific 1%
Political lean MEDSL · York
- 2024 margin
- Solid R (+51.3) · D 23.6% · R 74.9% · Other 1.5%
- 2008→2024 swing
- -2.0pp toward R · 2008: -49.3pp · 2024: -51.3pp
- All cycles
- 2024: R+51.3 2020: R+51.8 2016: R+56.0 2012: R+55.4 2008: R+49.3
Not yet ingested
- Civics
- —
Market trends
- HPI YoY
- ▼ -126.71%
- Current HPI
- 192.5562
- Rent YoY
- —
- Metro
- —
- State GDP YoY
- ▲ 0.68%
- F500 in state
- 2
Industry mix (Fortune 500 HQ in NE)
| Industry | F500 HQs | Revenue |
|---|---|---|
| Conglomerate | 1 | $371B |
|
||
Price history
+334.4% since first listed14 events — show timeline
- 2026-05-19 Listing Removed — GPRMLS
- 2026-05-01 Listed $69,500 GPRMLS
- 2026-04-03 Price Changed $69,500 GPRMLS
- 2025-11-26 Listed $79,000 GPRMLS
- 2025-11-18 Listing Removed — GPRMLS
- 2025-10-06 Price Changed $79,900 GPRMLS
- 2025-09-29 Listed $86,000 GPRMLS
- 2025-05-12 Sold (Public Records) $76,000 Public Records
- 2025-04-28 Sold (Public Records) $49,000 Public Records
- 2025-03-11 Listing Removed — GPRMLS
- 2025-01-27 Listed $70,000 GPRMLS
- 2004-06-02 Sold (Public Records) $17,000 Public Records
- 2003-06-06 Sold (Public Records) $15,500 Public Records
- 1999-04-30 Sold (Public Records) $16,000 Public Records
Property tax history
+4.6%/yrLatest (2025): $327 · +26.8% YoY. Source: county tax records.
Cash-flow waterfall
monthlySold comps — $/sqft
last 12 mo · ≤1 miLoading sold comps…