95 N Harmony Ln · Shawnee, OK
Flood risk 1/10 · Minimal
- FEMA flood zone
- X (unshaded)
- Chance of flooding over 30 yrs
- 0.0%
- Est. flood insurance / yr
- $507 – $1,088
Fire risk 8/10 · Major
- Est. fire insurance / yr
- $2,463 – $4,575
Heat risk 5/10 · Moderate
- Hot days now (above 109°F)
- 7 days/yr
- Hot days in 30 yrs
- 19 days/yr
Wind risk 3/10 · Minor
- Chance of severe wind over 30 yrs
- 4.0%
Air-quality risk 2/10 · Minimal
- Unhealthy air days now
- 1 days/yr
- Unhealthy air days in 30 yrs
- 1 days/yr
Risk factors via First Street. Map © Google.
Why this score? — see what drove the F grade
The composite is a weighted blend of 9 inputs, each scored 0–100. Each bar is that input's sub-score; the figure is the points it added to the 100-point composite (weight × sub-score).
- Cash flow +12.1/30.0
- Schools +5.0/10.0
- Condition / age +4.0/5.0
- DSCR +3.6/10.0
- 1% rule +3.5/10.0
- Livability +3.2/5.0
- Rent growth +3.1/5.0
- ARV discount +0.0/15.0
- Appreciation +0.0/10.0
$149,900
🖨 Deal sheet (PDF) 📄 Offer letter ✓ Due diligence
Listing remarks
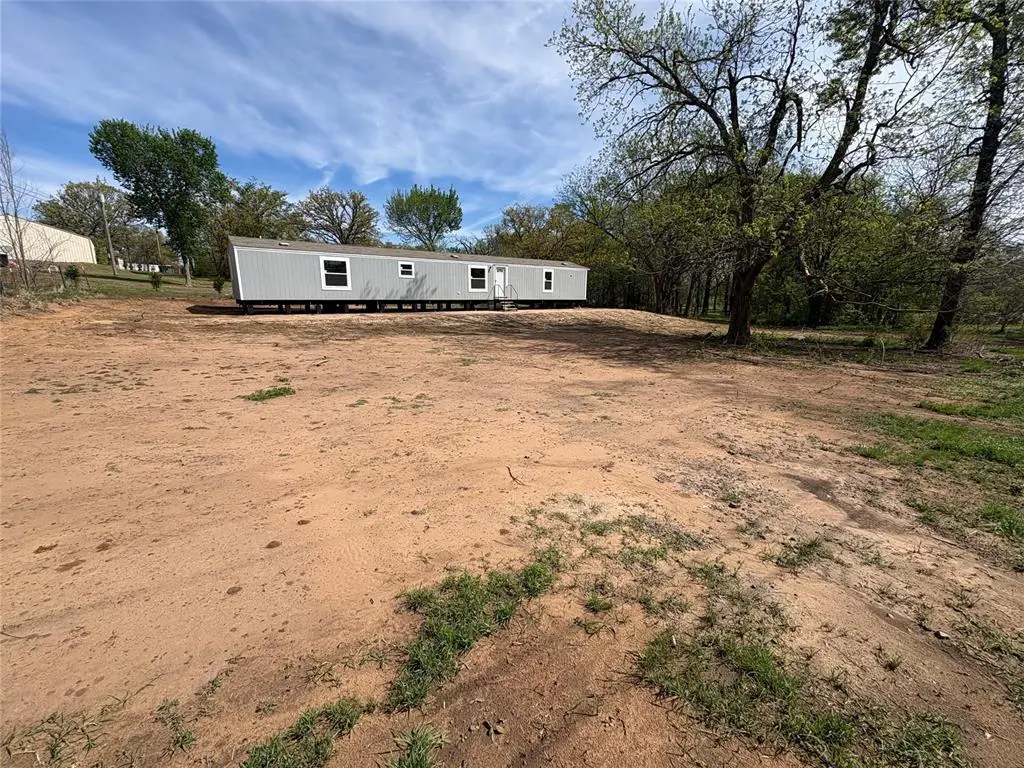
Completely Remodeled Mobile Home on Private 0.86-Acre Fenced Lot – Shawnee, OK Escape the hustle and enjoy peaceful country living in this beautifully updated home situated on a spacious, fully fenced 0.86-acre secluded property. Tucked away yet incredibly convenient — just a couple of minutes from I-40 and only 40 minutes to OKC! This home has been completely remodeled and is move-in ready. It features fresh interiors, modern finishes, and a clean, bright layout that feels open and welcoming. With North Rock Creek Schools, you’ll enjoy one of the area’s top-rated school districts. Key Features: Fully remodeled interior with new updates throughout Private, secluded,
Key facts
- Remodeled interior
- Private lot
- Secluded property
Tags
Property features AI
Finance
- Other: Vacant and not occupied; No home warranty; Listing status: Active
- Financial info: Listing terms: Cash, Conventional, Rural Housing Services
- HOA & community: No mandatory association dues
Exterior
- Parking: Gravel parking; RV parking; Other parking
- Utilities: Electricity available; Propane available; Septic tank; Private well available; High-speed internet available
- Home design: Single-family residence; One-story; Faces south; Residential property; Entry level: One
- Construction: Manufactured/mobile construction; Other construction materials; Composition roof; Combination foundation; Roof replaced or updated in 2025; Estimated completion date: 2026-04-30
- Exterior features: Wood fencing; Interior lot; Rural setting; Wooded lot
Interior
- Kitchen: Free-standing electric range/oven
- Bedrooms: 3 bedrooms
- Flooring: Laminate flooring; Vinyl flooring; Other flooring
- Bathrooms: 2 full bathrooms
- Heating & cooling: Electric heating
- Interior features: Open deck; Open patio; No fireplace
- Laundry & utility: Septic tank; Private well available; Propane available; High-speed internet available; Electric service available
Neighborhood map
What this means for you Summary
Snapshot
- This is a 3-bed/2.0-bath single-family listed at $150k. Condition is rated good.
Deal economics
- At list price, monthly cash flow is $-32 ($-381/yr) — negative.
- To cash-flow at today's rent, offer at most $145k (3.1% below list).
- To meet the 1% rule (rent ≥ 1% of price), the offer needs to be $127k (15.2% below list).
- Recommended offer: $127k (15.2% below list) — sets the bar for 1% rule.
- Cap rate 6.0% vs local median 3.9% in Shawnee — top-decile yield for the area; either an underpriced asset or a hidden risk that comps aren't pricing in. Stress-test before assuming the spread holds.
Location & tenants
- Location reads 63/100 on livability (#217 in OK) — a middle-class / working-renter tenant base. Strengths: cost of living A+, housing A+; Watch: crime F, amenities F, commute F.
- Zoned schools: North Rock Creek Es (math 12% / reading 12%, grade F, #667 of 845 statewide, top 82%, 467 students, 0% FRL); North Rock Creek Hs (math 27% / reading 22%, grade F, #150 of 447 statewide, top 48%, 454 students, 0% FRL).
- Market conditions: Rents rising (+2.5%/yr); 394 active listings in the ZIP; 183 units permitted in Pottawatomie County in 2024 (16 in 5+ unit buildings).
Forward outlook
- Local home prices are declining (-3.0%/yr); year-one equity from $1k of loan paydown is wiped out by about $4k of value loss. Plan a longer hold.
- Pottawatomie County population projected at +12% by 2050 — modest demand growth; plan on rents tracking national, not racing it.
Negotiation context
- It's been on market 74 days — a 6% lower offer ($141k) is reasonable based on typical stale-listing flexibility.
Risks & watch-outs
- Climate carrying-cost: severe wildfire risk; extreme-heat days projected 7→19/yr by 2055 (HVAC capex compounding) — expect insurance premiums to compound above CPI over the hold.
Questions for the listing agent
- What do current leases actually rent for vs. the listed asking? Can we see a recent rent roll and the last 12 months of T-12 income?
- It's been on market 74 days. Have you received any prior offers? Is the seller open to a 15% concession, seller financing, or rate buy-down credit?
- Why hasn't it sold? Are there any deal-killer items the seller is aware of (foundation, flood, title, zoning, code violations)?
- Is there a deadline driving the sale (1031 exchange, divorce, estate, relocation)? That informs how much negotiation room exists.
- Schools are F-rated, which usually means shorter tenancies and higher turnover. Who's the typical renter profile here, and what's been the actual vacancy rate?
- Crime grade is F in this area — have there been break-ins, vandalism, or insurance claims at this property in the last 3 years? What carrier currently insures it and at what premium?
- The area grade is low — what's the realistic commute time and amenity access for the typical tenant pool here? Any planned neighborhood developments (good or bad) we should know about?
- What's the average days-on-market for RENTAL listings here right now (not sales)? A rising rental-DOM trend means longer vacancies and softer asking-rent achievability than the comps imply.
- What's the recent tenant-quality profile in this submarket — average credit score on applications, eviction rate, late-payment / NSF rate, and stable-employment percentage? A property-management company in the area should have these aggregated.
- How much new for-sale + rental construction is in the pipeline within 1–3 miles? Heavy new supply typically softens prices + rents 12–24 months out; constrained supply supports both.
Investment metrics
- 1% rule
- 0.85% ✗
- Cap rate
- 6.04%
- Cash-on-cash
- -0.91%
- DSCR
- 0.96
- GRM
- 9.8
CMA / ARV
- ARV (on-the-fly)
- $122,816
- Comps found
- 1
Show comp detail 1 sale within ~0.75 mi
| Address | Dist | Beds/Ba | Sqft | Sold | Price | $/sf | Match |
|---|---|---|---|---|---|---|---|
| 407 Butler Dr | 0.61mi | 3/1.5 | 1,136 (-7%) | 4mo | $115,258 | $101 | 55 |
Match score weights: distance 35% · size 25% · config 20% · recency 20%. Top-matched comps best support the ARV.
Projected returns pro-forma
-3.0% appreciation · 2.49% rent growth · sell at horizon
- IRR
- -18.3%
- Equity multiple
- 0.36×
- Total profit
- $-26,940
- Equity at exit
- $22,351
- IRR
- -11.7%
- Equity multiple
- 0.32×
- Total profit
- $-28,618
- Equity at exit
- $12,961
Cash invested: $41,972 (down + closing). Projections, not guarantees.
Landlord ↔ Tenant lean methodology
- Overall (STATE)
- 83 Strongly Landlord-Friendly
- State Oklahoma
- 83 Strongly Landlord-Friendly · R+20
- County
- — inherits STATE
- City
- — inherits STATE
ZIP-level market 74804
- Home prices YoY
- -25.1%
- Rents YoY
- 2.5%
- Active inventory
- 394
- Price-to-rent
- 9.8×
Monthly cashflow live
- Estimated rent
- $1,271 medium interval (Pro) →
- Mortgage (P&I)
- −$786
- Tax est. 1.5%
- −$187 /mo · $2,248/yr
- Insurance
- −$62
- HOA
- −$0
- Vacancy / Maint / Mgmt
- −$267
- Net cashflow
- $-32
Break-even live
Sensitivity live
| Price | -10% $72 | -5% $20 | +0% $-32 | +5% $-84 | +10% $-135 |
|---|---|---|---|---|---|
| Rent | -10% $-132 | -5% $-82 | +0% $-32 | +5% $18 | +10% $69 |
| Rate | -1.0pp $44 | -0.5pp $6 | base $-32 | +0.5pp $-71 | +1.0pp $-110 |
UW: 25.0% down · 7.5% · 30yr · 1.5% tax · 5.0% vac · 8.0% maint · 8.0% mgmt
Financing live
Cash to close
- Down payment
- $37,475
- Closing costs
- $4,497
- Reserves months
- —
- Total cash needed
- —
Loan-product check · same deal, 3 products live
Conventional
25% down · 7.5% · 30yr
- Down + closing
- —
- Monthly P&I
- —
- Monthly cashflow
- —
- DSCR
- —
- Eligible?
- —
Personal DTI + credit; lowest rate.
DSCR
20% down · 8.5% · 30yr
- Down + closing
- —
- Monthly P&I
- —
- Monthly cashflow
- —
- DSCR
- —
- Eligible?
- —
No personal income docs; deal must DSCR.
Hard money
10% down · 12.0% · 12mo
- Down + closing
- —
- Monthly P&I
- —
- Monthly cashflow
- —
- DSCR
- —
- Eligible?
- —
Short-term bridge; refi at stabilization.
Listing history 19 events
-
2026-06-22days on market $149,900 Active 74 DOM
-
2026-06-21days on market $149,900 Active 73 DOM
-
2026-06-19days on market $149,900 Active 71 DOM
-
2026-06-18days on market $149,900 Active 70 DOM
-
2026-06-17days on market $149,900 Active 69 DOM
-
2026-06-16days on market $149,900 Active 68 DOM
-
2026-06-15days on market $149,900 Active 67 DOM
-
2026-06-14days on market $149,900 Active 65 DOM
-
2026-06-12days on market $149,900 Active 64 DOM
-
2026-06-09days on market $149,900 Active 61 DOM
-
2026-06-08days on market $149,900 Active 60 DOM
-
2026-06-07days on market $149,900 Active 59 DOM
-
2026-06-05days on market $149,900 Active 56 DOM
-
2026-06-03days on market $149,900 Active 55 DOM
-
2026-06-02days on market $149,900 Active 54 DOM
-
2026-06-01days on market $149,900 Active 53 DOM
-
2026-05-31days on market $149,900 Active 52 DOM
-
2026-05-30days on market $149,900 Active 51 DOM
-
2026-04-09$149,900 Active
ⓘ Source: listings_history table (triggers on properties + properties_extension) + one-shot
backfill from property_details.listing_events for pre-trigger history.
Climate risk First Street
- Flood 1/10 Low FEMA zone X (unshaded) · 0% chance over 30 yrs
- Wildfire 8/10 Severe
- Heat 5/10 Major 7 d/yr ≥109°F today · 19 d/yr by 30 yrs out
- Wind 3/10 Moderate 4% chance of damaging wind over 30 yrs
- Air quality 2/10 Low 1 unhealthy d/yr today · 1 by 30 yrs out
Nearby sold comps map
Loading sold comps map…
Walkable amenities ~0.75 mi
Loading nearby amenities…
Taxation est. · year 1
- Rental income
- $15,254
- − Mortgage interest
- −$8,397
- − Property taxes
- −$2,248
- − Insurance
- −$750
- − Repairs & maintenance
- −$1,220
- − Management
- −$1,220
- − Depreciation
- −$4,361
- Taxable loss
- −$2,942
- Est. tax savings @ 24.0%
- +$706
- After-tax cash flow
- $326/yr
For passive investors: Depreciation is non-cash, so a rental often shows a tax loss while cash-flowing — sheltering income. Rental losses are passive: they offset passive income freely, and up to $25,000/yr can offset ordinary (W-2) income if you actively participate and your MAGI is under $100k (phasing out to $0 by $150k); unused losses carry forward. On sale, claimed depreciation is recaptured at up to 25%, and gains may owe capital-gains tax (a 1031 exchange can defer both). Figures are a year-1 estimate at your 24.0% rate — not tax advice; consult a CPA.
Condition & rehab AI · 12 photos
This completely remodeled mobile home on a private, fenced 0.86-acre lot is move-in ready and offers a peaceful country living experience.
Value-add opportunities
- Both Landscaping and curb appeal improvements — Enhances curb appeal and could attract more buyers or renters.
- Both Add a small shed or storage unit — Provides additional storage and could increase the home's perceived value.
- Both Install a security system — Improves safety and could attract more buyers or renters.
- Both Add a small patio or outdoor seating area — Enhances outdoor living space and could increase the home's perceived value.
Renovation cost estimate screening
Value-add ROI direction
- Both Landscaping and curb appeal improvements — Enhances curb appeal and could attract more buyers or renters. ↑
- Both Add a small shed or storage unit — Provides additional storage and could increase the home's perceived value. ↑
- Both Install a security system — Improves safety and could attract more buyers or renters. ↑
- Both Add a small patio or outdoor seating area — Enhances outdoor living space and could increase the home's perceived value. ↑
ⓘ Cost ranges are severity-bucket heuristics (US national rule-of-thumb). Get contractor quotes + a written scope before underwriting a rehab budget.
Schools (NCES district)
No district data.
Livability — Shawnee
- Score
- 63/100
- State rank
- #217
- US rank
- #15593
Category grades
Schools grade is shown separately in the Schools card above.
Census & demographics
- County
- Pottawatomie County · 45,194 people
- City population
- 45,194
- Metro
- Shawnee, OK
- Population (ZIP)
- 23,227
- Household income
- $67,631
- Rent vs Own
- Severe rent burden
- 442.0
Population outlook (Pottawatomie County) Hauer SSP2
- Today (2025)
- 76,622 people
- By 2030
- 78,816 · +2.9%
- By 2040
- 82,766 · +8.0%
- By 2050
- 86,031 · +12.3%
- By 2075
- 93,316 · +21.8%
- By 2100
- 95,820 · +25.1%
Race, ethnicity, and origin ACS 2023
- Neighborhood character
- Predominantly White (70%)
- Race & ethnicity
- White 70% Two or more races 11% Native American 11% Hispanic / Latino 6% Black 4%
- Hispanic origin (detail)
- Mexican 4%
- Common ancestry
- Slovak 2% Lithuanian 2% Italian 1%
- Foreign-born
- 3% · Canada
- Languages at home
- 96% English-only · Spanish 3%
Political lean MEDSL · Pottawatomie
- 2024 margin
- Solid R (+47.4) · D 25.2% · R 72.7% · Other 2.1%
- 2008→2024 swing
- -9.1pp toward R · 2008: -38.4pp · 2024: -47.4pp
- All cycles
- 2024: R+47.4 2020: R+46.0 2016: R+46.5 2012: R+38.7 2008: R+38.4
Not yet ingested
- Civics
- —
Market trends
- HPI YoY
- ▼ -83.01%
- Current HPI
- 247.115
- Rent YoY
- ▲ 2.49%
- Metro
- Shawnee, OK
- State GDP YoY
- ▲ 1.55%
- F500 in state
- 6
Industry mix (Fortune 500 HQ in OK)
| Industry | F500 HQs | Revenue |
|---|---|---|
| Energy | 3 | $48B |
|
||
Price history
1 event — show timeline
- 2026-04-09 Listed $149,900 MLSOK
Cash-flow waterfall
monthlySold comps — $/sqft
last 12 mo · ≤1 miLoading sold comps…