2982 Pleasant Hill Rd · Snyder, TX
Flood risk 1/10 · Minimal
- FEMA flood zone
- X
- Chance of flooding over 30 yrs
- 0.0%
- Est. flood insurance / yr
- $507 – $1,088
Fire risk 8/10 · Major
- Est. fire insurance / yr
- $1,222 – $2,270
Heat risk 6/10 · Moderate
- Hot days now (above 103°F)
- 7 days/yr
- Hot days in 30 yrs
- 22 days/yr
Wind risk 4/10 · Minor
- Chance of severe wind over 30 yrs
- 10.0%
Air-quality risk 1/10 · Minimal
- Unhealthy air days now
- 0 days/yr
- Unhealthy air days in 30 yrs
- 0 days/yr
Risk factors via First Street. Map © Google.
Why this score? — see what drove the B- grade
The composite is a weighted blend of 9 inputs, each scored 0–100. Each bar is that input's sub-score; the figure is the points it added to the 100-point composite (weight × sub-score).
- Cash flow +30.0/30.0
- 1% rule +10.0/10.0
- DSCR +10.0/10.0
- ARV discount +7.5/15.0
- Livability +3.1/5.0
- Schools +2.8/10.0
- Rent growth +2.5/5.0
- Condition / age +2.5/5.0
- Appreciation +0.0/10.0
$74,000
🖨 Deal sheet 📄 Offer letter ✓ Due diligence
Listing remarks
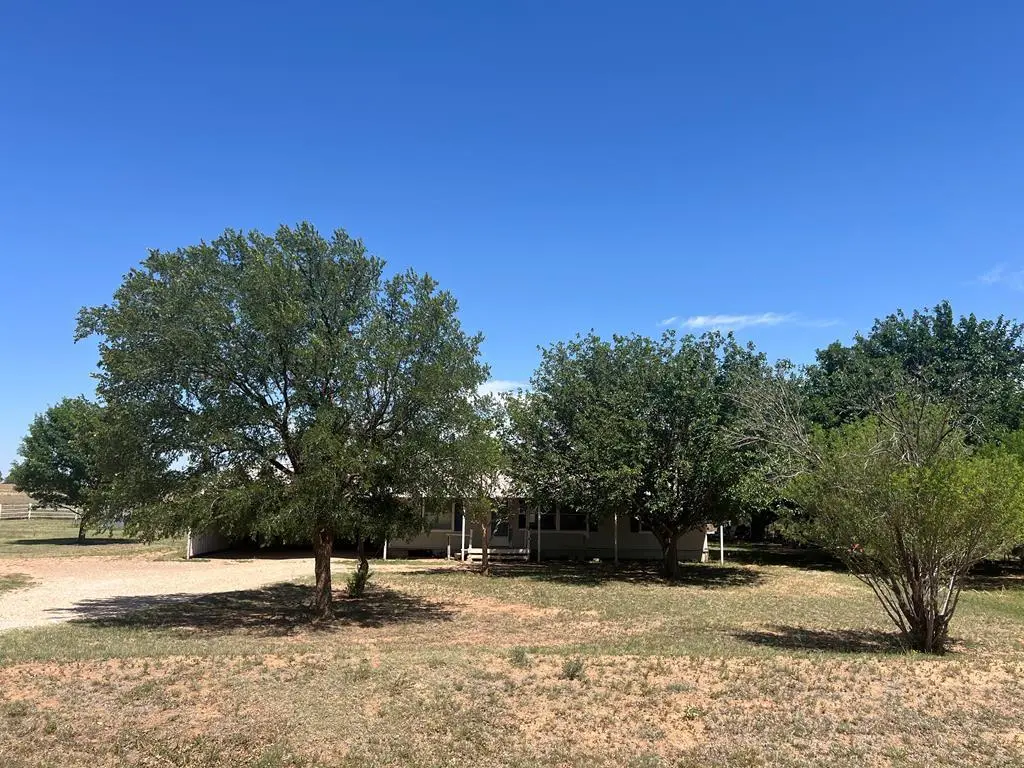
Discover peaceful country living just minutes from town. This 1-acre property located on Pleasant Hill Road sits outside city limits, offering flexibility, privacy, and lower taxes. With utilities already in place and a 1991 double-wide mobile home, this property is ideal for homeowners, investors, or anyone seeking land with immediate use potential.
Key facts
- Pleasant hill road
- 1 acre property
- 1 acre lot
Tags
Property features AI
Exterior
- Parking: Carport with 2 spaces
- Utilities: Private well water; Septic tank sewer
- Home design: Single-family mobile home; Single-story
- Construction: Wood siding; Built with wood siding
- Exterior features: Metal roof; 1 acre lot
Interior
- Kitchen: Range
- Bathrooms: 1 full bathroom; 1 half bathroom
- Heating & cooling: Ceiling fan(s); Window units; Cooling present
- Interior features: Skylight(s)
Neighborhood map
What this means for you Summary
Snapshot
- This is a 3-bed/1.5-bath manufactured listed at $74k.
Deal economics
- At list price, monthly cash flow is $676 ($8k/yr) — positive.
- The deal already cash-flows at list — no discount required.
- Meets the 1% rule at list price ($1k rent vs $74k).
- Recommended offer: $72k (3.0% below list) — sets the bar for market timing.
Location & tenants
- Location reads 61/100 on livability (#1,008 in TX) — a middle-class / working-renter tenant base. Strengths: cost of living A+, housing A+; Watch: health & safety C-, employment D+, crime F.
- Snyder ISD (town): math 33% / reading 31% proficiency, ranked #577 of 826 in TX (top 70%) — families likely to look elsewhere, expect single-tenant / working-renter base with shorter leases.
- Zoned schools: Snyder Int (math 42% / reading 28%, grade F, #1,965 of 4,322 statewide, top 46%, 362 students, 70% FRL); Snyder J H (math 24% / reading 27%, grade F, #1,236 of 1,662 statewide, top 76%, 594 students, 74% FRL); Snyder H S (math 27% / reading 40%, grade F, #1,011 of 1,632 statewide, top 63%, 709 students, 62% FRL) — zoned schools average 68% FRL vs 49% district-wide (19 pts higher); higher-poverty schools than district average — tighter screening recommended.
- Market conditions: 107 active listings in the ZIP; 32 units permitted in Scurry County in 2024 (0 in 5+ unit buildings).
Forward outlook
- Local home prices are declining (-3.0%/yr); year-one equity from $512 of loan paydown is wiped out by about $2k of value loss. Plan a longer hold.
- Scurry County population projected at +22% by 2050 — long-run rental-demand tailwind backs the buy-and-hold thesis.
- At projected returns (-3.0% appreciation + 3.0% rent growth), your $21k cash investment doubles in ~3 years — after that, you're playing with house money.
Negotiation context
- It's been on market 38 days — a 3% lower offer ($72k) is reasonable based on typical stale-listing flexibility.
Risks & watch-outs
- Climate carrying-cost: severe wildfire risk; extreme-heat days projected 7→22/yr by 2055 (HVAC capex compounding) — expect insurance premiums to compound above CPI over the hold.
Questions for the listing agent
- It's been on market 38 days. Have you received any prior offers? Is the seller open to a 3% concession, seller financing, or rate buy-down credit?
- Is there a deadline driving the sale (1031 exchange, divorce, estate, relocation)? That informs how much negotiation room exists.
- Schools are F-rated, which usually means shorter tenancies and higher turnover. Who's the typical renter profile here, and what's been the actual vacancy rate?
- Crime grade is F in this area — have there been break-ins, vandalism, or insurance claims at this property in the last 3 years? What carrier currently insures it and at what premium?
- What's the average days-on-market for RENTAL listings here right now (not sales)? A rising rental-DOM trend means longer vacancies and softer asking-rent achievability than the comps imply.
- What's the recent tenant-quality profile in this submarket — average credit score on applications, eviction rate, late-payment / NSF rate, and stable-employment percentage? A property-management company in the area should have these aggregated.
- How much new for-sale + rental construction is in the pipeline within 1–3 miles? Heavy new supply typically softens prices + rents 12–24 months out; constrained supply supports both.
Investment metrics
- 1% rule
- 2.01% ✓
- Cap rate
- 17.26%
- Cash-on-cash
- 39.17%
- DSCR
- 2.74
- GRM
- 4.1
CMA / ARV
No comps found within radius.
Projected returns pro-forma
-3.0% appreciation · 3.0% rent growth · sell at horizon
- IRR
- 35.4%
- Equity multiple
- 2.50×
- Total profit
- $31,102
- Equity at exit
- $11,034
- IRR
- 42.2%
- Equity multiple
- 4.99×
- Total profit
- $82,616
- Equity at exit
- $6,398
Cash invested: $20,720 (down + closing). Projections, not guarantees.
Landlord ↔ Tenant lean methodology
- Overall (STATE)
- 87 Strongly Landlord-Friendly
- State Texas
- 87 Strongly Landlord-Friendly · R+5
- County
- — inherits STATE
- City
- — inherits STATE
ZIP-level market 79549
- Active inventory
- 107
- Price-to-rent
- 4.1×
Monthly cashflow live
- Estimated rent
- $1,489 medium interval (Pro) →
- Mortgage (P&I)
- −$388
- Tax from tax record
- −$81 /mo · $974/yr
- Insurance
- −$31
- HOA
- −$0
- Vacancy / Maint / Mgmt
- −$313
- Net cashflow
- $676
Break-even live
UW: 25.0% down · 7.5% · 30yr · 1.5% tax · 5.0% vac · 8.0% maint · 8.0% mgmt
Financing live
Cash to close
- Down payment
- $18,500
- Closing costs
- $2,220
- Reserves months
- —
- Total cash needed
- —
Loan-product check · same deal, 3 products live
Conventional
25% down · 7.5% · 30yr
- Down + closing
- —
- Monthly P&I
- —
- Monthly cashflow
- —
- DSCR
- —
- Eligible?
- —
Personal DTI + credit; lowest rate.
DSCR
20% down · 8.5% · 30yr
- Down + closing
- —
- Monthly P&I
- —
- Monthly cashflow
- —
- DSCR
- —
- Eligible?
- —
No personal income docs; deal must DSCR.
Hard money
10% down · 12.0% · 12mo
- Down + closing
- —
- Monthly P&I
- —
- Monthly cashflow
- —
- DSCR
- —
- Eligible?
- —
Short-term bridge; refi at stabilization.
Listing history 17 events
-
2026-06-18days on market $74,000 Active 38 DOM
-
2026-06-17days on market $74,000 Active 37 DOM
-
2026-06-16days on market $74,000 Active 36 DOM
-
2026-06-15days on market $74,000 Active 35 DOM
-
2026-06-15days on market $74,000 Active 34 DOM
-
2026-06-13days on market $74,000 Active 33 DOM
-
2026-06-12days on market $74,000 Active 32 DOM
-
2026-06-09days on market $74,000 Active 29 DOM
-
2026-06-08days on market $74,000 Active 28 DOM
-
2026-06-08days on market $74,000 Active 27 DOM
-
2026-06-07days on market $74,000 Active 26 DOM
-
2026-06-03days on market $74,000 Active 23 DOM
-
2026-06-02days on market $74,000 Active 22 DOM
-
2026-06-01days on market $74,000 Active 21 DOM
-
2026-05-31pricedays on market $74,000 Active 20 DOM
-
2026-05-11$78,000 Active 352-char remark
-
1992-08-17soldstatus
ⓘ Source: listings_history table (triggers on properties + properties_extension) + one-shot
backfill from property_details.listing_events for pre-trigger history.
Tax reassessment forecast TX · Resets to sale price
- Current annual tax
- $974 · $81/mo
- Projected year-2 tax
- $1,354 · $113/mo
- Expected delta
- +$381/yr (+$32/mo · 39.1%)
ⓘ Screening estimate from a state-policy table — verify with the county assessor before closing.
Climate risk First Street
- Flood 1/10 Low FEMA zone X · 0% chance over 30 yrs
- Wildfire 8/10 Severe
- Heat 6/10 Major 7 d/yr ≥103°F today · 22 d/yr by 30 yrs out
- Wind 4/10 Moderate 10% chance of damaging wind over 30 yrs
- Air quality 1/10 Low 0 unhealthy d/yr today · 0 by 30 yrs out
Nearby sold comps map
Loading sold comps map…
Walkable amenities ~0.75 mi
Loading nearby amenities…
Taxation est. · year 1
- Rental income
- $17,869
- − Mortgage interest
- −$4,145
- − Property taxes
- −$974
- − Insurance
- −$370
- − Repairs & maintenance
- −$1,430
- − Management
- −$1,430
- − Depreciation
- −$2,153
- Taxable income
- $7,369
- Est. tax owed @ 24.0%
- −$1,768
- After-tax cash flow
- $6,348/yr
For passive investors: Depreciation is non-cash, so a rental often shows a tax loss while cash-flowing — sheltering income. Rental losses are passive: they offset passive income freely, and up to $25,000/yr can offset ordinary (W-2) income if you actively participate and your MAGI is under $100k (phasing out to $0 by $150k); unused losses carry forward. On sale, claimed depreciation is recaptured at up to 25%, and gains may owe capital-gains tax (a 1031 exchange can defer both). Figures are a year-1 estimate at your 24.0% rate — not tax advice; consult a CPA.
Schools (NCES district)
- District
- Snyder ISD
- NCES district ID
- 4840650
- Math proficiency
- 33% ▼ -4.00%
- Reading proficiency
- 31% ▼ -1.00%
- Median HH income
- $48,075
- Composite
- 27.69/100
- National rank
- #6912
- State rank
- #577 of 826 in TX
Livability — Snyder
- Score
- 61/100
- State rank
- #1008
- US rank
- #17920
Category grades
Schools grade is shown separately in the Schools card above.
Census & demographics
- Population (ZIP)
- 15,505
Population outlook (Scurry County) Hauer SSP2
- Today (2025)
- 18,819 people
- By 2030
- 19,548 · +3.9%
- By 2040
- 21,178 · +12.5%
- By 2050
- 22,980 · +22.1%
- By 2075
- 27,055 · +43.8%
- By 2100
- 28,065 · +49.1%
Race, ethnicity, and origin ACS 2023
- Neighborhood character
- Diverse neighborhood (Simpson 0.58)
- Race & ethnicity
- White 48% Hispanic / Latino 44% Two or more races 14% Black 3% Native American 1%
- Hispanic origin (detail)
- Mexican 40%
- Common ancestry
- Slovak 1% Italian 1%
- Foreign-born
- 5% · Canada
- Languages at home
- 75% English-only · Spanish 25%
Political lean MEDSL · Scurry
- 2024 margin
- Solid R (+73.6) · D 12.8% · R 86.5%
- 2008→2024 swing
- -13.9pp toward R · 2008: -59.7pp · 2024: -73.6pp
- All cycles
- 2024: R+73.6 2020: R+71.0 2016: R+69.8 2012: R+65.4 2008: R+59.7
Not yet ingested
- Civics
- —
Market trends
- HPI YoY
- ▼ -96.76%
- Current HPI
- 137.2297
- Rent YoY
- —
- Metro
- —
- State GDP YoY
- ▲ 3.95%
- F500 in state
- 110
Industry mix (Fortune 500 HQ in TX)
| Industry | F500 HQs | Revenue |
|---|---|---|
| Energy | 16 | $1,198B |
|
||
| Technology | 5 | $198B |
|
||
| Engineering / Construction | 4 | $72B |
|
||
| Energy Services | 3 | $60B |
|
||
| Utilities | 3 | $41B |
|
||
| Healthcare | 2 | $330B |
|
||
Price history
-5.1% since first listed3 events — show timeline
- 2026-05-31 Price Changed $74,000 PBBOR
- 2026-05-11 Listed $78,000 PBBOR
- 1992-08-17 Sold (Public Records) — Public Records
Property tax history
+5.3%/yrLatest (2025): $974 · +3.6% YoY. Source: county tax records.
Cash-flow waterfall
monthlySold comps — $/sqft
last 12 mo · ≤1 miLoading sold comps…