 🌊 Lakefront
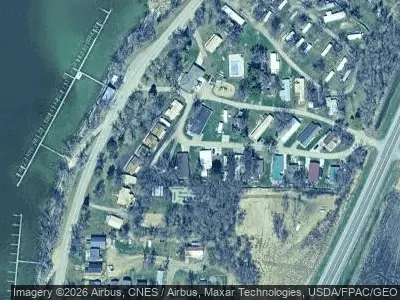
12887 Daydream Loop · Osakis, MN
Flood risk 1/10 · Minimal
- FEMA flood zone
- X (unshaded)
- Chance of flooding over 30 yrs
- 0.0%
- Est. flood insurance / yr
- $507 – $1,088
Fire risk 1/10 · Minimal
- Est. fire insurance / yr
- $888 – $1,650
Heat risk 1/10 · Minimal
- Hot days now (above 97°F)
- 7 days/yr
- Hot days in 30 yrs
- 13 days/yr
Wind risk 2/10 · Minimal
- Chance of severe wind over 30 yrs
- —
Air-quality risk 2/10 · Minimal
- Unhealthy air days now
- 2 days/yr
- Unhealthy air days in 30 yrs
- 2 days/yr
Risk factors via First Street. Map © Google.
Why this score? — see what drove the C+ grade
The composite is a weighted blend of 9 inputs, each scored 0–100. Each bar is that input's sub-score; the figure is the points it added to the 100-point composite (weight × sub-score).
- Cash flow +25.7/30.0
- DSCR +8.6/10.0
- ARV discount +7.5/15.0
- 1% rule +5.4/10.0
- Schools +4.7/10.0
- Livability +3.9/5.0
- Rent growth +2.5/5.0
- Condition / age +2.5/5.0
- Appreciation +0.0/10.0
$85,000
🖨 Deal sheet 📄 Offer letter ✓ Due diligence
Listing remarks
Rare year-round home available in Linwood Resort! This well-maintained 2 bedroom, 2 bathroom manufactured home has seen significant updates throughout and offers comfortable, low-maintenance living just steps from the lake. Located on the quiet lake side of the resort & acirc; & euro; & rdquo; approximately 50 yards from the shoreline & acirc; & euro; & rdquo; you can enjoy lake life amenities without the high taxes of traditional lakefront ownership. The home features central air and forced-air heat for efficient year-round comfort. A new steel roof was installed on the main home in 2024, along with upgraded blow-in insulation for improved efficiency and peace of mi
Key facts
- Significant updates
- Quiet lake side
- New steel roof
Tags
Neighborhood map
What this means for you Summary
Snapshot
- This is a 2-bed/2.0-bath single-family listed at $85k.
Deal economics
- At list price, monthly cash flow is $204 ($2k/yr) — positive.
- The deal already cash-flows at list — no discount required.
- Meets the 1% rule at list price ($885 rent vs $85k).
- Recommended offer: $84k (1.5% below list) — sets the bar for market timing.
- Cap rate 9.2% vs local median 2.3% in Osakis — top-decile yield for the area; either an underpriced asset or a hidden risk that comps aren't pricing in. Stress-test before assuming the spread holds.
Location & tenants
- Location reads 77/100 on livability (#130 in MN, #2,916 nationally) — a middle-class / working-renter tenant base. Strengths: crime A+, cost of living A+, housing A+; Watch: employment D, amenities F, commute F.
- Osakis Public School District (rural): math 58% / reading 52% proficiency, ranked #70 of 301 in MN (top 23%) — acceptable for families but not a draw, mixed tenant base, ~2y average lease.
- Market conditions: 68 active listings in the ZIP; 167 units permitted in Todd County in 2024 (78 in 5+ unit buildings).
Forward outlook
- Local home prices are declining (-3.0%/yr); year-one equity from $588 of loan paydown is wiped out by about $3k of value loss. Plan a longer hold.
- Todd County population projected at -28% by 2050 — secular population decline; favor cash flow + early exit over multi-decade hold.
Negotiation context
- It's been on market 18 days — a 2% lower offer ($84k) is reasonable based on typical stale-listing flexibility.
- 8 sale attempts since 17y ago with the ask held roughly flat each time — persistent listings suggest the price (not the market) is what's stuck; bring a comps-based counter.
Questions for the listing agent
- Is there a deadline driving the sale (1031 exchange, divorce, estate, relocation)? That informs how much negotiation room exists.
- Schools are A-rated — typically a magnet for longer-tenancy family renters. What's the average tenant stay here, and is there a school-zone premium baked into asking?
- This sits on a lake — are riparian / water-frontage rights deeded with the parcel? Any dock permits, shoreline easements, or HOA water-use restrictions?
- What's the documented flood / surge / shoreline-erosion history here (FEMA AND non-FEMA — e.g., storm surge, creek backup, septic-field saturation)?
- Any water-quality or seasonal algae-bloom issues that affect tenant satisfaction or short-term-rental demand?
- What's the average days-on-market for RENTAL listings here right now (not sales)? A rising rental-DOM trend means longer vacancies and softer asking-rent achievability than the comps imply.
- What's the recent tenant-quality profile in this submarket — average credit score on applications, eviction rate, late-payment / NSF rate, and stable-employment percentage? A property-management company in the area should have these aggregated.
- How much new for-sale + rental construction is in the pipeline within 1–3 miles? Heavy new supply typically softens prices + rents 12–24 months out; constrained supply supports both.
Investment metrics
- 1% rule
- 1.04% ✓
- Cap rate
- 9.17%
- Cash-on-cash
- 10.26%
- DSCR
- 1.46
- GRM
- 8.0
CMA / ARV
No comps found within radius.
Projected returns pro-forma
-3.0% appreciation · 3.0% rent growth · sell at horizon
- IRR
- -0.9%
- Equity multiple
- 0.96×
- Total profit
- $-852
- Equity at exit
- $12,674
- IRR
- 8.7%
- Equity multiple
- 1.66×
- Total profit
- $15,777
- Equity at exit
- $7,349
Cash invested: $23,800 (down + closing). Projections, not guarantees.
Landlord ↔ Tenant lean methodology
- Overall (STATE)
- 46 Balanced
- State Minnesota
- 46 Balanced · D+2
- County
- — inherits STATE
- City
- — inherits STATE
ZIP-level market 56360
- Home prices YoY
- -15.3%
- Active inventory
- 68
- Price-to-rent
- 8.0×
Monthly cashflow live
- Estimated rent
- $885 medium interval (Pro) →
- Mortgage (P&I)
- −$446
- Tax from tax record
- −$14 /mo · $172/yr
- Insurance
- −$35
- HOA
- −$0
- Vacancy / Maint / Mgmt
- −$186
- Net cashflow
- $204
Break-even live
UW: 25.0% down · 7.5% · 30yr · 1.5% tax · 5.0% vac · 8.0% maint · 8.0% mgmt
Financing live
Cash to close
- Down payment
- $21,250
- Closing costs
- $2,550
- Reserves months
- —
- Total cash needed
- —
Loan-product check · same deal, 3 products live
Conventional
25% down · 7.5% · 30yr
- Down + closing
- —
- Monthly P&I
- —
- Monthly cashflow
- —
- DSCR
- —
- Eligible?
- —
Personal DTI + credit; lowest rate.
DSCR
20% down · 8.5% · 30yr
- Down + closing
- —
- Monthly P&I
- —
- Monthly cashflow
- —
- DSCR
- —
- Eligible?
- —
No personal income docs; deal must DSCR.
Hard money
10% down · 12.0% · 12mo
- Down + closing
- —
- Monthly P&I
- —
- Monthly cashflow
- —
- DSCR
- —
- Eligible?
- —
Short-term bridge; refi at stabilization.
Listing history 21 events
-
2026-06-15days on market $85,000 Active 18 DOM
-
2026-06-14days on market $85,000 Active 16 DOM
-
2026-06-12days on market $85,000 Active 15 DOM
-
2026-06-09days on market $85,000 Active 12 DOM
-
2026-06-08days on market $85,000 Active 11 DOM
-
2026-06-07days on market $85,000 Active 10 DOM
-
2026-06-07days on market $85,000 Active 9 DOM
-
2026-06-02days on market $85,000 Active 5 DOM
-
2026-06-01days on market $85,000 Active 4 DOM
-
2026-05-31days on market $85,000 Active 3 DOM
-
2026-05-30days on market $85,000 Active 2 DOM
-
2026-05-29$85,000 Active
-
2015-06-16$27,500
-
2015-04-13price $30,000
-
2014-09-22$30,000
-
2010-10-26historical
-
2010-04-16$46,900
-
2009-10-26$46,900
-
2009-10-26$46,900
-
2009-10-26$46,900
-
2009-10-26$46,900
ⓘ Source: listings_history table (triggers on properties + properties_extension) + one-shot
backfill from property_details.listing_events for pre-trigger history.
Tax reassessment forecast MN · Partial reset (capped growth)
- Current annual tax
- $172 · $14/mo
- Projected year-2 tax
- $562 · $47/mo
- Expected delta
- +$390/yr (+$32/mo · 226.7%)
ⓘ Screening estimate from a state-policy table — verify with the county assessor before closing.
Climate risk First Street
- Flood 1/10 Low FEMA zone X (unshaded) · 0% chance over 30 yrs
- Wildfire 1/10 Low
- Heat 1/10 Low 7 d/yr ≥97°F today · 13 d/yr by 30 yrs out
- Wind 2/10 Low
- Air quality 2/10 Low 2 unhealthy d/yr today · 2 by 30 yrs out
Nearby sold comps map
Loading sold comps map…
Walkable amenities ~0.75 mi
Loading nearby amenities…
Taxation est. · year 1
- Rental income
- $10,619
- − Mortgage interest
- −$4,761
- − Property taxes
- −$172
- − Insurance
- −$425
- − Repairs & maintenance
- −$849
- − Management
- −$849
- − Depreciation
- −$2,473
- Taxable income
- $1,089
- Est. tax owed @ 24.0%
- −$261
- After-tax cash flow
- $2,181/yr
For passive investors: Depreciation is non-cash, so a rental often shows a tax loss while cash-flowing — sheltering income. Rental losses are passive: they offset passive income freely, and up to $25,000/yr can offset ordinary (W-2) income if you actively participate and your MAGI is under $100k (phasing out to $0 by $150k); unused losses carry forward. On sale, claimed depreciation is recaptured at up to 25%, and gains may owe capital-gains tax (a 1031 exchange can defer both). Figures are a year-1 estimate at your 24.0% rate — not tax advice; consult a CPA.
Schools (NCES district)
- District
- Osakis Public School District
- NCES district ID
- 2725140
- Math proficiency
- 58% ▼ -5.00%
- Reading proficiency
- 52% ▼ -10.00%
- Median HH income
- $48,292
- Composite
- 46.8/100
- National rank
- #2379
- State rank
- #70 of 301 in MN
Livability — Osakis
- Score
- 77/100
- State rank
- #130
- US rank
- #2916
Category grades
Schools grade is shown separately in the Schools card above.
Census & demographics
- Population (ZIP)
- 3,738
Population outlook (Todd County) Hauer SSP2
- Today (2025)
- 22,202 people
- By 2030
- 20,962 · -5.6%
- By 2040
- 18,352 · -17.3%
- By 2050
- 15,904 · -28.4%
- By 2075
- 11,348 · -48.9%
- By 2100
- 7,801 · -64.9%
Race, ethnicity, and origin ACS 2023
- Neighborhood character
- Predominantly White (97%)
- Race & ethnicity
- White 97% Two or more races 2%
- Common ancestry
- Portuguese 15% Romanian 4% Lithuanian 2%
- Foreign-born
- 0%
- Languages at home
- 98% English-only · German/W. Germanic 1% Spanish 1%
Political lean MEDSL · Todd
- 2024 margin
- Solid R (+53.5) · D 22.5% · R 76.0% · Other 1.5%
- 2008→2024 swing
- -42.4pp toward R · 2008: -11.1pp · 2024: -53.5pp
- All cycles
- 2024: R+53.5 2020: R+48.8 2016: R+47.7 2012: R+16.1 2008: R+11.1
Not yet ingested
- Civics
- —
Market trends
- HPI YoY
- ▼ -34.96%
- Current HPI
- 194.0284
- Rent YoY
- —
- Metro
- —
- State GDP YoY
- ▲ 2.41%
- F500 in state
- 34
Industry mix (Fortune 500 HQ in MN)
| Industry | F500 HQs | Revenue |
|---|---|---|
| Healthcare | 2 | $407B |
|
||
| Retail | 2 | $150B |
|
||
| Consumer Goods | 2 | $32B |
|
||
| Industrial Machinery | 2 | $6B |
|
||
| Agriculture | 1 | $40B |
|
||
| Healthcare / Medical Devices | 1 | $32B |
|
||
Price history
+81.2% since first listed10 events — show timeline
- 2026-05-29 Listed $85,000 FSBO.com
- 2015-06-16 Listed $27,500 NORTHSTARMLS as Distributed by MLS Grid
- 2015-04-13 Price Changed $30,000 NORTHSTARMLS as Distributed by MLS Grid
- 2014-09-22 Listed $30,000 NORTHSTARMLS as Distributed by MLS Grid
- 2010-10-26 Listing Removed — NORTHSTARMLS as Distributed by MLS Grid
- 2010-04-16 Listed $46,900 NORTHSTARMLS as Distributed by MLS Grid
- 2009-10-26 Listed $46,900 NORTHSTARMLS as Distributed by MLS Grid
- 2009-10-26 Listed $46,900 NORTHSTARMLS as Distributed by MLS Grid
- 2009-10-26 Listed $46,900 NORTHSTARMLS as Distributed by MLS Grid
- 2009-10-26 Listed $46,900 NORTHSTARMLS as Distributed by MLS Grid
Property tax history
-3.0%/yrLatest (2025): $172 · -3.4% YoY. Source: county tax records.
Cash-flow waterfall
monthlySold comps — $/sqft
last 12 mo · ≤1 miLoading sold comps…