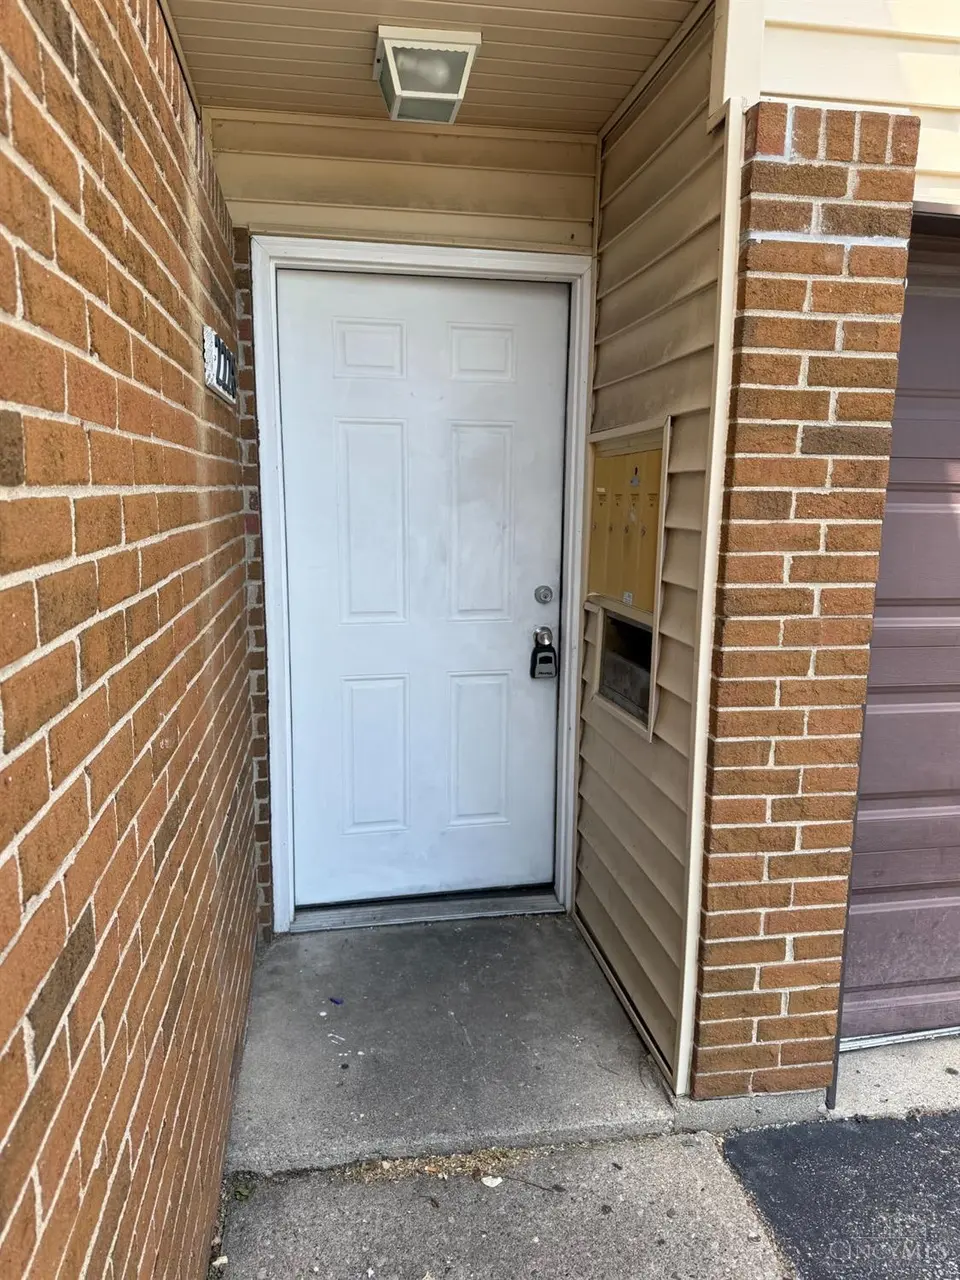
2228 Lincoln Ave Unit E · North College Hill, OH
Flood risk 1/10 · Minimal
- FEMA flood zone
- X (unshaded)
- Chance of flooding over 30 yrs
- 0.0%
- Est. flood insurance / yr
- $507 – $1,088
Fire risk 1/10 · Minimal
- Est. fire insurance / yr
- $713 – $1,323
Heat risk 4/10 · Minor
- Hot days now (above 103°F)
- 7 days/yr
- Hot days in 30 yrs
- 19 days/yr
Wind risk 2/10 · Minimal
- Chance of severe wind over 30 yrs
- 1.0%
Air-quality risk 2/10 · Minimal
- Unhealthy air days now
- 1 days/yr
- Unhealthy air days in 30 yrs
- 1 days/yr
Risk factors via First Street. Map © Google.
Why this score? — see what drove the C- grade
The composite is a weighted blend of 9 inputs, each scored 0–100. Each bar is that input's sub-score; the figure is the points it added to the 100-point composite (weight × sub-score).
- Cash flow +20.8/30.0
- ARV discount +7.5/15.0
- 1% rule +7.3/10.0
- DSCR +6.6/10.0
- Livability +3.7/5.0
- Rent growth +3.0/5.0
- Condition / age +2.5/5.0
- Schools +1.5/10.0
- Appreciation +0.0/10.0
$109,900
🖨 Deal sheet 📄 Offer letter ✓ Due diligence
Listing remarks
Welcome to 2228 Lincoln Ave. in desirable College Hill! This charming 2nd-floor condo offers 3 bedrooms and 1 bath with beautiful hardwood floors throughout. Enjoy a spacious living room and dining room, plus a private back deck overlooking a peaceful wooded yard. The kitchen includes a stove and refrigerator, and the home also features a utility room and 1-car garage. Conveniently located in the North College Hill Local School District, this condo is a must see!
Key facts
- Private back deck
- Utility room
- Wooded yard
Tags
Property features AI
Finance
- Other: Residential zoning; Condo classification; Less than 0.5 acre
- HOA & community: HOA present (Balanced Property So); Monthly association fee of $227
Exterior
- Parking: Detached 1-car garage
- Utilities: Public water; Public sewer; Natural gas available
- Home design: Townhouse-style condo; Traditional architecture; One-level unit with entry on level 1; Private entry; Unit faces unknown
- Construction: Brick and wood siding exterior; Shingle roof; Slab foundation; Built with traditional materials
- Exterior features: Balcony; Aluminum windows; Level lot; Partially wooded
Interior
- Kitchen: Vinyl flooring in kitchen; Wood cabinets; Electric cooktop; Refrigerator
- Bedrooms: Three bedrooms total; Primary bedroom about 12 x 11 (on level 1); Second bedroom about 11 x 11 (on level 1); Third bedroom about 10 x 8 (on level 1)
- Flooring: Wood floors in dining and living areas; Vinyl floor in kitchen
- Bathrooms: One full bathroom (on level 1)
- Heating & cooling: Electric forced-air heating; Central air conditioning; Gas water heating
- Interior features: Private entry; Thermostat
Neighborhood map
What this means for you Summary
Snapshot
- This is a 3-bed/1.5-bath townhouse listed at $110k.
Deal economics
- At list price, monthly cash flow is $152 ($2k/yr) — positive.
- The deal already cash-flows at list — no discount required.
- Meets the 1% rule at list price ($1k rent vs $110k).
- Recommended offer: $107k (3.0% below list) — sets the bar for market timing.
- Cap rate 7.9% vs local median 6.5% in North College Hill — meaningfully above typical; check what's discounted (condition, days-on-market, listing class) to confirm the premium yield is real.
Location & tenants
- Location reads 74/100 on livability (#288 in OH, #4,745 nationally) — a middle-class / working-renter tenant base. Strengths: commute A+, cost of living A+, housing A+; Watch: employment C-, schools D+, amenities D.
- North College Hill City (suburban): math 13% / reading 22% proficiency, ranked #637 of 656 in OH (top 97%) — low school quality limits family demand, transient renter base, plan for 1-2y turnover; 75% free/reduced lunch — lower-income household profile, screen leases tightly.
- Market conditions: Rents rising (+1.8%/yr); 52 active listings in the ZIP; 17 comparable units currently listed for rent nearby; rentals at typical pace (median 24d on market — plan ~3-4 weeks tenant-placement turnaround); 801 units permitted in Hamilton County in 2024 (190 in 5+ unit buildings).
Forward outlook
- Local home prices are declining (-3.0%/yr); year-one equity from $760 of loan paydown is wiped out by about $3k of value loss. Plan a longer hold.
Negotiation context
- It's been on market 36 days — a 3% lower offer ($107k) is reasonable based on typical stale-listing flexibility.
Questions for the listing agent
- It's been on market 36 days. Have you received any prior offers? Is the seller open to a 3% concession, seller financing, or rate buy-down credit?
- Built in 1974 — when were the roof, HVAC, electrical panel, plumbing, and water heater last replaced?
- What does the HOA fee cover, when was the last increase, and are there any pending special assessments or reserve-fund shortfalls?
- Is there a deadline driving the sale (1031 exchange, divorce, estate, relocation)? That informs how much negotiation room exists.
- Schools are D-rated, which usually means shorter tenancies and higher turnover. Who's the typical renter profile here, and what's been the actual vacancy rate?
- Crime grade is F in this area — have there been break-ins, vandalism, or insurance claims at this property in the last 3 years? What carrier currently insures it and at what premium?
- What's the average days-on-market for RENTAL listings here right now (not sales)? A rising rental-DOM trend means longer vacancies and softer asking-rent achievability than the comps imply.
- What's the recent tenant-quality profile in this submarket — average credit score on applications, eviction rate, late-payment / NSF rate, and stable-employment percentage? A property-management company in the area should have these aggregated.
- How much new for-sale + rental construction is in the pipeline within 1–3 miles? Heavy new supply typically softens prices + rents 12–24 months out; constrained supply supports both.
Investment metrics
- 1% rule
- 1.23% ✓
- Cap rate
- 7.95%
- Cash-on-cash
- 5.92%
- DSCR
- 1.26
- GRM
- 6.8
CMA / ARV
- ARV (on-the-fly)
- $110,000
- Comps found
- 5
Show comp detail 5 sales within ~0.75 mi
| Address | Dist | Beds/Ba | Sqft | Sold | Price | $/sf | Match |
|---|---|---|---|---|---|---|---|
| 2180 Lincoln Ave | 0.09mi | 3/1.5 | 880 (0%) | 11mo | $62,501 | $71 | 87 |
| 2236 Lincoln Ave | 0.02mi | 3/1.5 | 880 (0%) | 15mo | $109,900 | $125 | 86 |
| 2171 Lincoln Ave | 0.16mi | 2/1.5 (-1) | 860 (-2%) | 4mo | $95,000 | $110 | 81 |
| 2151 Lincoln Ave | 0.11mi | 3/1.5 | 880 (0%) | 22mo | $135,000 | $153 | 76 |
| 5649 Regimental Pl | 0.69mi | 2/1.5 (-1) | 1,003 (+14%) | 6mo | $209,900 | $209 | 35 |
Match score weights: distance 35% · size 25% · config 20% · recency 20%. Top-matched comps best support the ARV.
Projected returns pro-forma
-3.0% appreciation · 1.82% rent growth · sell at horizon
- IRR
- -8.6%
- Equity multiple
- 0.69×
- Total profit
- $-9,615
- Equity at exit
- $16,386
- IRR
- -0.9%
- Equity multiple
- 0.94×
- Total profit
- $-1,813
- Equity at exit
- $9,502
Cash invested: $30,772 (down + closing). Projections, not guarantees.
Landlord ↔ Tenant lean methodology
- Overall (STATE)
- 73 Landlord-Friendly
- State Ohio
- 73 Landlord-Friendly · R+6
- County
- — inherits STATE
- City
- — inherits STATE
ZIP-level market 45224
- Rents YoY
- 1.8%
- Active inventory
- 52
- Price-to-rent
- 6.8×
Monthly cashflow live
- Estimated rent
- $1,352 high interval (Pro) →
- Mortgage (P&I)
- −$576
- Tax from tax record
- −$67 /mo · $808/yr
- Insurance
- −$46
- HOA
- −$227
- Vacancy / Maint / Mgmt
- −$284
- Net cashflow
- $152
Break-even live
UW: 25.0% down · 7.5% · 30yr · 1.5% tax · 5.0% vac · 8.0% maint · 8.0% mgmt
Financing live
Cash to close
- Down payment
- $27,475
- Closing costs
- $3,297
- Reserves months
- —
- Total cash needed
- —
Loan-product check · same deal, 3 products live
Conventional
25% down · 7.5% · 30yr
- Down + closing
- —
- Monthly P&I
- —
- Monthly cashflow
- —
- DSCR
- —
- Eligible?
- —
Personal DTI + credit; lowest rate.
DSCR
20% down · 8.5% · 30yr
- Down + closing
- —
- Monthly P&I
- —
- Monthly cashflow
- —
- DSCR
- —
- Eligible?
- —
No personal income docs; deal must DSCR.
Hard money
10% down · 12.0% · 12mo
- Down + closing
- —
- Monthly P&I
- —
- Monthly cashflow
- —
- DSCR
- —
- Eligible?
- —
Short-term bridge; refi at stabilization.
Rent comps 17 comps
| Address | Beds | Baths | Sqft | Rent | $/sqft | DOM | Units | Dist |
|---|---|---|---|---|---|---|---|---|
| 5800 Renee Ct Cincinnati, OH | 2.0 | 1.0 | 775 | $1,099 | $1.42 | 21d | 1 | 0.28mi |
| 5856 Renee Ct Cincinnati, OH | 2.0 | 1.0 | 775 | $1,099 | $1.42 | 24d | 1 | 0.34mi |
| 1908 Emerson Ave Cincinnati, OH | 4.0 | 1.0 | 760 | $1,550 | $2.04 | 24d | 1 | 0.46mi |
| 2512 Rack Ct Unit 3 Cincinnati, OH | 2.0 | 1.0 | 900 | $1,125 | $1.25 | 24d | 1 | 0.62mi |
| 2536 Rack Ct Cincinnati, OH | 2.0 | 1.0 | 840 | $900 | $1.07 | 24d | 1 | 0.67mi |
| 5928 Belmont Ave Unit Washer Dryer Hookup Cincinnati, OH | 3.0 | 1.0 | 1120 | $1,395 | $1.25 | 16d | 1 | 0.74mi |
| 5910 Belmont Ave Unit 3 Cincinnati, OH | 2.0 | 1.0 | 900 | $995 | $1.11 | 4d | 1 | 0.79mi |
| 1720 W North Bend Rd Cincinnati, OH | 3.0 | 1.0 | 900 | $1,400 | $1.56 | 24d | 1 | 0.80mi |
| 5824 Shadymist Ln Unit 3 Cincinnati, OH | 2.0 | 1.0 | 875 | $1,100 | $1.26 | 24d | 1 | 0.83mi |
| 1837 W Galbraith Rd Cincinnati, OH | 2.0 | 2.0 | 1087 | $1,500 | $1.38 | 24d | 1 | 0.85mi |
| 5845 Shadymist Ln Apt 1 Cincinnati, OH | 2.0 | 1.0 | 850 | $990 | $1.16 | 20d | 1 | 0.86mi |
| 6211 Hamilton Ave Cincinnati, OH | 2.0 | 1.0–2.0 | 842 | $1,968 | $2.34 | 2d | 17 | 0.97mi |
| 5465 Kirby Ave Unit 5465-21 Cincinnati, OH | 2.0 | 1.0 | 820 | $1,095 | $1.34 | 24d | 1 | 1.13mi |
| 5465 Kirby Ave Unit 5465-8 Cincinnati, OH | 2.0 | 1.0 | 820 | $1,095 | $1.34 | 10d | 1 | 1.13mi |
| 5469 Kirby Ave Cincinnati, OH | 1.0–2.0 | 1.0 | 720 | $1,095 | $1.52 | 3d | 33 | 1.17mi |
| 1628 Linden Dr Unit 937 Cincinnati, OH | 2.0 | 1.0 | 950 | $1,163 | $1.22 | 24d | 1 | 1.27mi |
| 5293 E Knoll Ct Cincinnati, OH | 1.0–3.0 | 1.0–1.5 | 835 | $1,599 | $1.91 | 2d | 14 | 1.47mi |
HOA detail
- Monthly dues
- $227 · $2,724/yr
Listing history 16 events
-
2026-06-18days on market $109,900 Active 36 DOM
-
2026-06-17days on market $109,900 Active 35 DOM
-
2026-06-16days on market $109,900 Active 34 DOM
-
2026-06-15days on market $109,900 Active 33 DOM
-
2026-06-13days on market $109,900 Active 31 DOM
-
2026-06-09days on market $109,900 Active 27 DOM
-
2026-06-08days on market $109,900 Active 26 DOM
-
2026-06-07days on market $109,900 Active 25 DOM
-
2026-06-03days on market $109,900 Active 21 DOM
-
2026-06-02days on market $109,900 Active 20 DOM
-
2026-06-01days on market $109,900 Active 19 DOM
-
2026-05-31days on market $109,900 Active 18 DOM
-
2026-05-13$109,900 Active
-
2024-12-06soldstatus $10,723,000
-
2018-07-27soldstatus $623,500
-
2006-05-22soldstatus $28,500
ⓘ Source: listings_history table (triggers on properties + properties_extension) + one-shot
backfill from property_details.listing_events for pre-trigger history.
Tax reassessment forecast OH · Partial reset (capped growth)
- Current annual tax
- $808 · $67/mo
- Projected year-2 tax
- $1,261 · $105/mo
- Expected delta
- +$453/yr (+$38/mo · 56.1%)
ⓘ Screening estimate from a state-policy table — verify with the county assessor before closing.
Climate risk First Street
- Flood 1/10 Low FEMA zone X (unshaded) · 0% chance over 30 yrs
- Wildfire 1/10 Low
- Heat 4/10 Moderate 7 d/yr ≥103°F today · 19 d/yr by 30 yrs out
- Wind 2/10 Low 100% chance of damaging wind over 30 yrs
- Air quality 2/10 Low 1 unhealthy d/yr today · 1 by 30 yrs out
Nearby sold comps map
Loading sold comps map…
Walkable amenities ~0.75 mi
Loading nearby amenities…
Taxation est. · year 1
- Rental income
- $16,225
- − Mortgage interest
- −$6,156
- − Property taxes
- −$808
- − Insurance
- −$550
- − Repairs & maintenance
- −$1,298
- − Management
- −$1,298
- − HOA
- −$2,724
- − Depreciation
- −$3,197
- Taxable income
- $195
- Est. tax owed @ 24.0%
- −$47
- After-tax cash flow
- $1,774/yr
For passive investors: Depreciation is non-cash, so a rental often shows a tax loss while cash-flowing — sheltering income. Rental losses are passive: they offset passive income freely, and up to $25,000/yr can offset ordinary (W-2) income if you actively participate and your MAGI is under $100k (phasing out to $0 by $150k); unused losses carry forward. On sale, claimed depreciation is recaptured at up to 25%, and gains may owe capital-gains tax (a 1031 exchange can defer both). Figures are a year-1 estimate at your 24.0% rate — not tax advice; consult a CPA.
Schools (NCES district)
- District
- North College Hill City
- NCES district ID
- 3904451
- Math proficiency
- 13% ▼ -14.00%
- Reading proficiency
- 22% ▼ -11.00%
- Median HH income
- $40,355
- Composite
- 14.89/100
- National rank
- #9375
- State rank
- #637 of 656 in OH
Livability — North College Hill
- Score
- 74/100
- State rank
- #288
- US rank
- #4745
Category grades
Schools grade is shown separately in the Schools card above.
Census & demographics
- County
- Hamilton County · 701,295 people
- Metro
- Cincinnati, OH-KY-IN
- Population (ZIP)
- 21,900
- Household income
- $56,471
- Rent vs Own
- Severe rent burden
- 1382.0
Population outlook (Hamilton County) Hauer SSP2
- Today (2025)
- 826,054 people
- By 2030
- 830,947 · +0.6%
- By 2040
- 832,319 · +0.8%
- By 2050
- 822,428 · -0.4%
- By 2075
- 788,688 · -4.5%
- By 2100
- 710,674 · -14.0%
Race, ethnicity, and origin ACS 2023
- Neighborhood character
- Diverse neighborhood (Simpson 0.60)
- Race & ethnicity
- Black 51% White 37% Two or more races 6% Hispanic / Latino 5%
- Common ancestry
- Lithuanian 2% Italian 2% Slovak 1%
- Foreign-born
- 5% · Canada
- Languages at home
- 95% English-only · Spanish 3%
Political lean MEDSL · Hamilton
- 2024 margin
- D (+14.9) · D 57.0% · R 42.1%
- 2008→2024 swing
- +7.9pp toward D · 2008: 7.0pp · 2024: 14.9pp
- All cycles
- 2024: D+14.9 2020: D+15.9 2016: D+9.5 2012: D+4.9 2008: D+7.0
Not yet ingested
- Civics
- —
Market trends
- HPI YoY
- ▼ -148.06%
- Current HPI
- 224.1379
- Rent YoY
- ▲ 1.82%
- Metro
- Cincinnati, OH-KY-IN
- State GDP YoY
- ▲ 1.98%
- F500 in state
- 48
Industry mix (Fortune 500 HQ in OH)
| Industry | F500 HQs | Revenue |
|---|---|---|
| Insurance | 3 | $145B |
|
||
| Industrial Machinery | 3 | $49B |
|
||
| Financial Services | 3 | $24B |
|
||
| Consumer Goods | 2 | $93B |
|
||
| Aerospace / Defense | 2 | $47B |
|
||
| Utilities | 2 | $33B |
|
||
Price history
+285.6% since first listed4 events — show timeline
- 2026-05-13 Listed $109,900 Cincy MLS
- 2024-12-06 Sold (Public Records) $10,723,000 Public Records
- 2018-07-27 Sold (Public Records) $623,500 Public Records
- 2006-05-22 Sold (Public Records) $28,500 Public Records
Property tax history
+2.1%/yrLatest (2025): $808 · +0.0% YoY. Source: county tax records.
Cash-flow waterfall
monthlySold comps — $/sqft
last 12 mo · ≤1 miLoading sold comps…