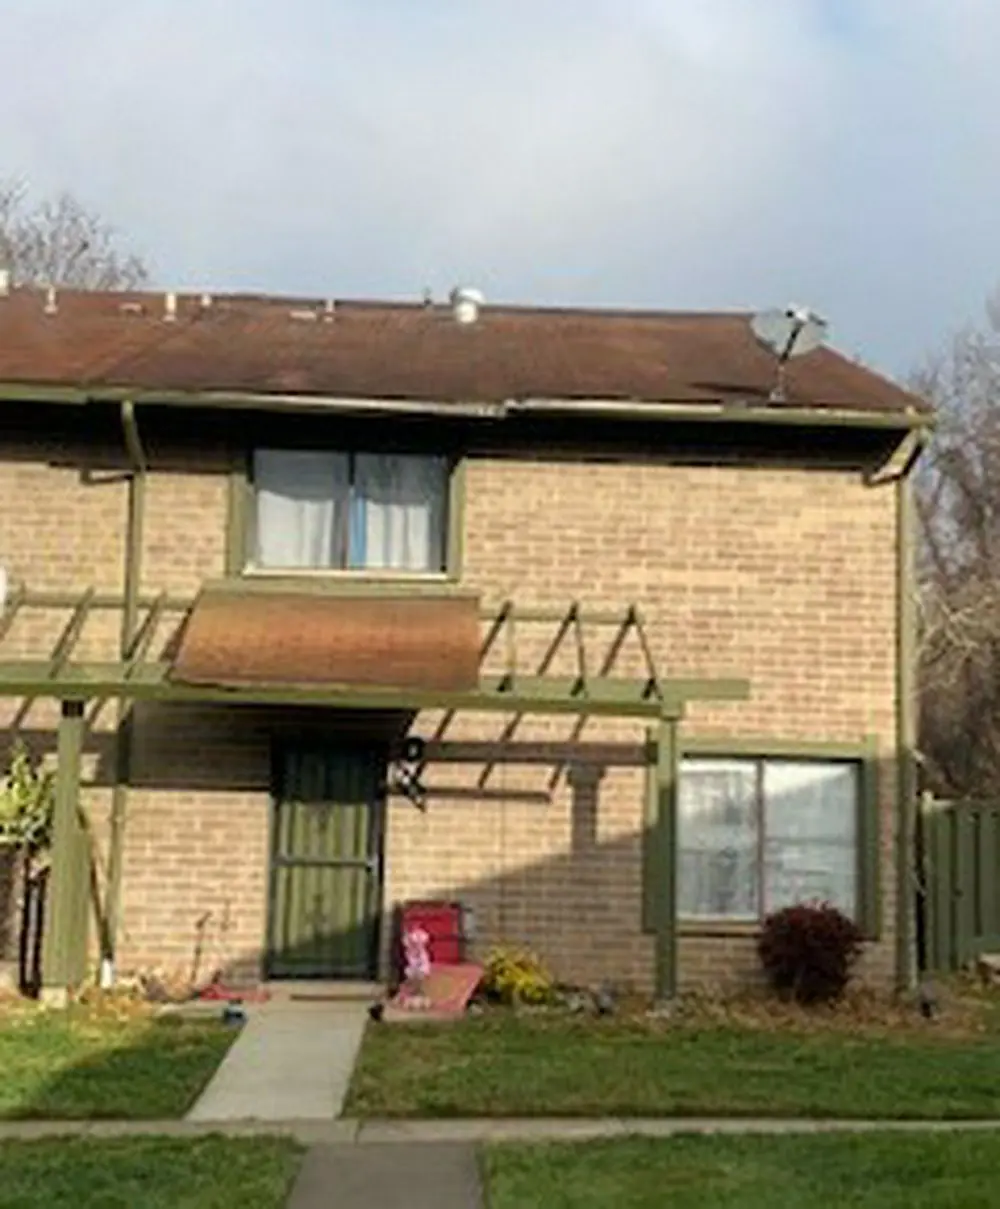
9462 Timesweep Ln · Columbia, MD
Flood risk 1/10 · Minimal
- FEMA flood zone
- X (unshaded)
- Chance of flooding over 30 yrs
- 0.0%
- Est. flood insurance / yr
- $507 – $1,088
Fire risk 1/10 · Minimal
- Est. fire insurance / yr
- $755 – $1,403
Heat risk 6/10 · Moderate
- Hot days now (above 103°F)
- 7 days/yr
- Hot days in 30 yrs
- 15 days/yr
Wind risk 4/10 · Minor
- Chance of severe wind over 30 yrs
- 17.0%
Air-quality risk 4/10 · Minor
- Unhealthy air days now
- 5 days/yr
- Unhealthy air days in 30 yrs
- 6 days/yr
Risk factors via First Street. Map © Google.
Why this score? — see what drove the D grade
The composite is a weighted blend of 9 inputs, each scored 0–100. Each bar is that input's sub-score; the figure is the points it added to the 100-point composite (weight × sub-score).
- ARV discount +11.1/15.0
- Cash flow +10.6/30.0
- Schools +4.1/10.0
- Livability +4.0/5.0
- DSCR +3.1/10.0
- Rent growth +3.0/5.0
- 1% rule +2.8/10.0
- Condition / age +2.5/5.0
- Appreciation +0.0/10.0
$340,000
🖨 Deal sheet (PDF) 📄 Offer letter ✓ Due diligence
Listing remarks MLS
This home is 2 levels with3 bedrooms, 1 and 1/2 bathrooms, washer dryer, fenced patio. It has a new roof, HVAC system, refrigerator and ready for you to personalize. It is tenant occupied. The condo fee is low as well. Close to schools, shopping center, bus stop, parks and more.
Key facts
- Fenced patio
- Close to schools
- Close to bus stop
Tags
Neighborhood map
What this means for you Summary
Snapshot
- This is a 3-bed/1.5-bath townhouse listed at $340k.
Deal economics
- At list price, monthly cash flow is $-168 ($-2k/yr) — negative.
- To cash-flow at today's rent, offer at most $310k (8.7% below list).
- To meet the 1% rule (rent ≥ 1% of price), the offer needs to be $264k (22.4% below list).
- Recommended offer: $264k (22.4% below list) — sets the bar for 1% rule.
- Cap rate 5.7% vs local median 3.2% in Columbia — top-decile yield for the area; either an underpriced asset or a hidden risk that comps aren't pricing in. Stress-test before assuming the spread holds.
Location & tenants
- Location reads 80/100 on livability (#51 in MD, #1,939 nationally) — a professional / high-income tenant draw. Strengths: commute A+, employment A+, housing A+; Watch: amenities C-, cost of living F.
- Howard County Public Schools (suburban): math 34% / reading 49% proficiency, ranked #1 of 24 in MD (top 4%) — families likely to look elsewhere, expect single-tenant / working-renter base with shorter leases; only 15% free/reduced lunch — higher-income household profile.
- Zoned schools: Talbott Springs Elementary (math 16% / reading 22%, grade F, #385 of 860 statewide, top 46%, 483 students, 54% FRL); Oakland Mills Middle (math 13% / reading 41%, grade F, #81 of 225 statewide, top 38%, 475 students, 51% FRL); Oakland Mills High (math 42% / reading 64%, grade C-, #95 of 222 statewide, top 43%, 1,401 students, 43% FRL) — zoned schools average 49% FRL vs 15% district-wide (34 pts higher); higher-poverty schools than district average — tighter screening recommended.
- Market conditions: Rents rising (+1.9%/yr); 123 active listings in the ZIP; 19 comparable units currently listed for rent nearby; rentals leasing fast (median 0d on market — plan ~1-2 weeks tenant-placement turnaround); high-income renter base; 881 units permitted in Howard County in 2024 (285 in 5+ unit buildings).
Forward outlook
- Local home prices are declining (-3.0%/yr); year-one equity from $2k of loan paydown is wiped out by about $10k of value loss. Plan a longer hold.
- Howard County population projected at +33% by 2050 — long-run rental-demand tailwind backs the buy-and-hold thesis.
Negotiation context
- It's been on market 78 days — a 6% lower offer ($320k) is reasonable based on typical stale-listing flexibility.
- 8 sale attempts since 30y ago with the ask held roughly flat each time — persistent listings suggest the price (not the market) is what's stuck; bring a comps-based counter.
- Current owner paid $85k; list at $340k implies a 302% gain — meaningful room to come down on a strong offer.
Risks & watch-outs
- Climate carrying-cost: extreme-heat days projected 7→15/yr by 2055 (HVAC capex compounding) — expect insurance premiums to compound above CPI over the hold.
Questions for the listing agent
- What do current leases actually rent for vs. the listed asking? Can we see a recent rent roll and the last 12 months of T-12 income?
- It's been on market 78 days. Have you received any prior offers? Is the seller open to a 22% concession, seller financing, or rate buy-down credit?
- Built in 1973 — when were the roof, HVAC, electrical panel, plumbing, and water heater last replaced?
- Why hasn't it sold? Are there any deal-killer items the seller is aware of (foundation, flood, title, zoning, code violations)?
- Is there a deadline driving the sale (1031 exchange, divorce, estate, relocation)? That informs how much negotiation room exists.
- Schools are B-rated — typically a magnet for longer-tenancy family renters. What's the average tenant stay here, and is there a school-zone premium baked into asking?
- The area grade is low — what's the realistic commute time and amenity access for the typical tenant pool here? Any planned neighborhood developments (good or bad) we should know about?
- What's the average days-on-market for RENTAL listings here right now (not sales)? A rising rental-DOM trend means longer vacancies and softer asking-rent achievability than the comps imply.
- What's the recent tenant-quality profile in this submarket — average credit score on applications, eviction rate, late-payment / NSF rate, and stable-employment percentage? A property-management company in the area should have these aggregated.
- How much new for-sale + rental construction is in the pipeline within 1–3 miles? Heavy new supply typically softens prices + rents 12–24 months out; constrained supply supports both.
Investment metrics
- 1% rule
- 0.78% ✗
- Cap rate
- 5.70%
- Cash-on-cash
- -2.11%
- DSCR
- 0.91
- GRM
- 10.7
CMA / ARV
- ARV (median comp)
- $369,327
- List price
- $340,000
- Delta
- -7.94%
- Verdict
- FAIR
- Comps
- 20 within 1.0 mi
Show comp detail 12 sales within ~0.75 mi
| Address | Dist | Beds/Ba | Sqft | Sold | Price | $/sf | Match |
|---|---|---|---|---|---|---|---|
| 9492 Timesweep Ln | 0.04mi | 3/2.5 | 1,248 (0%) | 1mo | $381,500 | $306 | 94 |
| 5752 Thunder Hill Rd | 0.09mi | 3/1.5 | 1,248 (0%) | 11mo | $350,000 | $280 | 87 |
| 9493 Timesweep Ln | 0.07mi | 3/2.5 | 1,280 (+3%) | 4mo | $375,000 | $293 | 85 |
| 9550 Transfer Row | 0.50mi | 3/1.5 | 1,248 (0%) | 4mo | $325,000 | $260 | 73 |
| 9585 Standon Pl | 0.53mi | 3/1.5 | 1,248 (0%) | 3mo | $365,000 | $292 | 72 |
| 9584 Standon Pl | 0.49mi | 3/1.5 | 1,248 (0%) | 9mo | $360,000 | $288 | 70 |
| 9456 Merryrest Rd | 0.28mi | 3/2.0 | 1,370 (+10%) | 0mo | $390,900 | $285 | 68 |
| 5834 Morningbird Ln | 0.12mi | 3/2.5 | 1,417 (+14%) | 7mo | $403,000 | $284 | 62 |
| 5838 Morningbird Ln | 0.11mi | 3/3.5 | 1,360 (+9%) | 12mo | $415,000 | $305 | 62 |
| 9318 Matador Rd | 0.55mi | 3/2.0 | 1,284 (+3%) | 7mo | $355,000 | $276 | 61 |
| 9322 Matador Rd | 0.56mi | 3/2.0 | 1,284 (+3%) | 16mo | $390,000 | $304 | 54 |
| 9329 Matador Rd | 0.54mi | 3/2.0 | 1,356 (+9%) | 13mo | $375,000 | $277 | 48 |
Match score weights: distance 35% · size 25% · config 20% · recency 20%. Top-matched comps best support the ARV.
Projected returns pro-forma
-3.0% appreciation · 1.88% rent growth · sell at horizon
- IRR
- -21.0%
- Equity multiple
- 0.28×
- Total profit
- $-68,741
- Equity at exit
- $50,695
- IRR
- -17.1%
- Equity multiple
- 0.10×
- Total profit
- $-85,498
- Equity at exit
- $29,397
Cash invested: $95,200 (down + closing). Projections, not guarantees.
Landlord ↔ Tenant lean methodology
- Overall (STATE)
- 27 Tenant-Leaning
- State Maryland
- 27 Tenant-Leaning · D+14
- County
- — inherits STATE
- City
- — inherits STATE
ZIP-level market 21045
- Rents YoY
- 1.9%
- Active inventory
- 123
- Price-to-rent
- 10.7×
Monthly cashflow live
- Estimated rent
- $2,639 high interval (Pro) →
- Mortgage (P&I)
- −$1,783
- Tax from tax record
- −$328 /mo · $3,937/yr
- Insurance
- −$142
- HOA
- −$0
- Vacancy / Maint / Mgmt
- −$554
- Net cashflow
- $-168
Break-even live
Sensitivity live
| Price | -10% $25 | -5% $-72 | +0% $-168 | +5% $-264 | +10% $-360 |
|---|---|---|---|---|---|
| Rent | -10% $-376 | -5% $-272 | +0% $-168 | +5% $-64 | +10% $41 |
| Rate | -1.0pp $3 | -0.5pp $-81 | base $-168 | +0.5pp $-256 | +1.0pp $-345 |
UW: 25.0% down · 7.5% · 30yr · 1.5% tax · 5.0% vac · 8.0% maint · 8.0% mgmt
Financing live
Cash to close
- Down payment
- $85,000
- Closing costs
- $10,200
- Reserves months
- —
- Total cash needed
- —
Loan-product check · same deal, 3 products live
Conventional
25% down · 7.5% · 30yr
- Down + closing
- —
- Monthly P&I
- —
- Monthly cashflow
- —
- DSCR
- —
- Eligible?
- —
Personal DTI + credit; lowest rate.
DSCR
20% down · 8.5% · 30yr
- Down + closing
- —
- Monthly P&I
- —
- Monthly cashflow
- —
- DSCR
- —
- Eligible?
- —
No personal income docs; deal must DSCR.
Hard money
10% down · 12.0% · 12mo
- Down + closing
- —
- Monthly P&I
- —
- Monthly cashflow
- —
- DSCR
- —
- Eligible?
- —
Short-term bridge; refi at stabilization.
Rent comps 19 comps
| Address | Beds | Baths | Sqft | Rent | $/sqft | DOM | Units | Dist |
|---|---|---|---|---|---|---|---|---|
| 9633 Whiteacre Rd Unit B4 Columbia, MD | 2.0 | 1.5 | 953 | $1,789 | $1.88 | 45d | 1 | 0.30mi |
| 6001 Majors Ln Columbia, MD | 3.0 | 2.0 | 1200 | $2,695 | $2.25 | 0d | 1 | 0.88mi |
| 5915 Tamar Dr #11 Columbia, MD | 2.0 | 1.0 | 950 | $1,800 | $1.89 | 0d | 1 | 0.91mi |
| 10201 Wincopin Cir Columbia, MD | 1.0–2.0 | 1.0–2.0 | 860 | $3,556 | $4.13 | 0d | 14 | 0.94mi |
| 10360 Swift Stream Pl Columbia, MD | 1.0–3.0 | 1.0–2.0 | 1067 | $3,108 | $2.91 | 0d | 18 | 0.96mi |
| 6037 Majors Ln Unit 6D18 Columbia, MD | 3.0 | 2.0 | 1280 | $2,390 | $1.87 | 19d | 1 | 1.02mi |
| 6085 Majors Ln Apt 11 Columbia, MD | 4.0 | 2.0 | 1346 | $2,400 | $1.78 | 45d | 1 | 1.04mi |
| 5382 Smooth Meadow Way Unit B2A-12 Columbia, MD | 2.0 | 2.0 | 1154 | $2,300 | $1.99 | 12d | 1 | 1.15mi |
| 8905 Tamar Dr Columbia, MD | 1.0–2.0 | 1.0–2.0 | 900 | $1,743 | $1.94 | 45d | 1 | 1.16mi |
| 8854 Spiral Cut Unit L Columbia, MD | 2.0 | 1.0 | 938 | $1,850 | $1.97 | 18d | 1 | 1.22mi |
| 5361 Brook Way Columbia, MD | 1.0–5.0 | 1.0–2.5 | 1280 | $2,695 | $2.11 | 0d | 32 | 1.24mi |
| 6000 Merriweather Dr Columbia, MD | 3.0 | 1.0–2.0 | 1034 | $4,004 | $3.87 | 3d | 23 | 1.25mi |
| 6200 Valencia Ln Columbia, MD | 1.0–2.0 | 1.0–2.0 | 912 | $3,802 | $4.17 | 0d | 28 | 1.31mi |
| 5740 Yellowrose Ct Columbia, MD | 3.0 | 2.0 | 700 | $1,850 | $2.64 | 19d | 1 | 1.31mi |
| 5441 Columbia Rd Columbia, MD | 1.0–3.0 | 1.0–2.0 | 1064 | $3,060 | $2.88 | 0d | 1 | 1.39mi |
| 10101 Twin Rivers Rd Columbia, MD | 3.0 | 1.0–2.0 | 1017 | $3,802 | $3.74 | 0d | 38 | 1.40mi |
| 10000 Town Center Ave Columbia, MD | 1.0–3.0 | 1.0–2.0 | 1014 | $3,754 | $3.70 | 0d | 30 | 1.40mi |
| 5331 Columbia Rd Columbia, MD | 1.0–3.0 | 1.0–2.0 | 975 | $2,924 | $3.00 | 0d | 10 | 1.46mi |
| 10601 Gramercy Pl Columbia, MD | 1.0–3.0 | 1.0–2.0 | 1043 | $4,102 | $3.93 | 0d | 11 | 1.49mi |
Listing history 24 events
-
2026-06-03days on market $340,000 Active 78 DOM
-
2026-06-02days on market $340,000 Active 77 DOM
-
2026-06-01days on market $340,000 Active 76 DOM
-
2026-05-31days on market $340,000 Active 75 DOM
-
2026-03-17$340,000 Active 279-char remark
Show marketing remark (279 chars)
This home is 2 levels with3 bedrooms, 1 and 1/2 bathrooms, washer dryer, fenced patio. It has a new roof, HVAC system, refrigerator and ready for you to personalize. It is tenant occupied. The condo fee is low as well. Close to schools, shopping center, bus stop, parks and more.
-
2013-05-12historical
-
2013-05-11historical
-
2013-02-24price
-
2013-02-15price
-
2013-02-02Active
-
2013-02-02$180,000
-
1998-04-20soldstatus $84,504
-
1997-03-19historical
-
1996-09-21
-
1996-09-21
-
1996-09-21historical
-
1996-09-20historical
-
1996-09-20historical
-
1996-03-27
-
1996-03-27
-
1996-03-27historical
-
1996-03-27
-
1990-09-17soldstatus $85,000
-
1987-07-09soldstatus $67,320
ⓘ Source: listings_history table (triggers on properties + properties_extension) + one-shot
backfill from property_details.listing_events for pre-trigger history.
Tax reassessment forecast MD · Partial reset (capped growth)
- Current annual tax
- $3,937 · $328/mo
- Projected year-2 tax
- $3,937 · $328/mo
- Expected delta
- $0/yr ($0/mo · 0.0%)
ⓘ Screening estimate from a state-policy table — verify with the county assessor before closing.
Climate risk First Street
- Flood 1/10 Low FEMA zone X (unshaded) · 0% chance over 30 yrs
- Wildfire 1/10 Low
- Heat 6/10 Major 7 d/yr ≥103°F today · 15 d/yr by 30 yrs out
- Wind 4/10 Moderate 17% chance of damaging wind over 30 yrs
- Air quality 4/10 Moderate 5 unhealthy d/yr today · 6 by 30 yrs out
Nearby sold comps map
Loading sold comps map…
Walkable amenities ~0.75 mi
Loading nearby amenities…
Taxation est. · year 1
- Rental income
- $31,670
- − Mortgage interest
- −$19,045
- − Property taxes
- −$3,937
- − Insurance
- −$1,700
- − Repairs & maintenance
- −$2,534
- − Management
- −$2,534
- − Depreciation
- −$9,891
- Taxable loss
- −$7,970
- Est. tax savings @ 24.0%
- +$1,913
- After-tax cash flow
- $-100/yr
For passive investors: Depreciation is non-cash, so a rental often shows a tax loss while cash-flowing — sheltering income. Rental losses are passive: they offset passive income freely, and up to $25,000/yr can offset ordinary (W-2) income if you actively participate and your MAGI is under $100k (phasing out to $0 by $150k); unused losses carry forward. On sale, claimed depreciation is recaptured at up to 25%, and gains may owe capital-gains tax (a 1031 exchange can defer both). Figures are a year-1 estimate at your 24.0% rate — not tax advice; consult a CPA.
Schools (NCES district)
- District
- Howard County Public Schools
- NCES district ID
- 2400420
- Math proficiency
- 34% ▼ -22.00%
- Reading proficiency
- 49% ▼ -11.00%
- Median HH income
- $108,056
- Composite
- 41.23/100
- National rank
- #3535
- State rank
- #1 of 24 in MD
Livability — Columbia
- Score
- 80/100
- State rank
- #51
- US rank
- #1939
Category grades
Schools grade is shown separately in the Schools card above.
Census & demographics
- Census place
- Columbia, MD
- County
- Howard County · 282,651 people
- City population
- 99,756
- Metro
- Baltimore-Columbia-Towson, MD
- Population (ZIP)
- 40,034
- Household income
- $118,563
- Rent vs Own
- Severe rent burden
- 882.0
Population outlook (Howard County) Hauer SSP2
- Today (2025)
- 367,857 people
- By 2030
- 394,054 · +7.1%
- By 2040
- 443,509 · +20.6%
- By 2050
- 488,124 · +32.7%
- By 2075
- 594,860 · +61.7%
- By 2100
- 648,772 · +76.4%
Race, ethnicity, and origin ACS 2023
- Neighborhood character
- Highly diverse neighborhood (Simpson 0.70)
- Race & ethnicity
- White 42% Black 32% Hispanic / Latino 11% Two or more races 9% Asian 9%
- Hispanic origin (detail)
- Mexican 1% Puerto Rican 1%
- Common ancestry
- Romanian 2% Slovak 2% Scotch-Irish 2%
- Foreign-born
- 22% · Canada, South Korea, China
- Languages at home
- 76% English-only · Spanish 8% Other Indo-European 4% French/Haitian/Cajun 2%
Political lean MEDSL · Howard
- 2024 margin
- Solid D (+41.8) · D 69.1% · R 27.4% · Other 3.5%
- 2008→2024 swing
- +19.9pp toward D · 2008: 21.9pp · 2024: 41.8pp
- All cycles
- 2024: D+41.8 2020: D+44.3 2016: D+33.5 2012: D+21.2 2008: D+21.9
Not yet ingested
- Civics
- —
Market trends
- HPI YoY
- ▼ -336.54%
- Current HPI
- 303.3585
- Rent YoY
- ▲ 1.88%
- Metro
- Baltimore-Columbia-Towson, MD
- State GDP YoY
- ▲ 2.97%
- F500 in state
- 12
Industry mix (Fortune 500 HQ in MD)
| Industry | F500 HQs | Revenue |
|---|---|---|
| Aerospace / Defense | 1 | $71B |
|
||
| Utilities | 1 | $25B |
|
||
| Hotels | 1 | $24B |
|
||
| Consumer Goods | 1 | $7B |
|
||
| Real Estate | 1 | $6B |
|
||
| Chemicals | 1 | $2B |
|
||
Price history
+405.1% since first listed20 events — show timeline
- 2026-03-17 Listed $340,000 ForSaleByOwner.com
- 2013-05-12 Delisted — MRIS
- 2013-05-11 Listing Removed — BRIGHT MLS
- 2013-02-24 Price Changed — MRIS
- 2013-02-15 Price Changed — MRIS
- 2013-02-02 Listed — MRIS
- 2013-02-02 Listed $180,000 BRIGHT MLS
- 1998-04-20 Sold (Public Records) $84,504 Public Records
- 1997-03-19 Delisted — MRIS
- 1996-09-21 Delisted — MRIS
- 1996-09-21 Listed — MRIS
- 1996-09-21 Listed — MRIS
- 1996-09-20 Delisted — MRIS
- 1996-09-20 Delisted — MRIS
- 1996-03-27 Listed — MRIS
- 1996-03-27 Delisted — MRIS
- 1996-03-27 Listed — MRIS
- 1996-03-27 Listed — MRIS
- 1990-09-17 Sold (Public Records) $85,000 Public Records
- 1987-07-09 Sold (Public Records) $67,320 Public Records
Property tax history
+7.7%/yrLatest (2025): $3,937 · +6.7% YoY. Source: county tax records.
Cash-flow waterfall
monthlySold comps — $/sqft
last 12 mo · ≤1 miLoading sold comps…