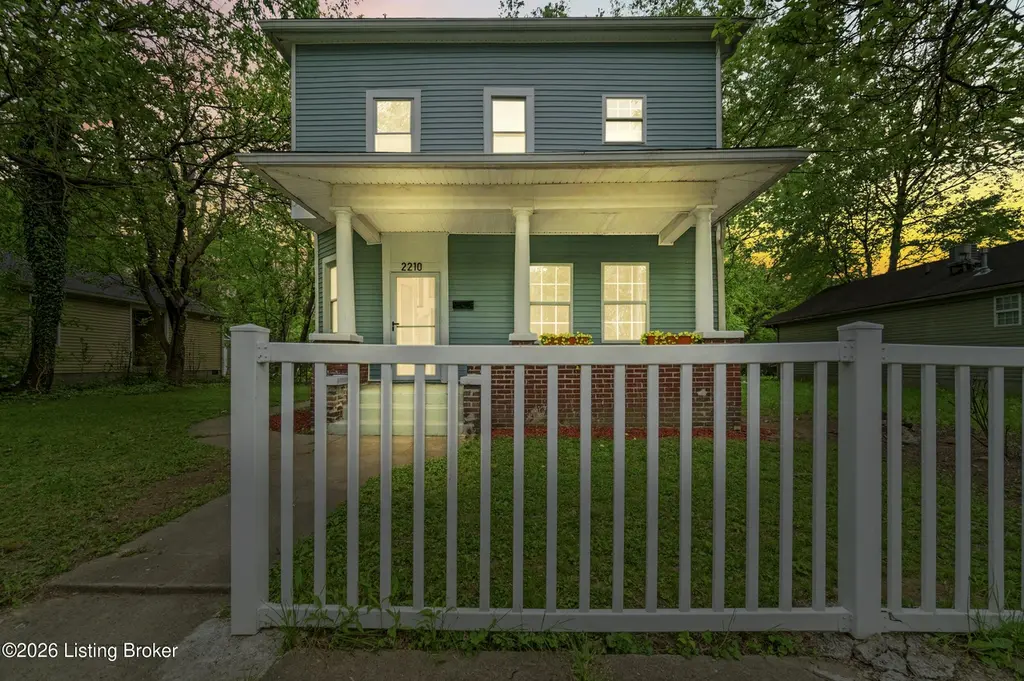
2210 W Burnett Ave · Louisville, KY
Flood risk 3/10 · Minor
- FEMA flood zone
- X (unshaded)
- Chance of flooding over 30 yrs
- 0.1%
- Est. flood insurance / yr
- $507 – $1,088
Fire risk 1/10 · Minimal
- Est. fire insurance / yr
- $839 – $1,559
Heat risk 5/10 · Moderate
- Hot days now (above 104°F)
- 7 days/yr
- Hot days in 30 yrs
- 19 days/yr
Wind risk 2/10 · Minimal
- Chance of severe wind over 30 yrs
- 1.0%
Air-quality risk 2/10 · Minimal
- Unhealthy air days now
- 1 days/yr
- Unhealthy air days in 30 yrs
- 3 days/yr
Risk factors via First Street. Map © Google.
Why this score? — see what drove the D- grade
The composite is a weighted blend of 9 inputs, each scored 0–100. Each bar is that input's sub-score; the figure is the points it added to the 100-point composite (weight × sub-score).
- Cash flow +10.2/30.0
- Appreciation +10.0/10.0
- Rent growth +4.5/5.0
- Livability +3.2/5.0
- DSCR +2.9/10.0
- Condition / age +2.5/5.0
- Schools +2.3/10.0
- 1% rule +1.7/10.0
- ARV discount +0.0/15.0
$200,699
🖨 Deal sheet (PDF) 📄 Offer letter ✓ Due diligence
Listing remarks MLS
Investor special! This 4 bedroom, 2 bathroom home is being sold AS-IS and is perfect for an investor looking to add to their rental portfolio or to flip for resale. The property needs a FULL renovation offering a great opportunity to maximize value.
Key facts
- Renovated home
- Spacious living area
- Flex space
Tags
Property features AI
Finance
- HOA & community: No association fee
Exterior
- Parking: See remarks for parking details
- Utilities: Electricity connected
- Home design: Single-family residence; Traditional style; 2 stories; Built in 1905
- Construction: Vinyl siding; Shingle roof; Concrete block foundation
- Exterior features: Sidewalk; Partial wood fencing
Interior
- Kitchen: Kitchen on the first floor
- Bedrooms: 3 bedrooms on the second floor
- Bathrooms: 2 full bathrooms
- Heating & cooling: Electric heating; Central air conditioning
- Interior features: 5 rooms total; Cellar basement; First-floor laundry
- Laundry & utility: Laundry located on the first floor
Neighborhood map
What this means for you Summary
Snapshot
- This is a 3-bed/2.0-bath single-family listed at $201k.
Deal economics
- At list price, monthly cash flow is $-113 ($-1k/yr) — negative.
- To cash-flow at today's rent, offer at most $181k (10.0% below list).
- To meet the 1% rule (rent ≥ 1% of price), the offer needs to be $135k (32.8% below list).
- Recommended offer: $135k (32.8% below list) — sets the bar for 1% rule.
Location & tenants
- Location reads 63/100 on livability (#333 in KY) — a middle-class / working-renter tenant base. Strengths: cost of living A+, housing A+; Watch: employment C-, health & safety D+, crime F.
- Jefferson County (urban): math 19% / reading 35% proficiency, ranked #121 of 165 in KY (top 73%) — low school quality limits family demand, transient renter base, plan for 1-2y turnover.
- Zoned schools: Maupin Elementary (math 2% / reading 2%, grade F, #676 of 676 statewide, top 100%, 298 students, 86% FRL); Noe Middle (math 49% / reading 62%, grade B-, #7 of 217 statewide, top 3%, 1,347 students, 46% FRL); Iroquois High (math 12% / reading 8%, grade F, #245 of 254 statewide, top 97%, 1,090 students, 74% FRL).
- Market conditions: Rents rising fast (+8.1%/yr); 93 active listings in the ZIP; 16 comparable units currently listed for rent nearby; rentals at typical pace (median 18d on market — plan ~3-4 weeks tenant-placement turnaround); lower-income renter base — watch delinquency; 2,836 units permitted in Jefferson County in 2024 (1,558 in 5+ unit buildings).
- At $1,349/mo this rent would consume 46% of the median local household income ($35k/yr) (locally 815% of renters already pay >50% of income on rent) — very limited rent-growth headroom before tenants either downsize or default.
Forward outlook
- In year one you build about $21k of equity ($1k loan paydown + $20k appreciation (10.0% local appreciation)).
- Jefferson County population projected at +13% by 2050 — modest demand growth; plan on rents tracking national, not racing it.
- By year 2, paydown + projected appreciation supports a ~$34k cash-out refi (75% LTV) — recoverable capital for the next deal without selling this one.
Negotiation context
- It's been on market 65 days — a 6% lower offer ($189k) is reasonable based on typical stale-listing flexibility.
- 3 sale attempts since 8y ago; this cycle's ask has dropped $17k (8%) from the opening price — seller is motivated, your offer sets the floor, not the list.
- Current owner paid $38k; list at $201k implies a 428% gain — meaningful room to come down on a strong offer.
Risks & watch-outs
- Watch-outs: built in 1905 — expect roof / HVAC / electrical / plumbing capex.
- Climate carrying-cost: extreme-heat days projected 7→19/yr by 2055 (HVAC capex compounding) — expect insurance premiums to compound above CPI over the hold.
Questions for the listing agent
- What do current leases actually rent for vs. the listed asking? Can we see a recent rent roll and the last 12 months of T-12 income?
- It's been on market 65 days. Have you received any prior offers? Is the seller open to a 33% concession, seller financing, or rate buy-down credit?
- Built in 1905 — when were the roof, HVAC, electrical panel, plumbing, and water heater last replaced?
- Why hasn't it sold? Are there any deal-killer items the seller is aware of (foundation, flood, title, zoning, code violations)?
- Is there a deadline driving the sale (1031 exchange, divorce, estate, relocation)? That informs how much negotiation room exists.
- Schools are D-rated, which usually means shorter tenancies and higher turnover. Who's the typical renter profile here, and what's been the actual vacancy rate?
- Crime grade is F in this area — have there been break-ins, vandalism, or insurance claims at this property in the last 3 years? What carrier currently insures it and at what premium?
- The area grade is low — what's the realistic commute time and amenity access for the typical tenant pool here? Any planned neighborhood developments (good or bad) we should know about?
- What's the average days-on-market for RENTAL listings here right now (not sales)? A rising rental-DOM trend means longer vacancies and softer asking-rent achievability than the comps imply.
- What's the recent tenant-quality profile in this submarket — average credit score on applications, eviction rate, late-payment / NSF rate, and stable-employment percentage? A property-management company in the area should have these aggregated.
- How much new for-sale + rental construction is in the pipeline within 1–3 miles? Heavy new supply typically softens prices + rents 12–24 months out; constrained supply supports both.
Investment metrics
- 1% rule
- 0.67% ✗
- Cap rate
- 5.61%
- Cash-on-cash
- -2.42%
- DSCR
- 0.89
- GRM
- 12.4
CMA / ARV
- ARV (on-the-fly)
- $161,280
- Comps found
- 12
Show comp detail 12 sales within ~0.75 mi
| Address | Dist | Beds/Ba | Sqft | Sold | Price | $/sf | Match |
|---|---|---|---|---|---|---|---|
| 1844 Bolling Ave | 0.13mi | 3/1.5 | 1,726 (-4%) | 6mo | $155,000 | $90 | 81 |
| 1365 Cypress St | 0.31mi | 3/1.5 | 1,764 (-2%) | 4mo | $165,000 | $94 | 77 |
| 2001 Wilson Ave | 0.38mi | 3/2.0 | 1,764 (-2%) | 8mo | $85,000 | $48 | 73 |
| 2307 W Lee St | 0.23mi | 4/2.0 (+1) | 1,600 (-11%) | 4mo | $172,000 | $108 | 63 |
| 1811 Beech St | 0.69mi | 3/2.0 | 1,872 (+4%) | 2mo | $168,000 | $90 | 59 |
| 2724 Hale Ave | 0.63mi | 3/1.5 | 1,891 (+6%) | 2mo | $55,000 | $29 | 57 |
| 2300 Oregon Ave | 0.71mi | 4/2.0 (+1) | 1,810 (+1%) | 4mo | $142,500 | $79 | 57 |
| 1703 Wilson Ave | 0.63mi | 3/1.5 | 1,896 (+6%) | 7mo | $32,000 | $17 | 53 |
| 1533 Beech St | 0.60mi | 4/2.0 (+1) | 1,660 (-7%) | 2mo | $120,000 | $72 | 53 |
| 1544 Catalpa St | 0.49mi | 4/2.5 (+1) | 1,596 (-11%) | 1mo | $185,000 | $116 | 51 |
| 2202 W Oak St | 0.48mi | 4/2.0 (+1) | 1,539 (-14%) | 1mo | $170,500 | $111 | 48 |
| 2341 Grand Ave | 0.68mi | 3/1.5 | 2,002 (+12%) | 4mo | $129,900 | $65 | 43 |
Match score weights: distance 35% · size 25% · config 20% · recency 20%. Top-matched comps best support the ARV.
Projected returns pro-forma
10.0% appreciation · 8.0% rent growth · sell at horizon
- IRR
- 23.9%
- Equity multiple
- 2.94×
- Total profit
- $109,101
- Equity at exit
- $180,806
- IRR
- 22.3%
- Equity multiple
- 7.13×
- Total profit
- $344,411
- Equity at exit
- $389,914
Cash invested: $56,196 (down + closing). Projections, not guarantees.
Landlord ↔ Tenant lean methodology
- Overall (STATE)
- 83 Strongly Landlord-Friendly
- State Kentucky
- 83 Strongly Landlord-Friendly · R+16
- County
- — inherits STATE
- City
- — inherits STATE
ZIP-level market 40210
- Home prices YoY
- 12.1%
- Rents YoY
- 8.1%
- Active inventory
- 93
- Price-to-rent
- 12.4×
Monthly cashflow live
- Estimated rent
- $1,349 high interval (Pro) →
- Mortgage (P&I)
- −$1,052
- Tax from tax record
- −$43 /mo · $515/yr
- Insurance
- −$84
- HOA
- −$0
- Vacancy / Maint / Mgmt
- −$283
- Net cashflow
- $-113
Break-even live
Sensitivity live
| Price | -10% $0 | -5% $-57 | +0% $-113 | +5% $-170 | +10% $-227 |
|---|---|---|---|---|---|
| Rent | -10% $-220 | -5% $-167 | +0% $-113 | +5% $-60 | +10% $-7 |
| Rate | -1.0pp $-12 | -0.5pp $-62 | base $-113 | +0.5pp $-165 | +1.0pp $-218 |
UW: 25.0% down · 7.5% · 30yr · 1.5% tax · 5.0% vac · 8.0% maint · 8.0% mgmt
Financing live
Cash to close
- Down payment
- $50,175
- Closing costs
- $6,021
- Reserves months
- —
- Total cash needed
- —
Loan-product check · same deal, 3 products live
Conventional
25% down · 7.5% · 30yr
- Down + closing
- —
- Monthly P&I
- —
- Monthly cashflow
- —
- DSCR
- —
- Eligible?
- —
Personal DTI + credit; lowest rate.
DSCR
20% down · 8.5% · 30yr
- Down + closing
- —
- Monthly P&I
- —
- Monthly cashflow
- —
- DSCR
- —
- Eligible?
- —
No personal income docs; deal must DSCR.
Hard money
10% down · 12.0% · 12mo
- Down + closing
- —
- Monthly P&I
- —
- Monthly cashflow
- —
- DSCR
- —
- Eligible?
- —
Short-term bridge; refi at stabilization.
Rent comps 16 comps
| Address | Beds | Baths | Sqft | Rent | $/sqft | DOM | Units | Dist |
|---|---|---|---|---|---|---|---|---|
| 1774 Bolling Ave Louisville, KY | 3.0 | 2.0 | 1611 | $1,300 | $0.81 | 12d | 1 | 0.34mi |
| 1545 Catalpa St Louisville, KY | 4.0 | 1.5 | 1760 | $1,545 | $0.88 | 5d | 1 | 0.46mi |
| 1618 S 30th St Louisville, KY | 3.0 | 1.0 | 1896 | $1,235 | $0.65 | 18d | 1 | 0.70mi |
| 1705 1/2 Hale Ave Louisville, KY | 3.0 | 2.0 | 1257 | $1,400 | $1.11 | 12d | 1 | 0.73mi |
| 1847 W Kentucky St Louisville, KY | 2.0 | 1.0 | 1368 | $895 | $0.65 | 5d | 1 | 0.85mi |
| 2825 Greenwood Ave #4 Louisville, KY | 3.0 | 1.0 | 1440 | $1,250 | $0.87 | 25d | 1 | 0.88mi |
| 2825 Greenwood Ave #2 Louisville, KY | 2.0 | 1.0 | 1300 | $995 | $0.77 | 25d | 1 | 0.88mi |
| 2912 Greenwood Ave Louisville, KY | 3.0 | 2.0 | 1362 | $1,150 | $0.84 | 18d | 1 | 0.88mi |
| 1115 S 32nd St Louisville, KY | 3.0 | 1.0 | 1393 | $1,275 | $0.92 | 23d | 1 | 0.95mi |
| 1115 S 32nd St Louisville, KY | 3.0 | 1.0 | 1393 | $1,275 | $0.92 | 25d | 1 | 0.95mi |
| 820 Hazel St Louisville, KY | 4.0 | 2.0 | 1872 | $1,395 | $0.75 | 4d | 1 | 1.22mi |
| 3514 Grand Ave Louisville, KY | 3.0 | 1.5 | 1450 | $1,295 | $0.89 | 23d | 1 | 1.23mi |
| 737 S 33rd St Louisville, KY | 4.0 | 1.0 | 1356 | $1,595 | $1.18 | 25d | 1 | 1.40mi |
| 803 S 35th St Louisville, KY | 3.0 | 1.0 | 1486 | $1,350 | $0.91 | 25d | 1 | 1.44mi |
| 1810 Magazine St Louisville, KY | 3.0 | 1.5 | 1248 | $1,450 | $1.16 | 12d | 1 | 1.47mi |
| 1501 Bellamy Pl Louisville, KY | 2.0–4.0 | 2.0–4.0 | 1074 | $2,217 | $2.06 | 5d | 1 | 1.47mi |
Listing history 22 events
-
2026-06-21days on market $200,699 Active 65 DOM
-
2026-06-18days on market $200,699 Active 62 DOM
-
2026-06-17days on market $200,699 Active 61 DOM
-
2026-06-16days on market $200,699 Active 60 DOM
-
2026-06-15days on market $200,699 Active 59 DOM
-
2026-06-13pricedays on market $200,699 Active 57 DOM
-
2026-06-10days on market $217,900 Active 54 DOM
-
2026-06-09days on market $217,900 Active 53 DOM
-
2026-06-08days on market $217,900 Active 52 DOM
-
2026-06-07days on market $217,900 Active 51 DOM
-
2026-06-03days on market $217,900 Active 47 DOM
-
2026-06-02days on market $217,900 Active 46 DOM
-
2026-06-01days on market $217,900 Active 45 DOM
-
2026-05-31days on market $217,900 Active 44 DOM
-
2026-04-17$217,900 Active
-
2025-04-10soldstatus $38,000 Closed 249-char remark
Show marketing remark (249 chars)
Investor special! This 4 bedroom, 2 bathroom home is being sold AS-IS and is perfect for an investor looking to add to their rental portfolio or to flip for resale. The property needs a FULL renovation offering a great opportunity to maximize value.
-
2025-04-07status Pending 249-char remark
Show marketing remark (249 chars)
Investor special! This 4 bedroom, 2 bathroom home is being sold AS-IS and is perfect for an investor looking to add to their rental portfolio or to flip for resale. The property needs a FULL renovation offering a great opportunity to maximize value.
-
2025-03-12historical Active Under Contract 249-char remark
Show marketing remark (249 chars)
Investor special! This 4 bedroom, 2 bathroom home is being sold AS-IS and is perfect for an investor looking to add to their rental portfolio or to flip for resale. The property needs a FULL renovation offering a great opportunity to maximize value.
-
2025-02-10$38,000 Active 249-char remark
Show marketing remark (249 chars)
Investor special! This 4 bedroom, 2 bathroom home is being sold AS-IS and is perfect for an investor looking to add to their rental portfolio or to flip for resale. The property needs a FULL renovation offering a great opportunity to maximize value.
-
2018-10-15soldstatus $10,000 Closed 415-char remark
Show marketing remark (415 chars)
Large four bedroom, two bath vinyl-sided 2-story home with a spacious living room, eat-in kitchen and large bedrooms. Hardwood flooring; insulated windows. Covered front porch. furnace, water heater and additional storage in cellar. Has 2 sheds. Off-street parking at rear with alley access. Could be easily converted into a duplex (separate meters). This is a Fannie Mae property. AGENTS: PLEASE READ AGENT NOTES.
-
2018-09-25status Pending 415-char remark
Show marketing remark (415 chars)
Large four bedroom, two bath vinyl-sided 2-story home with a spacious living room, eat-in kitchen and large bedrooms. Hardwood flooring; insulated windows. Covered front porch. furnace, water heater and additional storage in cellar. Has 2 sheds. Off-street parking at rear with alley access. Could be easily converted into a duplex (separate meters). This is a Fannie Mae property. AGENTS: PLEASE READ AGENT NOTES.
-
2018-09-13$10,000 Active 415-char remark
Show marketing remark (415 chars)
Large four bedroom, two bath vinyl-sided 2-story home with a spacious living room, eat-in kitchen and large bedrooms. Hardwood flooring; insulated windows. Covered front porch. furnace, water heater and additional storage in cellar. Has 2 sheds. Off-street parking at rear with alley access. Could be easily converted into a duplex (separate meters). This is a Fannie Mae property. AGENTS: PLEASE READ AGENT NOTES.
ⓘ Source: listings_history table (triggers on properties + properties_extension) + one-shot
backfill from property_details.listing_events for pre-trigger history.
Tax reassessment forecast KY · Resets to sale price
- Current annual tax
- $515 · $43/mo
- Projected year-2 tax
- $1,726 · $144/mo
- Expected delta
- +$1,211/yr (+$101/mo · 235.4%)
ⓘ Screening estimate from a state-policy table — verify with the county assessor before closing.
Climate risk First Street
- Flood 3/10 Moderate FEMA zone X (unshaded) · 10% chance over 30 yrs
- Wildfire 1/10 Low
- Heat 5/10 Major 7 d/yr ≥104°F today · 19 d/yr by 30 yrs out
- Wind 2/10 Low 100% chance of damaging wind over 30 yrs
- Air quality 2/10 Low 1 unhealthy d/yr today · 3 by 30 yrs out
Nearby sold comps map
Loading sold comps map…
Walkable amenities ~0.75 mi
Loading nearby amenities…
Taxation est. · year 1
- Rental income
- $16,185
- − Mortgage interest
- −$11,242
- − Property taxes
- −$515
- − Insurance
- −$1,003
- − Repairs & maintenance
- −$1,295
- − Management
- −$1,295
- − Depreciation
- −$5,839
- Taxable loss
- −$5,003
- Est. tax savings @ 24.0%
- +$1,201
- After-tax cash flow
- $-161/yr
For passive investors: Depreciation is non-cash, so a rental often shows a tax loss while cash-flowing — sheltering income. Rental losses are passive: they offset passive income freely, and up to $25,000/yr can offset ordinary (W-2) income if you actively participate and your MAGI is under $100k (phasing out to $0 by $150k); unused losses carry forward. On sale, claimed depreciation is recaptured at up to 25%, and gains may owe capital-gains tax (a 1031 exchange can defer both). Figures are a year-1 estimate at your 24.0% rate — not tax advice; consult a CPA.
Schools (NCES district)
- District
- Jefferson County
- NCES district ID
- 2102990
- Math proficiency
- 19% ▼ -17.00%
- Reading proficiency
- 35% ▼ -11.00%
- Median HH income
- $47,885
- Composite
- 23.45/100
- National rank
- #7884
- State rank
- #121 of 165 in KY
Livability — Louisville
- Score
- 63/100
- State rank
- #333
- US rank
- #15887
Category grades
Schools grade is shown separately in the Schools card above.
Census & demographics
- Census place
- Louisville, KY
- County
- Jefferson County · 790,184 people
- City population
- 769,292
- Metro
- Louisville/Jefferson County, KY-IN
- Population (ZIP)
- 13,518
- Household income
- $35,347
- Rent vs Own
- Severe rent burden
- 815.0
Population outlook (Jefferson County) Hauer SSP2
- Today (2025)
- 823,112 people
- By 2030
- 849,343 · +3.2%
- By 2040
- 895,696 · +8.8%
- By 2050
- 933,630 · +13.4%
- By 2075
- 1,028,262 · +24.9%
- By 2100
- 1,072,675 · +30.3%
Race, ethnicity, and origin ACS 2023
- Neighborhood character
- Predominantly Black (84%)
- Race & ethnicity
- Black 84% White 8% Two or more races 5% Hispanic / Latino 3%
- Common ancestry
- Iranian 1%
- Foreign-born
- 4% · Canada
- Languages at home
- 93% English-only · Spanish 3%
Political lean MEDSL · Jefferson
- 2024 margin
- D (+16.6) · D 57.4% · R 40.9% · Other 1.7%
- 2008→2024 swing
- +4.5pp toward D · 2008: 12.0pp · 2024: 16.6pp
- All cycles
- 2024: D+16.6 2020: D+20.1 2016: D+13.3 2012: D+11.1 2008: D+12.0
Not yet ingested
- Civics
- —
Market trends
- HPI YoY
- ▲ 28.45%
- Current HPI
- 264.0146
- Rent YoY
- ▲ 8.05%
- Metro
- Louisville/Jefferson County, KY-IN
- State GDP YoY
- ▲ 1.81%
- F500 in state
- 4
Industry mix (Fortune 500 HQ in KY)
| Industry | F500 HQs | Revenue |
|---|---|---|
| Healthcare | 1 | $118B |
|
||
| Food / Beverage | 1 | $7B |
|
||
Price history
+2079.0% since first listed8 events — show timeline
- 2026-04-17 Listed $217,900 Metro Search MLS
- 2025-04-10 Sold (MLS) $38,000 Metro Search MLS
- 2025-04-07 Pending — Metro Search MLS
- 2025-03-12 Contingent — Metro Search MLS
- 2025-02-10 Listed $38,000 Metro Search MLS
- 2018-10-15 Sold (MLS) $10,000 Metro Search MLS
- 2018-09-25 Pending — Metro Search MLS
- 2018-09-13 Listed $10,000 Metro Search MLS
Property tax history
+31.2%/yrLatest (2025): $515 · -1.9% YoY. Source: county tax records.
Cash-flow waterfall
monthlySold comps — $/sqft
last 12 mo · ≤1 miLoading sold comps…