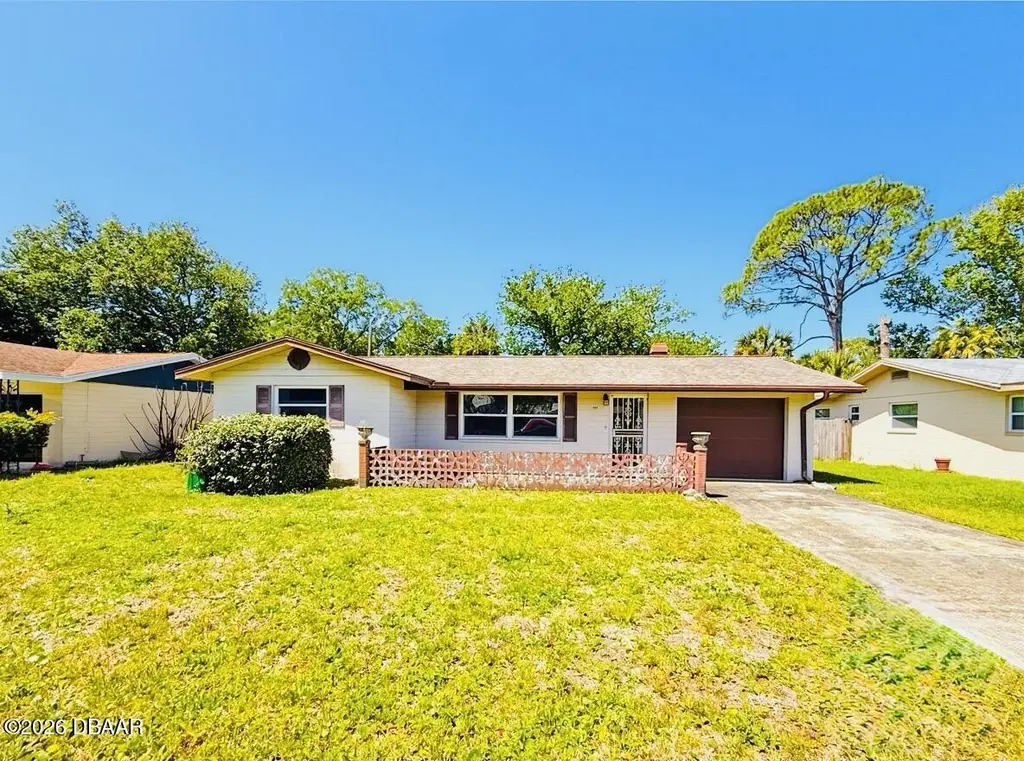
1504 Wildrose Ln · Daytona Beach, FL
Flood risk 1/10 · Minimal
- FEMA flood zone
- X (unshaded)
- Chance of flooding over 30 yrs
- 0.0%
- Est. flood insurance / yr
- $507 – $1,088
Fire risk 3/10 · Minor
- Est. fire insurance / yr
- $947 – $1,759
Heat risk 10/10 · Severe
- Hot days now (above 105°F)
- 7 days/yr
- Hot days in 30 yrs
- 20 days/yr
Wind risk 10/10 · Severe
- Chance of severe wind over 30 yrs
- 99.0%
Air-quality risk 2/10 · Minimal
- Unhealthy air days now
- 1 days/yr
- Unhealthy air days in 30 yrs
- 1 days/yr
Risk factors via First Street. Map © Google.
Why this score? — see what drove the C- grade
The composite is a weighted blend of 9 inputs, each scored 0–100. Each bar is that input's sub-score; the figure is the points it added to the 100-point composite (weight × sub-score).
- Cash flow +21.1/30.0
- ARV discount +7.5/15.0
- DSCR +6.7/10.0
- 1% rule +5.6/10.0
- Livability +4.2/5.0
- Schools +3.9/10.0
- Rent growth +2.8/5.0
- Condition / age +2.5/5.0
- Appreciation +0.0/10.0
$208,000
🖨 Deal sheet 📄 Offer letter ✓ Due diligence
Listing remarks
Step into the sweet home AND get a deal. This 3/2 bath has been well taken care of. Clearly loved, this home provides your opportunity to own a home right outside of city limits! Impact resistant windows throughout the home. Enjoy a SPACIOUS backyard, and a chance to make this home your own for an awesome price! Don't miss this deal! Schedule your showing today!
Key facts
- Spacious backyard
- 8,712 sq ft lot
- Garage
Tags
Property features AI
Exterior
- Parking: 1-car garage
- Utilities: Public water; Septic tank sewer; Water available
- Home design: Single-family residence; One story; Residential zoning; Property listed as fixer
- Construction: Block construction; Block foundation; Shingle roof; Built on a 0.2-acre lot (approx. 65 ft x 140 ft)
- Exterior features: Front porch and rear porch; Back yard fencing; South-facing; Has a view; Asphalt road frontage (county road)
Interior
- Kitchen: Electric cooktop
- Bedrooms: 2 total rooms
- Flooring: Terrazzo
- Bathrooms: 2 full bathrooms
- Heating & cooling: Central air; Ceiling fans; No heating
- Interior features: Ceiling fans
- Laundry & utility: Electric dryer hookup
Neighborhood map
What this means for you Summary
Snapshot
- This is a 3-bed/2.0-bath single-family listed at $208k.
Deal economics
- At list price, monthly cash flow is $298 ($4k/yr) — positive.
- The deal already cash-flows at list — no discount required.
- Meets the 1% rule at list price ($2k rent vs $208k).
- Recommended offer: $205k (1.5% below list) — sets the bar for market timing.
Location & tenants
- Location reads 83/100 on livability (#46 in FL, #867 nationally) — a professional / high-income tenant draw. Strengths: amenities A+, commute A+, cost of living A+; Watch: employment D-.
- Volusia (suburban): math 44% / reading 49% proficiency, ranked #47 of 73 in FL (top 64%) — families likely to look elsewhere, expect single-tenant / working-renter base with shorter leases.
- Zoned schools: Champion Elementary School (math 39% / reading 44%, grade F, #1,437 of 2,144 statewide, top 68%, 584 students, 70% FRL); David C. Hinson Sr. Middle School (math 52% / reading 49%, grade C, #246 of 571 statewide, top 44%, 950 students, 52% FRL); Mainland High School (math 30% / reading 37%, grade F, #400 of 667 statewide, top 61%, 1,855 students, 64% FRL).
- Market conditions: Rents rising (+1.0%/yr); 332 active listings in the ZIP; 27 comparable units currently listed for rent nearby; rentals at typical pace (median 14d on market — plan ~3-4 weeks tenant-placement turnaround); 3,402 units permitted in Volusia County in 2024 (681 in 5+ unit buildings).
- At $2,208/mo this rent would consume 47% of the median local household income ($56k/yr) (locally 1781% of renters already pay >50% of income on rent) — very limited rent-growth headroom before tenants either downsize or default.
Forward outlook
- Local home prices are declining (-3.0%/yr); year-one equity from $1k of loan paydown is wiped out by about $6k of value loss. Plan a longer hold.
- Volusia County population projected at +19% by 2050 — long-run rental-demand tailwind backs the buy-and-hold thesis.
Negotiation context
- It's been on market 17 days — a 2% lower offer ($205k) is reasonable based on typical stale-listing flexibility.
Risks & watch-outs
- Climate carrying-cost: severe wind risk, 99% chance of damaging wind over 30y; extreme-heat days projected 7→20/yr by 2055 (HVAC capex compounding) — expect insurance premiums to compound above CPI over the hold.
Questions for the listing agent
- Built in 1966 — when were the roof, HVAC, electrical panel, plumbing, and water heater last replaced?
- Is there a deadline driving the sale (1031 exchange, divorce, estate, relocation)? That informs how much negotiation room exists.
- Schools are D-rated, which usually means shorter tenancies and higher turnover. Who's the typical renter profile here, and what's been the actual vacancy rate?
- What's the average days-on-market for RENTAL listings here right now (not sales)? A rising rental-DOM trend means longer vacancies and softer asking-rent achievability than the comps imply.
- What's the recent tenant-quality profile in this submarket — average credit score on applications, eviction rate, late-payment / NSF rate, and stable-employment percentage? A property-management company in the area should have these aggregated.
- How much new for-sale + rental construction is in the pipeline within 1–3 miles? Heavy new supply typically softens prices + rents 12–24 months out; constrained supply supports both.
Investment metrics
- 1% rule
- 1.06% ✓
- Cap rate
- 8.01%
- Cash-on-cash
- 6.14%
- DSCR
- 1.27
- GRM
- 7.8
CMA / ARV
No comps found within radius.
Projected returns pro-forma
-3.0% appreciation · 1.01% rent growth · sell at horizon
- IRR
- -9.1%
- Equity multiple
- 0.67×
- Total profit
- $-19,010
- Equity at exit
- $31,013
- IRR
- -2.5%
- Equity multiple
- 0.84×
- Total profit
- $-9,035
- Equity at exit
- $17,984
Cash invested: $58,240 (down + closing). Projections, not guarantees.
Landlord ↔ Tenant lean methodology
- Overall (STATE)
- 87 Strongly Landlord-Friendly
- State Florida
- 87 Strongly Landlord-Friendly · R+3
- County
- — inherits STATE
- City
- — inherits STATE
ZIP-level market 32117
- Home prices YoY
- -8.2%
- Rents YoY
- 1.0%
- Active inventory
- 332
- Price-to-rent
- 7.8×
Monthly cashflow live
- Estimated rent
- $2,208 high interval (Pro) →
- Mortgage (P&I)
- −$1,091
- Tax from tax record
- −$269 /mo · $3,228/yr
- Insurance
- −$87
- HOA
- −$0
- Vacancy / Maint / Mgmt
- −$464
- Net cashflow
- $298
Break-even live
UW: 25.0% down · 7.5% · 30yr · 1.5% tax · 5.0% vac · 8.0% maint · 8.0% mgmt
Financing live
Cash to close
- Down payment
- $52,000
- Closing costs
- $6,240
- Reserves months
- —
- Total cash needed
- —
Loan-product check · same deal, 3 products live
Conventional
25% down · 7.5% · 30yr
- Down + closing
- —
- Monthly P&I
- —
- Monthly cashflow
- —
- DSCR
- —
- Eligible?
- —
Personal DTI + credit; lowest rate.
DSCR
20% down · 8.5% · 30yr
- Down + closing
- —
- Monthly P&I
- —
- Monthly cashflow
- —
- DSCR
- —
- Eligible?
- —
No personal income docs; deal must DSCR.
Hard money
10% down · 12.0% · 12mo
- Down + closing
- —
- Monthly P&I
- —
- Monthly cashflow
- —
- DSCR
- —
- Eligible?
- —
Short-term bridge; refi at stabilization.
Rent comps 27 comps
| Address | Beds | Baths | Sqft | Rent | $/sqft | DOM | Units | Dist |
|---|---|---|---|---|---|---|---|---|
| 108 San Mardeen Ct Daytona Beach, FL | 3.0 | 2.0 | 1500 | $2,650 | $1.77 | 23d | 1 | 0.20mi |
| 1512 Richmond Ave Unit 1546284P Daytona Beach, FL | 3.0 | 2.0 | 1173 | $3,226 | $2.75 | 14d | 1 | 0.20mi |
| 1615 Derbyshire Rd Daytona Beach, FL | 3.0 | 1.5 | 1000 | $1,950 | $1.95 | 14d | 1 | 0.31mi |
| 1435 Atlanta Dr Daytona Beach, FL | 3.0 | 1.0 | 1200 | $1,800 | $1.50 | 23d | 1 | 0.38mi |
| 1235 Alcazar St Daytona Beach, FL | 3.0 | 2.0 | 1498 | $2,100 | $1.40 | 23d | 1 | 0.40mi |
| 1420 Alabama Ave Daytona Beach, FL | 4.0 | 2.0 | 1367 | $1,824 | $1.33 | 18d | 1 | 0.48mi |
| 1600 Lpga Blvd Daytona Beach, FL | 1.0–3.0 | 1.0–2.0 | 1045 | $2,622 | $2.51 | 11d | 21 | 0.67mi |
| 100 Windflower LN Daytona Beach, FL | 1.0–3.0 | 1.0–2.0 | 1021 | $2,516 | $2.46 | 11d | 63 | 0.67mi |
| 101 Claysburg LN Holly Hill, FL | 1.0–3.0 | 1.0–2.0 | 1163 | $2,800 | $2.41 | 14d | 25 | 0.67mi |
| 1559 Hammock Dr Unit B Holly Hill, FL | 2.0 | 1.5 | 1100 | $1,375 | $1.25 | 14d | 1 | 0.69mi |
| 1767 Valencia Ave Ormond Beach, FL | 4.0 | 2.0 | 1216 | $2,100 | $1.73 | 23d | 1 | 0.70mi |
| 1575 Megan Bay Cir Daytona Beach, FL | 3.0 | 2.0 | 1232 | $1,800 | $1.46 | 23d | 1 | 0.79mi |
| 1707 Evergreen St Ormond Beach, FL | 2.0 | 1.0 | 868 | $1,750 | $2.02 | 23d | 1 | 0.79mi |
| 1224 10th St Daytona Beach, FL | 3.0 | 1.0 | 1284 | $1,550 | $1.21 | 14d | 1 | 0.90mi |
| 1563 Hancock Ln Daytona Beach, FL | 2.0 | 2.0 | 912 | $1,475 | $1.62 | 11d | 1 | 0.93mi |
| 100 Integra Shores Dr Daytona Beach, FL | 2.0–3.0 | 2.0 | 1126 | $1,725 | $1.53 | 11d | 6 | 0.95mi |
| 946 15th St Daytona Beach, FL | 2.0 | 2.0 | 1010 | $1,500 | $1.49 | 23d | 1 | 0.96mi |
| 1851 Lpga Blvd Daytona Beach, FL | 1.0–3.0 | 1.0–3.0 | 966 | $2,516 | $2.60 | 11d | 49 | 1.01mi |
| 1500 Alexis AVE Daytona Beach, FL | 1.0–3.0 | 1.0–2.0 | 1003 | $2,205 | $2.20 | 11d | 32 | 1.02mi |
| 900 LPGA Blvd Daytona Beach, FL | 1.0–2.0 | 1.0–2.0 | 885 | $1,495 | $1.69 | 14d | 14 | 1.03mi |
| 1262 Essex Rd Daytona Beach, FL | 3.0 | 2.0 | 1500 | $1,900 | $1.27 | 23d | 1 | 1.17mi |
| 1610 N Clyde Morris Blvd Daytona Beach, FL | 1.0–3.0 | 1.0–2.0 | 1020 | $2,583 | $2.53 | 18d | 45 | 1.27mi |
| 638 LPGA Blvd Unit B Daytona Beach, FL | 3.0 | 2.0 | 1111 | $2,490 | $2.24 | 23d | 1 | 1.35mi |
| 1014 Indian Oaks E Daytona Beach, FL | 3.0 | 2.0 | 1500 | $2,650 | $1.77 | 23d | 1 | 1.40mi |
| 100 Alva Cir Daytona Beach, FL | 1.0–3.0 | 1.0–2.0 | 1140 | $2,245 | $1.97 | 11d | 12 | 1.44mi |
| 1381 N Clyde Morris Blvd Daytona Beach, FL | 1.0–3.0 | 1.0–2.0 | 919 | $1,964 | $2.14 | 11d | 10 | 1.45mi |
| 1799 N Williamson Blvd Daytona Beach, FL | 1.0–3.0 | 1.0–2.0 | 1071 | $2,529 | $2.36 | 11d | 9 | 1.50mi |
Listing history 3 events
-
2026-04-30status Pending
-
2026-04-22price $208,000
-
2026-04-13$213,000 Active
ⓘ Source: listings_history table (triggers on properties + properties_extension) + one-shot
backfill from property_details.listing_events for pre-trigger history.
Tax reassessment forecast FL · Resets to sale price
- Current annual tax
- $3,228 · $269/mo
- Projected year-2 tax
- $3,228 · $269/mo
- Expected delta
- $0/yr ($0/mo · 0.0%)
ⓘ Screening estimate from a state-policy table — verify with the county assessor before closing.
Climate risk First Street
- Flood 1/10 Low FEMA zone X (unshaded) · 0% chance over 30 yrs
- Wildfire 3/10 Moderate
- Heat 10/10 Extreme 7 d/yr ≥105°F today · 20 d/yr by 30 yrs out
- Wind 10/10 Extreme 99% chance of damaging wind over 30 yrs
- Air quality 2/10 Low 1 unhealthy d/yr today · 1 by 30 yrs out
Nearby sold comps map
Loading sold comps map…
Walkable amenities ~0.75 mi
Loading nearby amenities…
Taxation est. · year 1
- Rental income
- $26,501
- − Mortgage interest
- −$11,651
- − Property taxes
- −$3,228
- − Insurance
- −$1,040
- − Repairs & maintenance
- −$2,120
- − Management
- −$2,120
- − Depreciation
- −$6,051
- Taxable income
- $291
- Est. tax owed @ 24.0%
- −$70
- After-tax cash flow
- $3,509/yr
For passive investors: Depreciation is non-cash, so a rental often shows a tax loss while cash-flowing — sheltering income. Rental losses are passive: they offset passive income freely, and up to $25,000/yr can offset ordinary (W-2) income if you actively participate and your MAGI is under $100k (phasing out to $0 by $150k); unused losses carry forward. On sale, claimed depreciation is recaptured at up to 25%, and gains may owe capital-gains tax (a 1031 exchange can defer both). Figures are a year-1 estimate at your 24.0% rate — not tax advice; consult a CPA.
Schools (NCES district)
- District
- Volusia
- NCES district ID
- 1201920
- Math proficiency
- 44% ▼ -9.00%
- Reading proficiency
- 49% ▼ -3.00%
- Median HH income
- $42,946
- Composite
- 39.2/100
- National rank
- #4019
- State rank
- #47 of 73 in FL
Livability — Daytona Beach
- Score
- 83/100
- State rank
- #46
- US rank
- #867
Category grades
Schools grade is shown separately in the Schools card above.
Census & demographics
- County
- Volusia County · 556,871 people
- City population
- 67,539
- Metro
- Deltona-Daytona Beach-Ormond Beach, FL
- Population (ZIP)
- 30,955
- Household income
- $56,419
- Rent vs Own
- Severe rent burden
- 1781.0
Population outlook (Volusia County) Hauer SSP2
- Today (2025)
- 572,749 people
- By 2030
- 598,695 · +4.5%
- By 2040
- 644,880 · +12.6%
- By 2050
- 681,451 · +19.0%
- By 2075
- 759,957 · +32.7%
- By 2100
- 778,902 · +36.0%
Race, ethnicity, and origin ACS 2023
- Neighborhood character
- Diverse neighborhood (Simpson 0.63)
- Race & ethnicity
- White 53% Black 27% Hispanic / Latino 10% Two or more races 9% Asian 3%
- Hispanic origin (detail)
- Mexican 2% Puerto Rican 3%
- Common ancestry
- Romanian 2% Lithuanian 2% Slovak 1%
- Foreign-born
- 8% · Canada, Vietnam, Jamaica
- Languages at home
- 86% English-only · Spanish 8% Vietnamese 1% Other Indo-European 1%
Political lean MEDSL · Volusia
- 2024 margin
- Strong R (+21.8) · D 38.7% · R 60.5%
- 2008→2024 swing
- -27.4pp toward R · 2008: 5.7pp · 2024: -21.8pp
- All cycles
- 2024: R+21.8 2020: R+14.1 2016: R+13.1 2012: R+1.2 2008: D+5.7
Not yet ingested
- Civics
- —
Market trends
- HPI YoY
- ▼ -96.62%
- Current HPI
- 1084.54
- Rent YoY
- ▲ 1.01%
- Metro
- Deltona-Daytona Beach-Ormond Beach, FL
- State GDP YoY
- ▲ 3.28%
- F500 in state
- 36
Industry mix (Fortune 500 HQ in FL)
| Industry | F500 HQs | Revenue |
|---|---|---|
| Industrial Technology | 2 | $29B |
|
||
| Insurance | 2 | $17B |
|
||
| Retail | 1 | $60B |
|
||
| Technology Distribution | 1 | $58B |
|
||
| Homebuilding | 1 | $35B |
|
||
| Technology Manufacturing | 1 | $35B |
|
||
Price history
-2.3% since first listed3 events — show timeline
- 2026-04-30 Pending — Daytona MLS
- 2026-04-22 Price Changed $208,000 Daytona MLS
- 2026-04-13 Listed $213,000 Daytona MLS
Property tax history
+12.9%/yrLatest (2025): $3,228 · +252.2% YoY. Source: county tax records.
Cash-flow waterfall
monthlySold comps — $/sqft
last 12 mo · ≤1 miLoading sold comps…